August 22, 2026
When Expectations Matter More Than Earnings
There is a paradox at the heart of modern equity markets: a company can report a statutory loss of billions of dollars and watch its share price surge nearly 20% the same week. Meanwhile, another business can grow earnings by 6% and see its stock collapse by double digits. This is not irrational behaviour. It is the mathematics of expectation management, and it defines how the ASX earnings wrap BHP CSL NAB JB Hi-Fi results from August 2026 must be interpreted.
The August 2026 reporting season is arriving at a genuinely complex inflection point for the Australian economy. Household budgets remain compressed by elevated cash rates, real wage growth has struggled to outpace inflation, and commodity markets are bifurcating sharply. Furthermore, the ASX market performance across key sectors is being tested by these diverging forces, making this reporting season particularly consequential.
The Expectation Gap: A Framework for Reading Post-Result Reactions
Before examining the individual results, it is worth understanding a concept that investment professionals call the expectation gap — the distance between what the market had priced in before a result and what was actually delivered. In a reporting cycle marked by repeated earnings downgrades across multiple sectors, analyst consensus tends to migrate toward pessimism. Stocks get sold down in advance. Investor positioning skews defensively.
When a company merely avoids a further downgrade in that environment, the relief trade can be explosive. Conversely, a solid absolute result that fails to meaningfully exceed already-elevated expectations can trigger sharp selling. Understanding this dynamic is essential to interpreting the August 2026 reporting season without being misled by headline share price movements.
According to Morningstar's weekly earnings analysis, the August 2026 earnings season is less about absolute profit growth and more about whether companies are stabilising after a prolonged period of forecast reductions. Market reactions are being driven by expectation gaps, not just headline figures.
When big ASX news breaks, our subscribers know first
BHP Group (ASX: BHP): Copper Overtakes Iron Ore as the Earnings Engine
Headline Numbers and What Drove Them
BHP's fiscal 2026 result delivered underlying net profit after tax of USD 13.2 billion, or USD 2.60 per share, representing a 30% increase on the prior corresponding period. Total revenue climbed 15% to USD 58.8 billion, while underlying EBITDA expanded by 27% to USD 32.9 billion. Shares rose 3% on the day, though the valuation picture is considerably more complicated than the headline numbers suggest.
The driving force behind this result was copper, which for the first time surpassed iron ore as BHP's single largest earnings contributor. This is a structural milestone, not a cyclical accident. BHP has been deliberately repositioning its portfolio toward future-facing commodities over the past several years, and the fiscal 2026 result is the first clear financial expression of that strategic shift paying off at scale. The ongoing copper supply crunch has consequently amplified BHP's earnings power considerably.
Why Copper's Rise Changes the Investment Thesis
Copper's emergence as a primary earnings driver carries important implications for how analysts model BHP's future cash flows. Unlike iron ore, which is heavily exposed to Chinese steel production and construction activity, copper demand is increasingly tied to electrical infrastructure, electric vehicle manufacturing, renewable energy systems, and data centre power distribution. This is a structurally different demand profile, and it commands different assumptions about price sustainability.
However, copper is still a cyclical commodity. Prices are influenced by global industrial production, US dollar strength, inventory cycles, and speculative positioning in futures markets. The absence of an economic moat rating for BHP reflects precisely this reality: BHP's competitive position is commodity-price dependent rather than structurally defensible. When copper prices decline, BHP's earnings decline with them, and no amount of operational efficiency can fully offset that dynamic.
Dividend Policy and Shareholder Returns
The final dividend of USD 0.99 per share, fully franked, represented a 65% increase on the prior year's payment. Full-year dividends reached USD 1.72 per share, implying a payout ratio of 72% against BHP's stated minimum policy of 50%. This generosity exceeded analyst forecasts, and Morningstar's dividend per share estimates for fiscal 2027 through fiscal 2029 have been revised upward by an average of 9%, based on an assumed payout ratio of 60%, lifted from the previous assumption of 55%.
| Metric | FY2025 | FY2026 | Change |
|---|---|---|---|
| Underlying NPAT (USD bn) | ~10.2 | 13.2 | +30% |
| Revenue (USD bn) | ~51.1 | 58.8 | +15% |
| Underlying EBITDA (USD bn) | ~25.9 | 32.9 | +27% |
| Final Dividend (USD/share) | ~0.60 | 0.99 | +65% |
| Total Dividend (USD/share) | ~1.00 | 1.72 | +72% payout ratio |
Valuation: Strong Result, Stretched Price
Despite the earnings beat and dividend upgrade, the valuation picture for BHP remains concerning. Morningstar's fair value estimate has been raised 5% to AUD $46 per share, reflecting the time value of money and an anticipated USD 3.5 billion in proceeds from non-core asset disposals. Foreign exchange movements partially offset this upgrade.
At AUD $65.16 as at 20 August 2026, BHP shares trade at a 38% premium to fair value, earning a one-star rating. This valuation paradox means investors buying at current levels are, in effect, betting that copper prices remain elevated for a sustained period beyond what fundamental modelling supports.
Valuation Warning: BHP's current share price implies that the structural copper bull market persists well into the next decade. With no economic moat to cushion a commodity price downturn, investors should consider whether that assumption is already reflected in what they are paying today.
JB Hi-Fi (ASX: JBH): The Anatomy of a Consumer Demand Slowdown
Full-Year Results Versus the Forward Signal
JB Hi-Fi's full-year numbers were broadly acceptable on their face. Group sales grew 5% to AUD $11.1 billion, underlying earnings per share rose 6% to AUD $4.48, and operating earnings grew 4% despite modest EBIT margin compression. None of these figures would normally trigger a 12% share price decline.
The market was not selling the past. It was selling the future. The June 2026 quarter saw Australian same-store sales growth collapse to effectively flat year-on-year, a sharp deceleration from earlier in the fiscal year. More alarming was the disclosure that July 2026 trading deteriorated further. When a retailer's most recent available data point is worse than the previous bad quarter, the forward extrapolation becomes deeply uncomfortable. Market Index reported that the results foreshadow broader consumer headwinds extending well into fiscal 2027.
Three Structural Forces Compressing Consumer Electronics Demand
-
Cash rate and household budget pressure: Elevated borrowing costs are reducing the discretionary spending capacity of Australian households, particularly for big-ticket items like appliances and computing equipment. Home appliance demand is described as particularly soft.
-
Memory chip price inflation: This is a lesser-understood driver that deserves attention. Global demand for DRAM and NAND flash memory from hyperscale data centre operators has driven significant price increases at the semiconductor level. Australian consumers, already under budget pressure, are resisting these higher price points rather than upgrading devices on their normal replacement cycles.
-
Sentiment erosion ahead of income erosion: Consumer confidence surveys often lead actual spending by several months. Falling confidence is suppressing purchasing intentions even among households whose incomes have not yet materially declined. This creates a self-reinforcing cycle where sentiment weakness becomes a demand headwind in its own right.
The Margin Expansion Question That Determines Valuation
Morningstar raised its fair value estimate for JB Hi-Fi by a marginal 2% to AUD $58 per share, driven purely by time value of money rather than any reassessment of the business outlook. At AUD $69.20 as at 20 August 2026, the stock trades at a 24% premium to fair value.
The implied market assumption is striking. For JB Hi-Fi's current share price to be justified on a discounted cash flow basis, EBIT margins would need to average 7.5% across the next decade. That represents a 90 basis point uplift over the 6.6% EBIT margin actually achieved in fiscal 2026. In the context of deteriorating sales momentum and rising input costs, that is a demanding ask.
A narrow economic moat is assigned, reflecting JB Hi-Fi's genuine cost leadership and scale advantages within Australian consumer electronics retail. However, moats protect competitive positioning, not share prices. A business can have a durable competitive advantage and still be significantly overvalued.
National Australia Bank (ASX: NAB): Reading the Credit Cycle's Turning Point
Third-Quarter Profit and What the Market Focused On
NAB's third-quarter underlying profit of AUD $1.8 billion was up 2% on the quarterly average from the first half of fiscal 2026. Loan growth of 2% more than offset a modest contraction in net interest margins, and lower loan impairment charges provided additional support. On the surface, this looks like a quiet beat.
The market responded with a 4% share price decline. The reason lies not in the quarter just reported but in what the data implies for the quarters ahead. Several leading indicators embedded within the update point toward a deteriorating credit environment in fiscal 2027. The broader commodity price impact on corporate borrowers is also adding complexity to NAB's business lending outlook.
Net Interest Margins and the Competitive Erosion Problem
The benefit that Australian banks initially received from rising cash rates is being systematically eroded by competition. Home lending is intensely competitive, with lenders discounting aggressively to win and retain mortgage customers. Simultaneously, deposit pricing competition has increased as customers become more sophisticated about moving funds to higher-rate accounts. Both dynamics compress net interest margins from different directions.
| Credit Segment | Recent Growth Rate | FY2027 Forecast |
|---|---|---|
| Home Loans (system, year to June 2026) | 6.9% | ~2.5% |
| Business Lending (Q3, annualised) | ~8.0% | ~5.0% |
| Mortgage Applications (Q2 to Q3 change) | -15% | Declining |
The most significant forward indicator in the update is the 15% decline in mortgage applications from the second quarter to the third. This is driven by a combination of rate increases and federal budget tax changes affecting borrowing capacity. Mortgage applications are a leading indicator of credit growth with a typical lag of one to two quarters, meaning this decline is expected to translate directly into slower home loan book growth through fiscal 2027.
Business Credit: Strength With a Shelf Life
Business lending was the bright spot in NAB's third-quarter update, growing at an annualised pace of approximately 8%, comfortably outperforming the broader lending portfolio. NAB has a historically strong franchise in business and institutional banking, and this result reflects genuine market share performance.
However, the same macro forces that are compressing household budgets are beginning to affect business confidence and capital investment intentions. Weakening survey data on business confidence and declining forward investment plans suggest that the business lending tailwind is unlikely to be sustained. Consequently, a forecast slowdown to 5% business credit growth in fiscal 2027 reflects this expectation.
Valuation: Wide Moat, Wrong Price
NAB holds a wide economic moat, reflecting its network advantages, customer switching cost dynamics, and systemic importance within the Australian financial system. Wide moat businesses deserve premium valuations. The question is always how much of a premium is justified.
Morningstar's fair value estimate is held at AUD $33 per share, with the fiscal 2026 full-year profit forecast trimmed 2% to AUD $7.3 billion. At approximately AUD $39.27, NAB shares trade at roughly 18 to 20% above assessed fair value, earning a two-star rating. A forward price-to-earnings ratio of 17x and a fully franked dividend yield of 4.3% look stretched when the underlying profit growth assumption through fiscal 2030 is approximately 5% per annum.
Credit Cycle Watch: NAB's third-quarter update functions as an early warning signal for the broader Australian banking sector. Falling mortgage applications, NIM compression from competitive lending markets, and softening business confidence all point to a credit expansion cycle that supported bank earnings through 2024–2025 now beginning to reverse.
CSL Limited (ASX: CSL): Why a Statutory Loss Triggered a 17% Rally
Separating the Statutory Result From Operational Reality
CSL's fiscal 2026 result contains a headline figure that could easily alarm an investor reading quickly: a statutory net loss of USD 2.6 billion. Understanding why this figure is largely irrelevant to the investment case requires distinguishing between non-cash accounting charges and the actual operational performance of the business.
The statutory loss was driven by USD 7.1 billion in impairment charges and one-off costs, related primarily to the carrying value of assets acquired during CSL's transformative acquisition period, particularly the Vifor Pharma purchase completed in 2022. These are accounting adjustments, not cash outflows, and they do not reflect the underlying earnings power of the plasma collection, Behring biopharmaceutical, and specialty pharmaceutical divisions.
The operationally relevant figure is underlying net profit after tax attributable to shareholders (NPATA) of USD 3.14 billion, which was broadly in line with guidance provided in May 2026. Total revenue for the year came in at approximately USD 15.8 billion.
The Psychology Behind an 18% Single-Day Rally
CSL shares surged approximately 17 to 18% on 18 August 2026. To understand why, it is necessary to understand what preceded it. Over the 12 months leading into the fiscal 2026 result, CSL had issued three consecutive earnings downgrades. Each downgrade reset market expectations lower. Each reset created a new fear that the next guidance update would bring a fourth.
When the result arrived without a further downgrade, and was accompanied by fiscal 2027 guidance for approximately 5% underlying profit growth, the relief was acute. Investors who had been positioned defensively, or had simply avoided the stock anticipating another negative surprise, scrambled to reassess. The rally reflects the unwinding of that bearish positioning more than it reflects a sudden improvement in CSL's fundamental business quality.
This is expectation management in its most visible form, and it is a recurring feature of how markets price businesses that have been through extended periods of forecast reductions.
FY2027 Guidance: Division by Division
| Division | FY2027 Outlook | Key Driver |
|---|---|---|
| Immunoglobulin (Ig) | Market-rate growth | Plasma collection recovery |
| Behring (plasma margins) | Partial margin recovery | Recouping FY2026 losses |
| Vifor (iron deficiency/nephrology) | ~25% revenue decline | Generic competition entry |
The Vifor division's guided 25% revenue decline due to generic drug competition deserves context. Generic entry into specialty pharmaceutical markets is a well-understood and largely inevitable process. Importantly, Vifor represents approximately 10% of CSL's midcycle earnings, which limits its impact on the overall valuation.
Morningstar's long-term model already assumes essentially zero net growth from Vifor over a decade, meaning the fiscal 2027 headwind is already embedded in the fair value assessment rather than representing a new risk. The more significant story is, in addition, the recovery trajectory of the core plasma business.
CSL: The Only Fairly Valued Name in This Earnings Wrap
Morningstar maintains its fair value estimate for CSL at AUD $165 per share, with modest revenue estimate reductions offset by lower assumed operating costs. At AUD $168.30 as at 20 August 2026, CSL shares are assessed as approximately fairly valued, earning a three-star rating and a narrow economic moat designation reflecting its proprietary plasma collection network and biopharmaceutical manufacturing capabilities.
Contrarian Perspective: Among all four companies in this ASX earnings wrap BHP CSL NAB JB Hi-Fi analysis, CSL is the only one trading near intrinsic value. For long-term investors, a recovering core plasma business, manageable Vifor headwinds, and a credible return to profit growth may offer a more favourable risk-reward profile than the materially overvalued resources and banking names reporting in the same week.
Cross-Sector Comparison: What This Earnings Week Reveals About ASX Valuation
The Divergence Picture in a Single Table
| Company | Sector | Fair Value (AUD) | Market Price (AUD) | Premium/Discount | Star Rating | Moat |
|---|---|---|---|---|---|---|
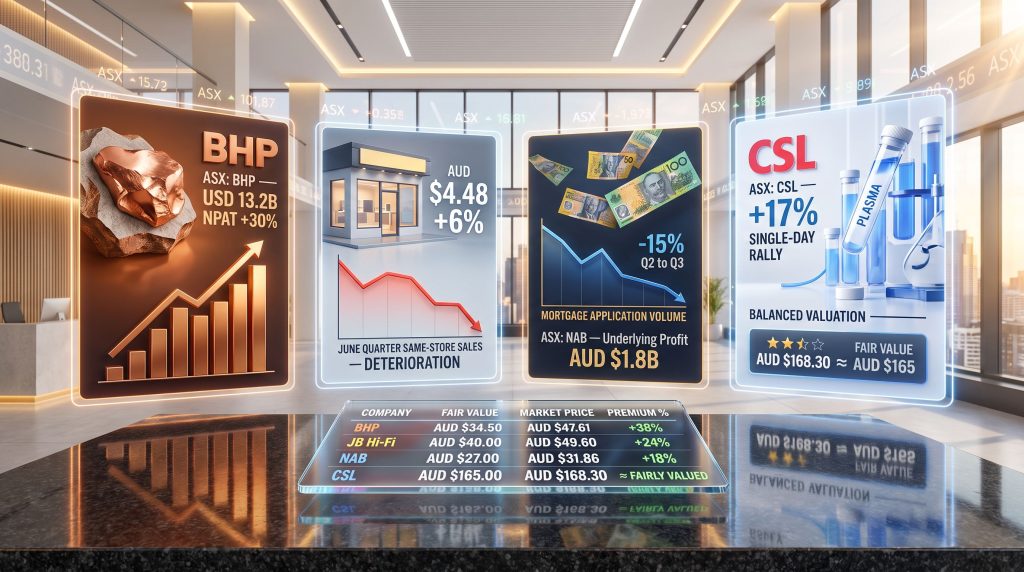
| BHP | Materials | $46.00 | $65.16 | +38% overvalued | ★ | None |
| JB Hi-Fi | Consumer Discretionary | $58.00 | $69.20 | +24% overvalued | ★★ | Narrow |
| NAB | Financials | $33.00 | ~$39.00 | +18-20% overvalued | ★★ | Wide |
| CSL | Healthcare | $165.00 | $168.30 | ~Fairly Valued | ★★★ | Narrow |
The absence of any four- or five-star rated company among four of the ASX's largest names is itself an important data point. It suggests that broader ASX valuations remain elevated relative to fundamental fair value assessments, even after accounting for earnings upgrades in the resources sector and recovery narratives in healthcare.
Three Forward-Looking Themes From the August 2026 Reporting Season
-
Commodity mix is now the primary earnings lever in materials: BHP's copper-driven result demonstrates that which commodity a diversified miner is most exposed to matters far more than operational efficiency alone. Furthermore, investors in materials stocks should pay close attention to commodity revenue disaggregation in results, not just headline profit figures. The China steel outlook remains a key variable for how iron ore-exposed miners perform relative to copper-weighted peers.
-
Consumer stress is not transitory: JB Hi-Fi's deteriorating July trading data and NAB's collapsing mortgage application volumes both point toward a prolonged period of household budget constraint extending well into the first half of fiscal 2027. Businesses with significant Australian consumer revenue exposure face a difficult operating environment ahead.
-
Healthcare recovery is underway but already priced in: CSL's return to growth guidance is credible and operationally grounded, but the fair value assessment suggests the market has already absorbed the positive signal. New investors entering at current prices are paying for a recovery that is already reflected in the share price.
Key Risks to Monitor Across All Four Companies
-
BHP: A sustained copper price correction remains the primary risk. Non-core asset sale execution and the trajectory of Chinese industrial demand are secondary considerations worth monitoring through fiscal 2027.
-
JB Hi-Fi: Further consumer sentiment deterioration beyond July 2026 trading conditions, persistence of memory chip price inflation at the retail level, and the risk of competitive margin pressure if volume growth stalls.
-
NAB: Acceleration of NIM erosion beyond current modelling, potential credit quality deterioration if unemployment rises materially, and any changes to bank regulatory capital requirements that could constrain dividend capacity.
-
CSL: Intensification of generic competition in the Vifor portfolio beyond the guided 25% revenue decline, delays in plasma collection cost normalisation, and execution risk within the clinical development pipeline.
The next major ASX story will hit our subscribers first
Frequently Asked Questions: ASX Earnings Season August 2026
What drove BHP's 30% profit increase in FY2026?
BHP's profit growth was primarily driven by record copper prices, which elevated copper to the position of BHP's largest earnings contributor for the first time, surpassing iron ore. Revenue grew 15% to USD 58.8 billion, with underlying EBITDA expanding 27% to USD 32.9 billion.
Why did JB Hi-Fi shares fall 12% despite reporting earnings growth?
While full-year earnings per share rose 6% to AUD $4.48, the market reacted negatively to deteriorating forward momentum. Australian same-store sales were essentially flat in the June 2026 quarter, and July 2026 trading showed further weakness. The selloff reflected forward expectations, not the historical result.
Why did CSL shares surge after reporting a statutory loss?
CSL's USD 2.6 billion statutory loss was driven by USD 7.1 billion in non-cash impairment charges, not operational deterioration. Underlying earnings met guidance, and fiscal 2027 guidance for approximately 5% profit growth was sufficient to trigger a significant re-rating after three consecutive prior downgrades had positioned investors defensively.
Is NAB a good investment at current prices?
Based on Morningstar's fair value assessment of AUD $33 per share, NAB's shares appear approximately 18 to 20% overvalued at AUD $39.00. A forward P/E of 17x and a fully franked dividend yield of 4.3% look stretched given forecast profit growth of approximately 5% per annum through fiscal 2030 and emerging credit cycle headwinds.
Which company in this ASX earnings wrap offers the best value?
Among the four companies covered, CSL is the only one assessed as trading near fair value, making it the most attractive on a pure valuation basis at the time of this analysis. BHP carries the largest premium to fair value at 38%, followed by JB Hi-Fi at 24% and NAB at approximately 18 to 20%.
Key Takeaways: ASX Earnings Wrap Summary, August 2026
-
BHP delivered the strongest absolute earnings result in this cohort, powered by copper's ascent to the top of its commodity earnings mix, but at AUD $65.16 trades at a 38% premium to a AUD $46 fair value estimate.
-
JB Hi-Fi faces a genuine near-term demand challenge as household budget pressures, technology price inflation from semiconductor cost passthrough, and deteriorating consumer sentiment converge to suppress electronics spending into fiscal 2027.
-
NAB is navigating an inflection point in the Australian credit cycle, with falling mortgage applications and competitive NIM erosion signalling a structurally harder operating environment than the third-quarter headline profit suggested.
-
CSL stands as the standout valuation case, trading near intrinsic value with a credible recovery pathway in its core plasma business and manageable, already-embedded headwinds from generic competition in the Vifor division.
-
Across all four results, the dominant theme of the ASX earnings wrap BHP CSL NAB JB Hi-Fi season is that expectation management is driving share price outcomes more than headline profit quality. Investors navigating this reporting season would do well to focus as much on what the market had priced in before results as on the numbers themselves.
This article is intended for informational purposes only and does not constitute financial advice. All fair value estimates, star ratings, and moat assessments referenced are sourced from Morningstar Australia's equity research published on 20 August 2026. Share prices are as at 20 August 2026 where available. Past performance is not indicative of future results. Investors should consider their own financial circumstances before making investment decisions.
Want to Spot the Next Major ASX Mineral Discovery Before the Market Does?
While this earnings wrap highlights the importance of expectation management across BHP, CSL, NAB, and JB Hi-Fi, Discovery Alert's proprietary Discovery IQ model takes a different approach — instantly alerting subscribers to significant new ASX mineral discoveries the moment they are announced, turning complex geological data into actionable opportunities. Explore historic discoveries and their extraordinary returns, then begin a 14-day free trial to position yourself ahead of the broader market.