June 10, 2026
When Oil Markets Dictate Monetary Policy: The 2026 Inflation Trap Squeezing Australian Investors
There are moments in economic history when external forces align with pre-existing domestic vulnerabilities to create conditions that central banks are fundamentally ill-equipped to address cleanly. The convergence of geopolitical disruption in the Middle East, a petrol price spike of historic proportions, and an already elevated Australian inflation baseline has produced exactly that kind of moment in 2026. For investors navigating ASX inflation and RBA rate hike fears, understanding the layered architecture of this problem matters far more than simply tracking daily index movements.
When big ASX news breaks, our subscribers know first
The Geopolitical Fuse That Lit Australia's Inflation Problem
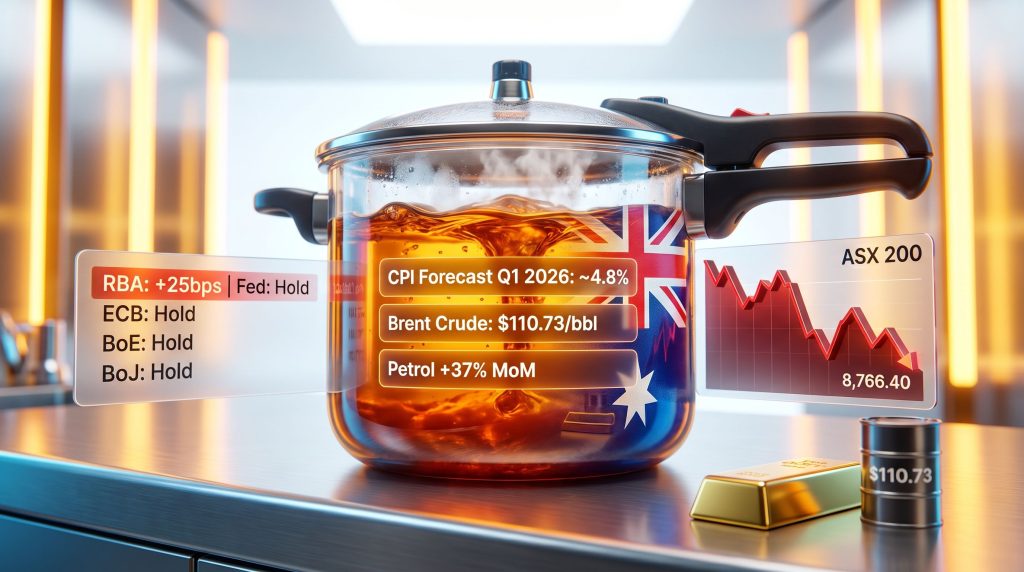
Global energy markets operate as transmission belts. Disruption in one region does not stay contained — it reprices cost structures for consumers, businesses, and governments across the entire interconnected system. The escalation of U.S.-Israeli military operations against Iran in early 2026 injected precisely that kind of disruption into crude oil markets, pushing Brent Crude above $110.73 per barrel, a psychologically and technically significant threshold representing a 2.3% single-session gain at the time of writing.
For Australian households, the most immediate consequence arrived at the petrol pump. Fuel prices surged approximately 37% month-on-month in March 2026 alone, according to market analysis published by The Market Online on April 29, 2026. That single data point is not merely noteworthy — it is the dominant force shaping what the Australian Bureau of Statistics is widely expected to reveal in its upcoming monthly CPI release. Furthermore, oil price movements and trade war dynamics continue to amplify the pressure on domestic cost structures.
The energy-to-inflation transmission mechanism works through several channels simultaneously:
- Petrol costs rise directly for consumers, reducing disposable income
- Transport and logistics costs increase across supply chains, flowing into food and goods pricing
- Business energy input costs rise, compressing margins or triggering price increases to customers
- Consumer confidence deteriorates as fuel costs become visible and unavoidable daily expenditure
Each of these channels compounds the inflationary impulse over successive quarters, which is why energy price shocks carry outsized policy significance relative to their initial CPI contribution.
Australia's CPI Trajectory: What the March Quarter Data Is Expected to Confirm
The ABS monthly CPI release scheduled for April 29, 2026 carries exceptional weight. Forecasters broadly expect the data to show headline inflation approaching 4.8% for the March quarter, which would represent the highest reading since calendar year 2023 and a material deterioration from prior quarters.
| Metric | Reading | Context |
|---|---|---|
| Forecast Q1 2026 Headline CPI | ~4.8% | Highest since CY2023 |
| Petrol Price Change (March MoM) | +37% | Primary CPI driver |
| Brent Crude Price | $110.73/bbl | Above key resistance |
| ASX 200 Weekly Loss | ~2-2.5% | Sustained bearish pressure |
| ASX 200 Monthly Loss | 6%+ | Structural risk-off shift |
| AUD/USD | US$0.718 | Competing macro forces |
Source: The Market Online, April 29, 2026
A critical analytical distinction worth examining is whether this inflation spike reflects a narrow, energy-driven distortion or something more structurally entrenched. Analysis from NAB economists, as reported by The Market Online, suggests the March quarter data should confirm that inflation was already running too high and broad-based before the Middle East conflict escalated oil prices further. However, the same analysis indicates the data may not demonstrate that domestic demand pressures were meaningfully accelerating heading into early 2026.
This distinction carries enormous practical significance. A pure external supply shock that leaves domestic demand fundamentals intact is theoretically self-correcting over time, as energy prices normalise and cost-push effects fade. By contrast, if trimmed mean and core inflation measures confirm broad-based domestic price pressures, the RBA faces a far more intractable problem requiring sustained monetary tightening regardless of what happens to global oil prices.
Investors and economists watching the ABS release should pay particular attention to the trimmed mean CPI measure, which strips out the most volatile price movements including energy to reveal underlying inflation momentum. This number may tell a very different story to the headline figure.
Consequently, the impact of tariffs on investment markets adds yet another layer of complexity to an already fraught inflation outlook for Australian investors.
RBA Rate Hike Expectations: Australia Stands Apart From Global Peers
The policy implications of a 4.8% inflation print are difficult to overstate for the Reserve Bank of Australia. Market pricing through ASX 30 Day Interbank Cash Rate Futures has shifted materially ahead of the next RBA board meeting scheduled for Tuesday, with a 25 basis point rate increase representing the clear consensus expectation among market participants. In addition, the RBA rate tracker provides real-time implied probability data that investors can monitor directly to gauge how expectations are shifting in the lead-up to each board meeting.
What makes Australia's situation analytically distinctive is the degree to which it diverges from the global central bank landscape. While the RBA is expected to tighten, every other major developed economy central bank is expected to hold rates steady, adopting cautious but non-committal hawkish communication rather than active policy adjustment.
| Central Bank | Expected Action | Policy Tone |
|---|---|---|
| Reserve Bank of Australia | +25 bps hike | Hawkish |
| U.S. Federal Reserve | Hold | Cautious/Hawkish |
| European Central Bank | Hold | Cautious |
| Bank of England | Hold | Cautious |
| Bank of Japan | Hold | Cautious |
This divergence has layered implications. On one hand, a unilateral RBA rate hike relative to global peers could provide short-term support to the Australian dollar through widening interest rate differentials. On the other hand, it also concentrates financial market risk domestically, as higher borrowing costs arrive at a time when household balance sheets are already stretched from the 2022-2023 tightening cycle, during which the RBA raised the Official Cash Rate from 0.10% to 4.35% in one of the most compressed tightening sequences in the institution's history.
What Could Cause the RBA to Pause Rather Than Hike?
Not all analysts are uniformly convinced a hike is inevitable. Several scenarios could shift the board's calculus:
- A CPI print materially below the 4.8% consensus forecast would reduce the urgency for immediate tightening and allow the board to collect additional data
- Evidence of transitory rather than self-reinforcing petrol inflation could support a wait-and-see posture
- Deteriorating Chinese demand signals affecting iron ore prices and Australian export revenues could shift the growth-inflation trade-off
- Global financial stability concerns arising from prolonged Middle East conflict could prompt coordinated central bank caution
The RBA's dual mandate of price stability and full employment creates inherent tension when supply-side shocks simultaneously threaten inflation control and economic growth. This is fundamentally different from managing excess domestic demand, where tighter monetary policy reliably cools both inflation and employment simultaneously. Furthermore, Commonwealth Bank's inflation warning highlights the concern that even if the RBA holds the line, sticky underlying price pressures may force the board's hand in subsequent meetings.
Seven Consecutive Sessions of Losses: Reading the ASX 200's Bearish Signal
By the morning of April 29, 2026, the ASX 200 was positioned for its seventh consecutive session in negative territory, with futures signalling a further -0.3% open. The last recorded positive close had been Monday, April 20, 2026, a span that already felt considerably longer to market participants given the relentless nature of the selling pressure.
To put the magnitude in perspective: the index had already shed approximately 0.23% (20.10 points) to 8,766.40 in the prior session, with weekly losses tracking between 2% and 2.5% and monthly drawdowns exceeding 6%. This is not the profile of a technical correction or routine profit-taking. It reflects a fundamental repricing of Australian equity risk premiums in response to a shifting monetary policy outlook. Indeed, the ASX market performance under commodity pressure analysis underscores how resource-driven volatility is amplifying these broader index losses.
A seven-session losing streak, combined with a 6% monthly drawdown, typically signals that sellers are not merely responding to short-term news flow but repositioning around a new forward earnings and discount rate assumption. The shift from cautious optimism to entrenched bearishness rarely reverses quickly.
Technical analysis adds another dimension. Profit-booking concentration around the 8,770 level on the ASX 200 suggests that chart-based resistance is reinforcing fundamentally-driven liquidation — a convergence that tends to produce more durable selling episodes than either force alone would generate.
Sector-Level Impact: Who Bears the Heaviest Burden?
The rate-hike and inflation environment does not affect all ASX sectors equally. Understanding the differential impact is essential for portfolio positioning.
Sectors facing the strongest headwinds:
- Real Estate and REITs face the most direct valuation compression as rising discount rates mechanically reduce asset net present values
- Consumer Discretionary stocks are squeezed from two directions simultaneously: higher mortgage repayments reduce household spending capacity while input cost inflation compresses margins
- High-Growth Technology and Speculative Small Caps carry the greatest duration sensitivity, meaning their valuations are most exposed to upward shifts in the risk-free rate
- Healthcare faces a combination of inflation-sensitive cost structures and regulatory pricing constraints that limit margin recovery
Sectors with potential relative resilience:
- Energy producers benefit directly from Brent Crude prices exceeding $110 per barrel, translating geopolitical disruption into revenue support
- Materials companies with commodity price exposure can partially offset broader market weakness through inflation-driven pricing power
- Utilities with regulated pricing structures may achieve partial cost pass-through, providing some defensive characteristics
Commodity Markets: A Mixed Picture Beneath the Surface
The commodity complex in late April 2026 presents a more nuanced picture than headline energy price strength suggests, with important divergences across sub-sectors carrying distinct implications for ASX-listed resource producers.
| Commodity | Price | Movement | ASX Implication |
|---|---|---|---|
| Brent Crude | $110.73/bbl | +2.3% | Positive for energy producers |
| Iron Ore (Singapore) | $106.40/tonne | -0.5% | Headwind for major miners |
| Gold | $4,608/oz | Declining | Counterintuitive in risk-off environment |
| U.S. Natural Gas Futures | $2.68/GJ | -1.7% | Divergence from crude oil dynamics |
Source: The Market Online, April 29, 2026
The iron ore weakness, down 0.5% to $106.40 per tonne in Singapore, deserves particular attention. Australia's largest trading partner remains China, and the Chinese steel sector is the primary demand driver for Australian iron ore exports. Any deterioration in Chinese construction activity or industrial output flows directly into iron ore pricing and, consequently, into the revenues and share prices of ASX-listed mining majors. For a deeper examination, iron ore price trends and China demand prospects remain a key variable for any portfolio with materials exposure.
Gold's continued retreat to $4,608 per ounce presents an interesting analytical puzzle. In conventional market frameworks, risk-off environments and geopolitical uncertainty typically support gold demand as a safe-haven asset. The fact that gold is declining during a period of genuine market stress suggests that U.S. dollar strength and profit-taking from investors who entered gold at lower levels may be dominating traditional safe-haven dynamics. However, gold as a safe-haven investment retains its structural relevance for investors seeking portfolio protection across a tightening cycle.
Perhaps the most instructive observation is the divergence between crude oil (up 2.3%) and natural gas futures (down 1.7%). Markets are clearly differentiating between energy sub-sectors based on commodity-specific supply and demand fundamentals rather than pricing a uniform energy shock. This tells sophisticated investors that the geopolitical premium is being applied selectively, concentrated in crude oil directly affected by Middle East supply disruption rather than spreading indiscriminately across the energy complex.
The next major ASX story will hit our subscribers first
Portfolio Strategy Frameworks for an Inflationary Rate-Hike Environment
Navigating the convergence of ASX inflation and RBA rate hike fears requires a structured analytical approach rather than reactive positioning. Four frameworks offer practical guidance for investors reassessing portfolios in this environment.
Framework 1: Duration Risk Reduction
Long-duration assets — those whose value depends heavily on cash flows far into the future — are mechanically most sensitive to discount rate increases. High price-to-earnings technology stocks and speculative small caps fall into this category. Reducing exposure toward shorter-duration, cash-flow-generative businesses with demonstrable pricing power provides a structural hedge against continued rate pressure.
Framework 2: Inflation Pass-Through Screening
Not all businesses are equally vulnerable to rising input costs. Companies with contractual pricing mechanisms, commodity exposure, or regulated revenue structures can pass inflation to customers more effectively. Screening portfolios for this characteristic separates genuinely defensive holdings from businesses whose margins will be structurally eroded.
Framework 3: Defensive Rebalancing Toward Inelastic Demand
Businesses serving non-discretionary demand — such as essential services, basic food production, and infrastructure — typically experience more stable revenue during economic contractions triggered by monetary tightening. Increasing allocation toward these characteristics reduces portfolio beta during the period between the first rate hike and eventual policy clarity.
Framework 4: Monitoring ASX Rate Futures as a Leading Indicator
The ASX 30 Day Interbank Cash Rate Futures, commonly referred to as the RBA Rate Tracker, provide real-time market-implied probabilities for Official Cash Rate movements at each scheduled board meeting. Monitoring shifts in these implied probabilities, particularly in the weeks surrounding each meeting, offers a data-driven early warning signal for positioning ahead of formal RBA announcements. Material shifts in probability pricing often precede significant equity market moves by several sessions.
What Historical RBA Tightening Cycles Reveal About ASX Recovery Timelines
Historical patterns from previous RBA tightening cycles offer some calibration for expectations, though they should be treated as context rather than prediction. During prior cycles, the ASX 200 has typically experienced its most acute weakness in the three to six months preceding the terminal rate, followed by gradual recovery as monetary policy transmission works through the economy.
The current situation differs from the 2022-2023 cycle in one important structural respect. That cycle was driven primarily by excess domestic and global demand following pandemic-era fiscal stimulus, creating broad-based inflationary pressure that required aggressive and sustained monetary tightening. The current inflationary episode is more concentrated in external supply-side disruption, specifically oil market volatility linked to geopolitical events.
This distinction suggests that if the underlying geopolitical catalyst resolves or stabilises, the inflationary impulse may prove shorter-lived than the 2022-2023 cycle, potentially limiting both the duration and magnitude of any new RBA tightening sequence. That said, the NAB analysis cited earlier introduces an important caveat: inflation was already running too high and broad-based before the Iran shock materialised, meaning the RBA cannot simply attribute all current inflationary pressure to a transitory external shock and wait for it to pass.
Frequently Asked Questions: ASX Inflation and RBA Rate Hike Fears
What is the inflation forecast for Australia in Q1 2026?
Headline CPI for the March 2026 quarter is broadly forecast at approximately 4.8%, which would represent the highest reading since calendar year 2023. The primary driver is a sharp spike in petrol prices, directly attributable to geopolitical disruption in the Middle East affecting global crude oil supply and pricing.
Why is the RBA expected to raise rates when other central banks are holding?
Australia's inflation profile has diverged from major peers due to the domestic transmission of global energy price shocks combined with pre-existing broad-based price pressures. The RBA's mandate requires responding to persistent inflation regardless of global central bank positioning, creating the policy divergence visible in the comparison table above.
How many consecutive days has the ASX 200 fallen heading into late April 2026?
The ASX 200 was tracking toward its seventh consecutive session of losses as of April 29, 2026, with the last positive close recorded on April 20, 2026. Monthly losses have exceeded 6%, reflecting a sustained deterioration in investor risk appetite rather than short-term volatility.
Which ASX sectors are most vulnerable to rising interest rates?
Rate-sensitive sectors including real estate investment trusts, consumer discretionary stocks, and high-growth technology companies face the greatest valuation pressure. Healthcare and some financial sub-sectors also face structural headwinds, though certain banking businesses may benefit from improved net interest margins over time as rates rise.
How can investors use the ASX Rate Tracker to anticipate RBA decisions?
The ASX 30 Day Interbank Cash Rate Futures provide market-implied probabilities for Official Cash Rate movements at each RBA board meeting. Monitoring shifts in these contracts, particularly in the weeks preceding scheduled meetings, gives investors a data-driven signal for potential portfolio repositioning ahead of formal announcements.
Does iron ore weakness compound the ASX's current difficulties?
Yes, significantly. Iron ore declining 0.5% to $106.40 per tonne in Singapore adds pressure to ASX-listed mining and materials companies that form a substantial portion of index market capitalisation. Given Australia's structural export dependency on Chinese steel demand, any continued softness in Chinese industrial activity represents a compounding headwind alongside the ASX inflation and RBA rate hike fears already in play.
The material in this article is intended for informational and educational purposes only and does not constitute financial or investment advice. All market data referenced is sourced from The Market Online, April 29, 2026. Forecasts, projections, and historical comparisons are subject to inherent uncertainty. Readers are encouraged to conduct independent research and consult a qualified financial adviser before making any investment decisions.
Want to Stay Ahead of Major ASX Discoveries Amid Market Volatility?
While inflation pressures and RBA rate hike fears continue to reshape ASX sector dynamics, Discovery Alert's proprietary Discovery IQ model delivers real-time alerts on significant mineral discoveries the moment they are announced — cutting through market noise to surface actionable investment opportunities for both short-term traders and long-term investors. Explore how historic discoveries have generated substantial returns by visiting Discovery Alert's dedicated discoveries page, and begin your 14-day free trial today to position yourself ahead of the broader market.