June 10, 2026
The Quiet Science Behind Where Exploration Capital Goes
Before a single drill rod enters the ground, enormous quantities of capital, geological intelligence, and strategic calculation have already been deployed. Mineral exploration is not a reactive industry — it operates on multi-year thesis cycles, where investment decisions made today reflect assumptions about commodity demand, regulatory environments, and geological prospectivity that may not resolve for a decade or more. Understanding why Australian mineral exploration spending near $1b is not simply a headline data point, but a signal embedded in a much longer structural story, requires looking at the mechanics of how and where exploration dollars actually flow.
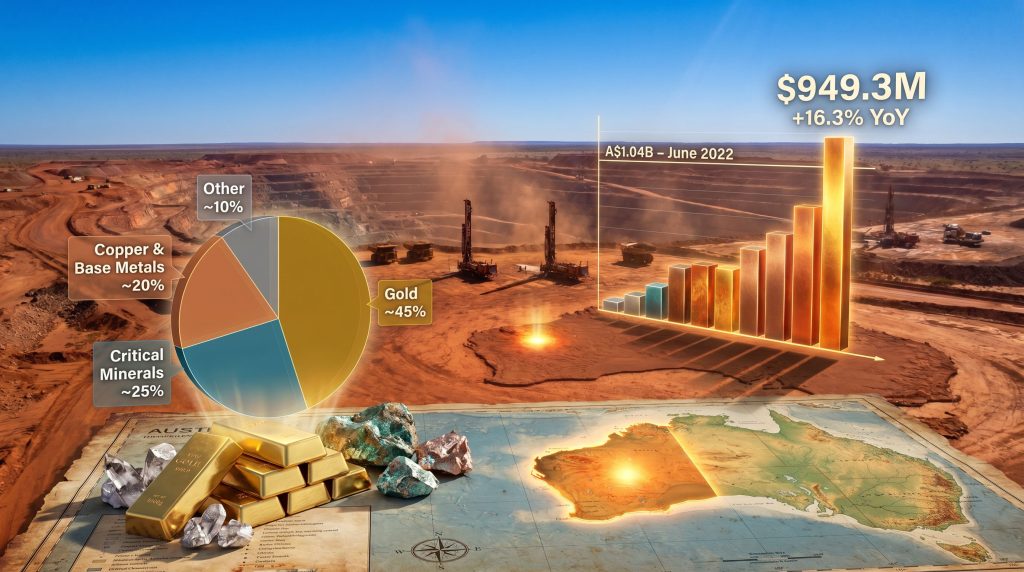
The Australian Bureau of Statistics Q3 FY26 data recording national mineral exploration expenditure at $949.3 million represents a 16.3% year-on-year increase — a figure that deserves more than surface-level interpretation. It reflects capital allocation decisions shaped by geology, policy architecture, commodity price cycles, and the distinct psychology of junior explorer funding markets.
When big ASX news breaks, our subscribers know first
The Cyclical Architecture of Australian Exploration Spending
Australia's exploration expenditure history follows a recognisable pattern: commodity-driven surges, mid-cycle corrections, and structurally supported recoveries. The current trajectory maps onto this pattern with notable precision. The junior mining investment landscape in 2025 further contextualises why this recovery has proven more durable than previous cycles.
The June 2022 quarter produced a record A$1.04 billion in single-quarter exploration expenditure, driven primarily by the intensity of lithium and battery metals activity during the electric vehicle demand wave. That peak was followed by a moderation phase that saw spending settle closer to the $800 million range, as lithium price normalisation and margin compression reduced the commercial case for aggressive program expansion.
The current recovery to $949.3 million is structurally different from that 2022 surge. Rather than being dominated by a single commodity theme, it reflects a broader distribution of capital across gold, copper, and critical minerals — a more resilient base that is less vulnerable to a single commodity price reversal.
| Period | Approximate Expenditure | Primary Driver |
|---|---|---|
| June 2022 Quarter | A$1.04 billion (record) | Lithium and battery metals boom |
| Post-2022 Correction | ~$800 million | Price normalisation, junior funding constraints |
| Q3 FY26 | $949.3 million (+16.3% YoY) | Gold strength, critical minerals, copper demand |
The distinction between a commodity-specific spending surge and a broad-based recovery is critical for assessing durability. The current cycle's multi-commodity character suggests greater resilience, though it does not eliminate downside risk from simultaneous commodity price pressure across multiple categories.
Commodity Allocation: Where the $949.3 Million Is Actually Going
Gold's Enduring Structural Dominance
Gold commands approximately 45% of total exploration expenditure, a share that has remained relatively stable across cycles because of its unique commercial characteristics. Unlike battery metals, which are subject to concentrated demand from specific manufacturing sectors, gold retains a dual role as both a monetary hedge asset and a high-margin production target — properties that sustain explorer interest across varying macroeconomic conditions.
Elevated gold prices through 2025 and into 2026 have done something particularly important for exploration economics: they have extended the economic radius of viable programs. Deposits and terrains that were marginal at lower gold prices become commercially attractive targets when the gold price supports higher all-in sustaining cost thresholds. This dynamic has encouraged greenfield activity in previously underexplored areas, particularly in Western Australia's Eastern Goldfields.
Projects advancing from exploration into definitive feasibility study territory — such as Rox Resources' Youanmi gold project in WA, which delivered a high-margin production target profile in a DFS — demonstrate how elevated prices are translating exploration spend into credible production pathways. Furthermore, the evolution of exploration trends across Australia in 2025 highlights how gold's dominance continues to shape program design and capital allocation decisions.
Critical Minerals: The Strategic Overhang
Critical minerals exploration — covering lithium, nickel, and rare earth elements — has expanded its share of total spending materially over the past three years, now accounting for approximately 25% of national exploration expenditure. This is notable because it has occurred against a backdrop of significant commodity price volatility, particularly for lithium carbonate and nickel, which have both experienced sharp corrections from their 2022 peaks.
The sustained exploration investment despite softer prices reflects the strategic logic underpinning these programs. Supply chain security considerations, allied nation demand signals, and federal policy incentives have collectively maintained exploration activity even when spot prices alone would not justify it. This creates an unusual market dynamic: exploration capital is being deployed on strategic grounds rather than purely commercial ones. Consequently, the standard price-to-exploration-spend correlation is weaker for critical minerals than for gold.
However, this also introduces a specific risk. Exploration investment supported by strategic rationale rather than commercial economics is inherently more vulnerable to policy shifts, funding cycle changes, and institutional reassessment. The Reserve Bank of Australia's research paper The Global Energy Transition and Critical Minerals makes this uncertainty explicit, identifying that global price declines have already halted some production and delayed investment timelines, with growth expected to remain subdued in the near term. In addition, critical minerals and energy security remain central to Australia's broader strategic positioning in the global supply chain.
Investors should carefully distinguish between the exploration-stage commitment of capital and the much longer pathway to production-stage returns, which remains subject to global pricing dynamics, policy continuity, and downstream processing economics.
Copper: The Long-Duration Electrification Thesis
Copper exploration represents approximately 20% of national spend and is increasingly recognised as a long-duration thematic rather than a cyclical trade. The demand drivers for copper — grid infrastructure expansion, EV adoption at scale, and the explosive power requirements of data centre buildout — are structural and multi-decade in character. The copper market supply crunch unfolding through 2025 adds further urgency to upstream exploration investment in this commodity.
What makes copper particularly interesting from an exploration investment perspective is Australia's relative underexploration relative to its geological endowment. The continent's copper potential remains materially undercharacterised compared to its gold and iron ore systems, creating a discovery opportunity for programs targeting copper-gold systems in underexplored corridors. Multi-commodity explorers targeting copper-gold mineralisation capture dual commodity optionality within single programs, improving the economics of early-stage investment.
| Commodity | Estimated Share of Exploration Spend | Key Demand Driver |
|---|---|---|
| Gold | ~45% | Monetary hedge, high-margin production |
| Critical Minerals (Li, Ni, REEs) | ~25% | Battery supply chains, strategic policy |
| Copper and Base Metals | ~20% | Electrification, grid infrastructure |
| Other (Coal, Iron Ore, Uranium) | ~10% | Legacy production maintenance |
Western Australia's Capital Gravity: Understanding the Two-Thirds Concentration
Western Australia absorbs approximately two-thirds of total national exploration expenditure — a concentration that reflects more than just geological endowment, though that endowment is extraordinary in its own right.
The key geological provinces attracting capital include:
- The Eastern Goldfields, home to world-class gold systems and ongoing high-grade discoveries
- The Pilbara, with iron ore dominance but increasing multi-commodity interest
- The Albany-Fraser Orogen, a setting geologists increasingly recognise as favourable for large-scale mineral systems, attracting multi-commodity exploration programs targeting nickel, copper, and gold
- The Yilgarn Craton, one of the world's largest Archaean cratons and a globally significant repository of gold mineralisation
The Albany-Fraser Orogen deserves specific attention. While less discussed in mainstream mining coverage than the Eastern Goldfields, this geological province has attracted increasing technical interest because of its potential to host large-tonnage mineral systems. Catalina Resources' recent entry into the region through its Eastern Goldfields copper-gold acquisition reflects a broader industry recognition of the orogen's prospectivity.
Beyond geology, WA's regulatory infrastructure, established service industry ecosystem, and physical infrastructure corridors reduce the per-dollar cost of exploration relative to more remote or less developed jurisdictions — a structural cost advantage that reinforces capital concentration over time.
The WA Regulatory Correction and Its Exploration Economics Impact
A development that received insufficient attention in broader market commentary was the WA Government's legislative amendment addressing the tax status of miscellaneous mining licences. A Western Australia Supreme Court ruling had determined that local governments could levy rates on land held under these licences — a decision that had the potential to impose millions of dollars in additional costs on exploration and mining companies across the state.
The WA Government's move to legislate a correction removes this cost overhang. For exploration companies holding multiple miscellaneous licences across large tenement packages — which is standard practice for companies conducting systematic regional exploration — the ruling's reversal materially improves the economics of holding and advancing tenure. This is not a minor administrative fix; it is a genuine improvement in the unit economics of WA exploration programs.
Policy Architecture: The Federal Investment Framework
The Federal Government's commitment of $22.7 billion across five strategic priorities, with critical minerals and natural resource development as central pillars, establishes a policy environment that is materially supportive of upstream exploration investment.
The flagship mechanism is a 10% production tax credit for domestic critical minerals processing, valued at an estimated $7 billion over 11 years. This credit is designed to incentivise domestic processing — reducing Australia's historical pattern of exporting raw ore for overseas processing — and to attract private sector co-investment in the full value chain from exploration through to refining.
For exploration companies, the significance of this policy architecture is not direct financial support at the exploration stage. Rather, it improves the terminal economics of projects that could eventually feed domestic processing facilities, increasing the probability that exploration success translates into commercial production. This downstream confidence effect supports exploration capital commitment today.
It is important to note that these policies represent a broader federal framework for the sector. Individual projects do not automatically receive government backing or project-specific support by virtue of operating in the critical minerals space.
Australia's Position in the Global Exploration Landscape
Understanding Australian mineral exploration spending near $1b in isolation understates its significance. In a global context, Australia's exploration intensity — measured against explored landmass — is exceptional. Australian greenfield exploration set a record of $1.2 billion in 2021, underscoring how the current trajectory is building on established momentum.
| Country/Region | Annual Exploration Spend (Approx.) | Primary Commodity Focus |
|---|---|---|
| Australia | ~$950 million per quarter (Q3 FY26) | Gold, Critical Minerals, Copper |
| Canada | ~$2-3 billion (annual total) | Gold, Base Metals |
| United States | ~$1-1.5 billion (annual total) | Gold, Copper, Critical Minerals |
| Africa (aggregate) | ~$1.5-2 billion (annual total) | Gold, Copper, Diamonds |
Australia's quarterly figure approaching Canada's annual spend on a per-program basis reflects the concentration of activity in highly prospective, infrastructure-supported terrains. Canada's higher absolute annual figure reflects a larger geographic distribution of programs across a more diverse junior explorer ecosystem, rather than a fundamentally more prospective geological endowment.
Australia's proximity to Asian manufacturing and processing hubs adds a logistical dimension that compounds its geological advantages. For critical minerals especially, the delivered cost of material into key processing centres in Japan, South Korea, and increasingly Southeast Asia is structurally lower from Australian operations than from competing supply sources in more geographically distant jurisdictions.
The next major ASX story will hit our subscribers first
The ASX Capital Markets Connection: A Leading Indicator Framework
One of the less commonly understood dynamics in Australian exploration economics is the relationship between ASX junior explorer capital raising activity and subsequent ABS exploration expenditure data. This relationship operates with approximately a 6 to 12 month lag — equity capital raised today funds drilling programs that show up in expenditure data one to two reporting periods later.
ASX resources IPOs raised over A$1 billion in the first half of 2021 alone, establishing the capital formation cycle that directly preceded the June 2022 exploration expenditure record. Tracking ASX resources capital raising activity therefore provides analysts with a meaningful leading signal for where ABS exploration expenditure data is likely to trend in subsequent quarters. The boom in Australian mineral exploration funding has been well documented, reinforcing the importance of capital market dynamics in driving sector-wide activity.
For investors using exploration sector dynamics as part of a resource equity strategy, this framework suggests:
- Monitor ASX resources IPO and secondary raising volumes on a quarterly basis as a forward indicator
- Weight the data toward junior and micro-cap capital raises, which most directly feed exploration program spending
- Apply a 6 to 12 month offset when constructing forward expenditure projections from capital raising data
- Cross-reference against commodity price trends to assess whether raised capital is likely to be deployed or held back pending price recovery
Exploration Technology: The Per-Dollar Efficiency Revolution
A dimension of the current exploration cycle that deserves attention is the improving efficiency of exploration capital deployment. Advances in geophysical survey technology, AI-assisted targeting, and remote sensing are meaningfully improving discovery rates per dollar deployed — a development that effectively amplifies the impact of headline expenditure figures. Indeed, AI enhancing mineral exploration success is fast becoming a defining feature of the current cycle.
Modern airborne electromagnetic surveys can now characterise subsurface conductivity profiles at depth ranges and resolutions that were technically unavailable a decade ago. Machine learning applications are being applied to large geological datasets to identify subtle geochemical and structural patterns associated with mineralisation that human interpretation would miss. These tools are not uniformly distributed across the explorer population — larger, better-capitalised companies tend to have earlier access — but they are progressively diffusing into the junior explorer sector through service company accessibility.
The practical implication is that Australian mineral exploration spending near $1b in 2026 generates more geological knowledge and discovery opportunity than the same nominal figure would have produced in 2016. This efficiency improvement is a structural tailwind for the sector that does not appear in raw expenditure statistics.
What Sustained $1 Billion+ Quarterly Spending Would Require
Crossing and sustaining the $1 billion quarterly threshold requires a specific confluence of conditions. The sector is demonstrably close, but proximity does not guarantee arrival or persistence.
The conditions most likely to support a structural step-change include:
- Continued gold price support above levels that sustain greenfield exploration economics in WA and beyond
- At least partial recovery in lithium or nickel prices sufficient to reactivate deferred critical minerals programs
- Deepening institutional participation in ASX junior explorer capital raises, reducing the funding constraint on early-stage programs
- Further regulatory streamlining reducing approval timelines for exploration licences, particularly in WA and SA
- Continued advancement of AI and geophysical technologies improving exploration hit rates and justifying higher per-program spending
The risk scenarios capable of reversing momentum are equally concrete:
- A sharp gold price correction compressing exploration economics across the dominant commodity category
- Tightening global equity market conditions reducing capital availability for junior and mid-tier explorers
- Policy discontinuity at the federal level affecting critical minerals processing incentives
- Further commodity price declines in the battery metals sector, as flagged by the RBA's cautionary research framing
Disclosure: This article contains forward-looking statements and analysis based on publicly available data. Mineral exploration investment involves significant risk, including commodity price volatility, regulatory uncertainty, and the inherent technical risk of exploration programs not resulting in commercial discoveries. This content is informational only and does not constitute financial advice.
Frequently Asked Questions: Australian Mineral Exploration Spending
What is the current level of Australian mineral exploration spending?
ABS data for Q3 FY26 records national mineral exploration expenditure at $949.3 million, representing a 16.3% year-on-year increase and positioning the sector within striking distance of the $1 billion quarterly threshold.
Which state accounts for the largest share of exploration capital in Australia?
Western Australia absorbs approximately two-thirds of total national exploration expenditure, underpinned by its geological endowment across the Eastern Goldfields, Pilbara, Albany-Fraser Orogen, and Yilgarn Craton.
What commodity receives the largest share of Australian exploration funding?
Gold receives the largest single share at approximately 45% of total exploration expenditure, reflecting its commercial maturity, high-margin production potential, and the sustained strength of gold prices through the current cycle.
Has Australia previously exceeded $1 billion in quarterly exploration spending?
Yes. Australia recorded a record A$1.04 billion in mineral exploration expenditure during the June 2022 quarter, driven primarily by lithium and battery metals exploration intensity. The current $949.3 million reading suggests this threshold is plausibly within reach in the near term.
What are the main risks to continued exploration spending growth?
Key risks include commodity price corrections across gold or battery metals, tightening ASX equity market conditions, regulatory approval delays, and the production-stage uncertainty flagged in the RBA's critical minerals research. Exploration spending reflects capital commitment, not commercial production outcomes.
For ongoing data and industry perspectives on Australian mineral exploration trends, the Australian Bureau of Statistics Mineral and Petroleum Exploration series provides quarterly expenditure updates. Additional industry coverage and context is available at australianminingreview.com.au.
Want to Know When the Next Major ASX Mineral Discovery Hits the Market?
With Australian mineral exploration expenditure approaching $1 billion per quarter and capital flowing across gold, copper, and critical minerals, the probability of significant discoveries reaching the ASX is rising — and timing is everything. Discovery Alert's proprietary Discovery IQ model instantly translates complex ASX mineral announcements into actionable alerts, ensuring subscribers are positioned ahead of the broader market; explore historic discovery returns to understand what early discovery intelligence has delivered, or start your 14-day free trial today to gain a real-time edge in the current exploration cycle.