July 19, 2026
When Momentum Meets Gravity: Understanding the ASX Lithium Stocks Pullback
Resource sector cycles have a well-documented rhythm. Capital floods into high-momentum commodity stocks during price upswings, valuations stretch beyond what fundamentals alone can justify, and when the underlying commodity softens even modestly, equity prices often correct more sharply than the commodity itself. This amplification effect is not a malfunction of the market. It is precisely how high-beta resource stocks behave, and understanding this dynamic is essential for anyone navigating the current ASX lithium stocks pullback.
The lithium sector's recent trajectory follows this pattern almost textbook-perfectly. After an extraordinary 12-month surge in both commodity prices and equity valuations, a pullback in lithium carbonate prices has triggered a wave of selling across ASX-listed lithium producers. However, the more important question is not why the correction happened. It is what the underlying fundamentals tell us about what comes next.
When big ASX news breaks, our subscribers know first
The Price Cycle That Set Up the Correction
To understand the current ASX lithium stocks pullback, it is necessary to start with the commodity price cycle that preceded it. Lithium carbonate prices surged approximately 155% over the past 12 months, creating an enormous tailwind for ASX-listed producers. When commodity prices rise at that rate, equity markets tend to price in continued momentum, which can push share prices well ahead of fundamental earnings power.
The correction arrived when lithium carbonate prices declined roughly 14% over the most recent monthly period. For a commodity that had risen so sharply, a 14% retracement might seem modest. However, at the equity level, the impact is amplified because:
- Share prices had already factored in continued commodity strength.
- Profit-taking by investors who had captured triple-digit gains accelerated the selloff.
- Broader macroeconomic uncertainty, including concerns about interest rate trajectories and consecutive Wall Street declines, triggered sector-wide risk reduction.
- In a risk-off environment, capital tends to rotate away from high-beta names toward more defensive assets.
This combination of commodity-level softness and macro-driven risk aversion created a sharper equity-level correction than the commodity price move alone would suggest. For a deeper look at the broader lithium market downturn and its structural drivers, the context is equally instructive.
How the Three Major ASX Lithium Stocks Performed
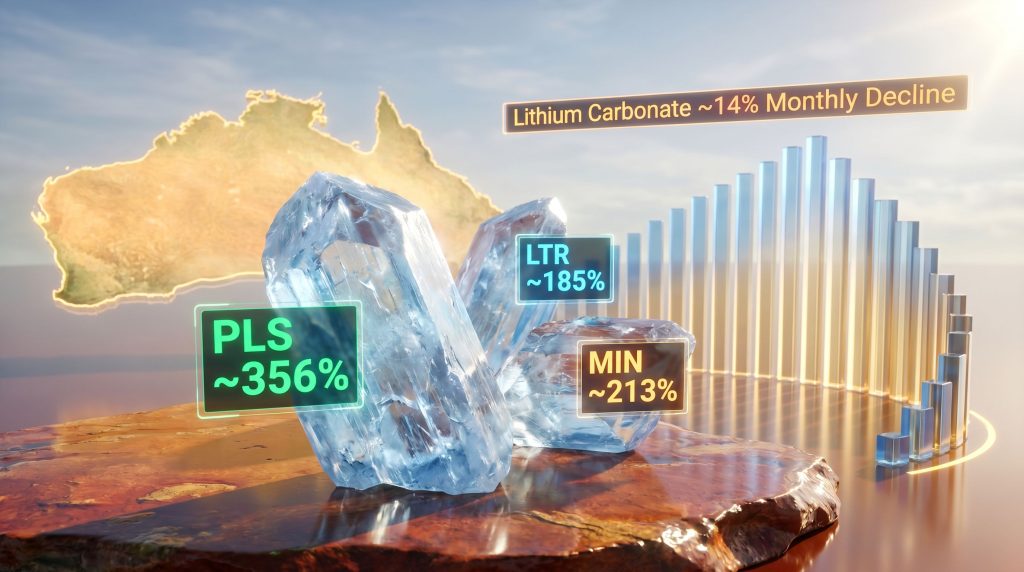
The scale of the preceding rally provides important context for assessing the current pullback. All three of the largest ASX lithium producers delivered extraordinary 12-month gains before the correction began.
| ASX Lithium Stock | 12-Month Gain | Recent Monthly Decline | Share Price |
|---|---|---|---|
| Pilbara Minerals (ASX: PLS) | ~356% | ~10% | ~$5.66 |
| Mineral Resources (ASX: MIN) | ~213% | ~7% | ~$65.86 |
| Liontown Resources (ASX: LTR) | ~185% | ~18% | ~$1.90 |
What the table illustrates is a critical concept in resource investing: the magnitude of a preceding rally directly influences the severity of a subsequent correction. Stocks that gained 300%+ in 12 months carry a much higher mathematical risk of sharp retracement than stocks trading near their historical average valuations.
Smaller-cap lithium names across the ASX averaged gains of roughly 85% between mid-March and April highs before the pullback took hold, demonstrating that the momentum phase extended well beyond the large-cap producers.
Separating Operational Reality From Commodity Noise
One of the most important analytical disciplines during a commodity-driven selloff is the ability to separate share price movements from underlying business performance. The current ASX lithium stocks pullback does not reflect a deterioration in operational fundamentals for the major producers. The financials tell a more nuanced story.
Pilbara Minerals (ASX: PLS): Operational Leverage at Scale
Pilbara Minerals delivered compelling half-year results that go beyond simple revenue growth. The company reported:
- Revenue growth of ~47% to $624 million, supported by higher realised prices and increased sales volumes.
- Underlying EBITDA expansion of ~241% to $253 million, a figure that reflects genuine operating leverage.
- EBITDA margin improvement from 17% to 41%, one of the more telling metrics in the result.
That margin expansion deserves particular attention. Moving from 17% to 41% EBITDA margins indicates that Pilbara is not merely riding a commodity wave. It is extracting meaningfully more value from each tonne of spodumene it produces, which speaks to cost discipline and the scale advantages of the Pilgangoora operation.
Pilgangoora is among the world's largest hard-rock lithium deposits, and scale matters enormously in mining economics. Larger operations can spread fixed costs across greater production volumes, achieving unit costs that smaller competitors cannot match. This structural cost advantage provides a buffer during price weakness that pure-play developers without producing assets simply do not have.
Liontown Resources (ASX: LTR): Growth Stage Dynamics and Ramp-Up Risk
Liontown's Kathleen Valley operation represents one of Australia's most significant emerging lithium assets, and the recent financial results demonstrate genuine progress. Furthermore, Liontown stock performance over recent periods reflects both the promise and the volatility inherent in ramp-up stage operations:
- Lithium production growth of ~70% to 192,514 dry metric tonnes.
- Revenue more than doubling, rising ~107% to $207.5 million.
However, Liontown sits at a different point in the operational lifecycle than Pilbara Minerals. Ramp-up stage operations carry a distinctive risk profile: production costs tend to be higher before full throughput is achieved, and any sustained commodity price weakness during the ramp-up phase can compress margins at precisely the moment when capital is being deployed.
The critical variable for Liontown investors is the intersection of the production ramp-up timeline with the commodity price cycle. If lithium prices stabilise or recover while Kathleen Valley continues to scale, the earnings growth trajectory could be substantial. If weakness persists through the ramp-up period, the dual pressure of lower prices and higher per-unit costs creates a more challenging financial environment. Notably, Kathleen Valley is also set to become Australia's first underground lithium mine, adding a further dimension to its operational significance.
Mineral Resources (ASX: MIN): Diversification as a Structural Hedge
Mineral Resources occupies a structurally different position in the lithium sector. Unlike pure-play producers, MIN operates across mining services, iron ore, and lithium, which creates a natural earnings buffer during commodity-specific downturns.
The company's most recent half-year result demonstrated this model's strength:
- Record EBITDA of $1.2 billion and revenue of $3.1 billion.
- The Onslow Iron project emerging as a major independent growth driver.
- Mining services revenue providing a counter-cyclical earnings stream relative to commodity price volatility.
Diversified operators like Mineral Resources present investors with a different risk-return tradeoff: lower peak sensitivity to lithium price surges, but considerably more earnings resilience when commodity prices soften. The trade-off is real, and choosing between concentrated and diversified lithium exposure is ultimately a function of an investor's view on the depth and duration of the current correction.
It is worth noting that MIN is not fully insulated from commodity risk. Simultaneous weakness in both lithium and iron ore markets would compress earnings from multiple directions, limiting the diversification benefit. This scenario, while not the base case, represents a tail risk that investors should factor into their assessment.
The Macro Framework: What Drives Lithium Price Volatility
Lithium is not a homogeneous commodity. There are important distinctions between lithium carbonate (primarily used in lithium iron phosphate batteries common in Chinese EVs) and lithium hydroxide (preferred for high-nickel cathode chemistries used in performance EVs). Understanding which form is most relevant to each ASX producer matters for projecting earnings sensitivity. In addition, the lithium carbonate supply-demand balance is a key variable shaping near-term price trajectories.
Australian hard-rock spodumene is processed into either form, but the downstream conversion pathway affects price realisation. Producers with offtake agreements tied to hydroxide pricing may have a different earnings profile than those exposed to carbonate spot markets, even when both are described simply as lithium miners.
Several macro forces interact to drive volatility across both forms:
- EV demand growth rates remain the primary long-term driver. Global electric vehicle sales have continued to expand, though the pace of growth in key markets has been uneven.
- Battery chemistry evolution influences which lithium compounds are most in demand. The ongoing shift in cathode chemistries creates different demand profiles for carbonate versus hydroxide.
- Chinese processing capacity plays an outsized role in spot price formation, given China's dominance in lithium chemical refining.
- Interest rate sensitivity disproportionately affects capital-intensive mining companies, as higher rates increase the cost of debt and compress the present value of future cash flows in discounted valuation models.
- Supply response dynamics from brine operations in South America, which have different cost structures and production timelines than Australian hard-rock miners.
One lesser-known dynamic is the lag between spodumene concentrate pricing and downstream lithium chemical prices. The spodumene pricing relationship with refined chemicals is not fixed — when downstream processing margins are compressed, Chinese converters may reduce their willingness to pay for spodumene even before spot carbonate prices move significantly, creating an additional layer of price risk that does not always appear in headline lithium price data.
A Framework for Evaluating the ASX Lithium Stocks Pullback
Not all corrections are equal. The key analytical task is distinguishing between a healthy consolidation following an overextended rally and the early stages of a more structural price decline. Several metrics are particularly useful during this evaluation process.
| Metric | Why It Matters During a Pullback |
|---|---|
| Lithium carbonate and hydroxide spot prices | Direct earnings driver for all ASX lithium producers |
| Spodumene concentrate benchmark pricing | More directly relevant than downstream chemical prices for Australian miners |
| EBITDA margin trajectory | Indicates operational resilience at current commodity prices |
| Production ramp-up progress | Confirms whether the growth thesis remains intact |
| All-in sustaining cost (AISC) per tonne | Determines the price floor below which producers face margin compression |
| Balance sheet strength and debt levels | Determines capacity to withstand an extended downturn |
| Broker consensus ratings | Reflects near-term institutional sentiment shifts |
Avoiding the Behavioural Trap
Market psychology during corrections is well-studied. Retail investors frequently make their worst decisions during periods of acute price weakness, crystallising losses by selling positions that subsequently recover. The mechanism is well-understood: falling prices trigger loss aversion, which in turn produces an emotional urge to stop further losses by exiting the position entirely.
The statistical case for holding quality resource producers through commodity price corrections is reasonably strong. Producers with low-cost, large-scale operations have historically recovered alongside commodity prices, and investors who sold during corrections often missed the subsequent rebound. This is not an argument for holding any lithium stock indiscriminately. It is an argument for differentiating between companies based on cost structure and balance sheet strength before making exit decisions under duress.
Pullback periods also represent a rational moment to reassess position sizing rather than exiting entirely. Furthermore, if a stock that gained 300% in 12 months now represents an outsized proportion of a portfolio, trimming to a more comfortable weighting during a correction is a disciplined response. Panic-selling an entire position is a different and typically less rational behaviour. For broader context on how these dynamics affect valuations, understanding the pullback for lithium stocks provides additional analytical perspective worth reviewing.
The next major ASX story will hit our subscribers first
Recovery Scenarios: What Could Shift the Trajectory
The path forward for ASX lithium stocks is genuinely uncertain, but several distinct scenarios are worth mapping:
Scenario 1: Lithium Price Stabilisation
Even without a new price rally, a stabilisation at current levels would allow markets to recalibrate earnings expectations. Many of the operational improvements at PLS and LTR remain intact regardless of short-term price movements, and stabilised commodity pricing would allow that operational progress to be reflected in valuations more accurately.
Scenario 2: EV Demand Acceleration
Stronger-than-expected global electric vehicle sales data, particularly from markets outside China where growth has been less consistent, could reignite the demand narrative. Battery storage deployments for grid-scale applications represent an additional demand vector that is often underweighted in short-term lithium price analysis.
Scenario 3: Supply Disruption
Production shortfalls at major brine operations in Chile or Argentina, or unexpected operational issues at large hard-rock producers, could rapidly tighten the supply-demand balance. Australian hard-rock lithium is structurally positioned to benefit from any supply gap given its relatively predictable production profiles compared to brine operations.
Scenario 4: Prolonged Weakness
A sustained commodity price decline would pressure earnings guidance, potentially delay capital expenditure programmes, and disproportionately affect higher-cost or development-stage operators. Under this scenario, balance sheet strength becomes the most critical differentiating factor between operators that weather the cycle and those that face more serious challenges. Analysts tracking fresh opportunities in lithium stocks suggest that even prolonged weakness periods can create compelling entry points for patient, well-informed investors.
Frequently Asked Questions: ASX Lithium Stocks Pullback
Why are ASX lithium stocks falling right now?
The current ASX lithium stocks pullback reflects a combination of a roughly 14% monthly decline in lithium carbonate prices, broader equity market weakness driven by macroeconomic concerns, and profit-taking after extraordinary 12-month gains ranging from 185% to 356% across the major producers.
Does the pullback represent a buying opportunity?
This depends on an investor's time horizon, risk tolerance, and conviction in the long-term demand story. Investors should assess individual company fundamentals, including production growth, EBITDA margins, cost structures, and balance sheet strength, rather than making decisions based on short-term price movements alone. This article contains general information only and does not constitute personal financial advice.
Which structural model performs better during a correction: pure-play or diversified?
Diversified operators offer greater earnings stability during commodity-specific weakness, while pure-play producers carry higher upside leverage to price recovery but amplified downside risk. The appropriate choice depends on an investor's view of the correction's depth and duration.
How long do lithium sector corrections typically last?
Historical lithium market corrections have ranged from weeks to multi-quarter periods. Duration depends on whether the price decline reflects temporary sentiment shifts or a more fundamental supply-demand imbalance.
What is the long-term outlook for ASX lithium stocks?
The structural demand case remains intact over a multi-year horizon, underpinned by global EV adoption trajectories and battery storage deployment. Near-term volatility is expected to persist, but producers with low-cost, large-scale operations are positioned to benefit as energy transition trends continue to develop.
Key Takeaways for Investors
- The ASX lithium stocks pullback follows an exceptional 12-month rally in which major producers gained between 185% and 356%.
- Lithium carbonate prices declined approximately 14% in the most recent monthly period after surging roughly 155% over the prior year, amplifying equity-level selling pressure.
- Company fundamentals, including revenue growth, EBITDA expansion, and production ramp-up progress, remain broadly constructive despite the price correction.
- The spodumene-to-chemical price transmission mechanism creates an additional layer of price risk for Australian hard-rock producers that is not always visible in headline lithium price data.
- Diversified operators offer greater earnings resilience during commodity weakness; pure-play producers carry higher upside leverage but amplified downside risk during corrections.
- Investors should focus on all-in sustaining costs, balance sheet strength, and production ramp-up progress when evaluating positions during sector corrections rather than reacting to short-term price movements.
- The long-term structural demand thesis remains supported by EV adoption trends and the expanding role of lithium-ion battery storage in grid applications.
This article contains general information only and does not constitute personalised financial advice. Investments in resource stocks carry significant risks, including commodity price volatility and operational uncertainty. Past performance is not indicative of future returns. Readers should seek independent financial advice before making investment decisions.
Ready to Identify the Next Major ASX Mineral Discovery Before the Broader Market?
Discovery Alert's proprietary Discovery IQ model delivers real-time alerts on significant ASX mineral discoveries, cutting through commodity complexity to surface actionable opportunities the moment they are announced — ideal for investors seeking to position ahead of the next major resource cycle. Explore how historic mineral discoveries have generated extraordinary returns on Discovery Alert's dedicated discoveries page, and begin your 14-day free trial today to gain a genuine market-leading edge.