June 26, 2026
The Commodity Cycle That Keeps Catching Investors Off Guard
Commodity markets have a rhythm that most investors only recognise in hindsight. The pattern is deceptively consistent: prices collapse under the weight of oversupply, capital retreats, producers curtail output, and then demand quietly builds until the market flips back into deficit. By the time the recovery becomes obvious, much of the return has already been captured by those who positioned early.
The lithium market between 2022 and 2025 followed this script with painful precision. Lithium carbonate prices fell from historic highs above US$80,000 per tonne in late 2022 to levels that rendered many projects economically marginal. Producers shelved expansion plans, explorers struggled to raise capital, and investor sentiment turned deeply negative. Yet underneath the surface, the structural demand equation continued to build.
That context is essential for understanding why ASX lithium stocks returns over the past 12 months have been so extraordinary, and why interpreting them correctly requires more than simply tracking price charts.
When big ASX news breaks, our subscribers know first
How Much Have ASX Lithium Stocks Actually Returned Over the Past 12 Months?
Benchmarking the Recovery Against Broader Market Performance
The broader ASX 200 delivered solid but comparatively modest returns over the same period that lithium equities were generating triple-digit gains. This divergence illustrates a fundamental characteristic of resource sector equities: they do not simply track commodity prices. They amplify them, both on the way up and on the way down.
This amplification effect, known in financial analysis as operating leverage, works through a straightforward mechanism. A mining producer has largely fixed costs in the short term, including labour, energy, maintenance, and infrastructure. When commodity prices rise, revenue increases while costs remain relatively stable, causing earnings to expand at a far greater rate than the underlying price movement. The reverse is equally true, however, during downturns.
What a $5,000 Investment Would Look Like Across the Sector
The returns generated by Australia's two most prominent lithium producers over the past year provide a striking illustration of this dynamic.
| ASX Stock | 12-Month Approximate Return | $5,000 Invested — Approximate Current Value |
|---|---|---|
| Mineral Resources (MIN) | ~213% | ~$15,650 |
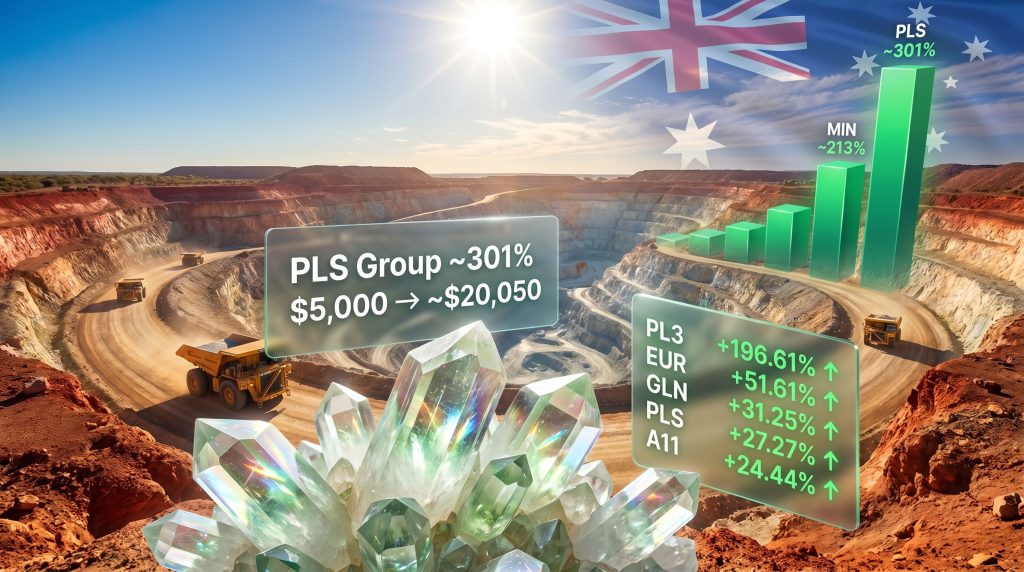
| PLS Group (PLS) | ~301% | ~$20,050 |
A $5,000 allocation to PLS Group approximately 12 months ago would be worth roughly $20,050 today, representing a near-quadrupling of capital. This outcome was driven by a combination of rising lithium carbonate prices, which climbed approximately 155% over the prior 12-month period, and strong operational delivery from the company's flagship Pilgangoora mine.
Important context: Lithium carbonate prices have since softened by around 14% over the most recent month, and both MIN and PLS shares have pulled back from their peaks. This serves as a timely reminder that resource equities can reverse sharply, and that 12-month trailing returns rarely predict near-term performance.
Which ASX Lithium Stocks Have Delivered the Strongest Year-to-Date Gains in 2026?
Top 5 ASX Lithium Performers: Year-to-Date 2026 Rankings
Zooming in on 2026 year-to-date performance reveals that the recovery has extended well beyond the large-cap producers. Smaller explorers and developers have captured significant speculative interest, with some generating returns that dwarf even the impressive gains seen in the major producers. For a broader view of the sector, ASX lithium stock lists provide a useful reference point when assessing the full range of available opportunities.
| Rank | ASX Code | Company | YTD Gain | Market Capitalisation |
|---|---|---|---|---|
| 1 | PL3 | Patagonia Lithium | +196.61% | AU$36.24M |
| 2 | EUR | European Lithium | +51.61% | AU$411.89M |
| 3 | GLN | Galan Lithium | +31.25% | AU$520.48M |
| 4 | PLS | Pilbara Minerals (PLS Group) | +27.27% | AU$715.21M |
| 5 | A11 | Atlantic Lithium | +24.44% | AU$223.99M |
The dominant year-to-date performer, Patagonia Lithium (PL3), has delivered gains of nearly 197% from a market capitalisation base of just AU$36.24 million. This illustrates a well-understood but frequently underestimated dynamic in small-cap resources investing: the smaller the company, the less capital is required to drive substantial percentage-based price movements.
A single positive drilling result, a resource upgrade, or even a change in investor sentiment toward lithium exploration-stage assets can trigger re-rating events that produce extraordinary short-term returns. However, the liquidity conditions at this end of the market are materially different, and the risks of capital loss are correspondingly elevated.
Liontown stock performance also warrants attention as a notable performer outside the top five, with approximately 75% year-to-date gains anchored by operational progress at its Kathleen Valley hard-rock lithium mine in Western Australia.
Risk Callout: Micro-cap lithium stocks can deliver extraordinary percentage returns but carry significantly elevated risks, including thin liquidity, execution uncertainty at the project level, and acute sensitivity to commodity price movements. The market capitalisation context behind headline return figures is critical and should never be overlooked.
What Is Driving the Divergence Between Large-Cap and Small-Cap ASX Lithium Returns?
Operational Fundamentals Versus Speculative Re-Rating
The mechanisms behind returns at different ends of the lithium market capitalisation spectrum are fundamentally different, and conflating them is a common investor mistake.
Large-cap producers like PLS Group generate returns through measurable improvements in revenue, margins, and production volumes. In its most recent half-year result, PLS Group reported:
- Revenue of $624 million, representing a 47% increase on the prior corresponding period
- Underlying EBITDA of $253 million, up an exceptional 241% period-on-period
- EBITDA margins expanding from 17% to 41%, reflecting the operating leverage effect in practice
- Growth in both realised lithium prices and physical sales volumes, demonstrating that revenue gains were not solely price-driven
These are tangible, auditable financial improvements grounded in operational performance. The re-rating of PLS Group shares reflects markets pricing in expectations of continued earnings strength.
Smaller explorers operate on a completely different logic. Their returns are primarily driven by news flow, sentiment shifts, and the market's willingness to assign value to unproven resource optionality. A company like Patagonia Lithium has no revenue, no production, and no near-term path to cashflow. Its share price movements reflect speculation about future potential, not present-day financial performance.
The Mechanics of Operating Leverage in Lithium Production
Understanding operating leverage is arguably the single most important analytical concept for resource sector equity investors. The table below illustrates how a change in lithium prices flows through to producer earnings in a disproportionate way:
| Scenario | Lithium Price Change | Approximate EBITDA Impact (Illustrative) |
|---|---|---|
| Moderate upswing | +20% | +40% to +60% EBITDA improvement |
| Moderate correction | -20% | -35% to -55% EBITDA deterioration |
| Severe downturn | -40% | Potential loss of EBITDA profitability |
Note: These are illustrative figures based on generalised operating cost structures and should not be treated as company-specific forecasts.
This asymmetry explains why lithium equities can generate returns that look extraordinary relative to underlying commodity price movements, but also why they can sustain losses that seem disproportionate during downturns. Furthermore, this same dynamic is central to understanding the lithium market downturn that preceded the current recovery cycle.
Is Mineral Resources (MIN) Still a Lithium Play, or Something More?
Dissecting the Multi-Commodity Business Model
Mineral Resources defies simple categorisation as an ASX lithium stock. Its business is structured across three primary pillars: lithium operations, a substantial mining services division, and an expanding iron ore business. This architecture creates a fundamentally different investment proposition compared to pure-play lithium producers.
The company's most recent half-year result demonstrated the value of this structure, recording:
- Record half-year revenue of $3.1 billion
- EBITDA of $1.2 billion for the period
- A significant contribution from the Onslow Iron project, which has emerged as a major standalone earnings driver
The Onslow Iron project's growing contribution is meaningful beyond its direct earnings impact. It reduces Mineral Resources' sensitivity to lithium price fluctuations, providing a partial natural buffer during periods of lithium market weakness. In a commodity-specific downturn, diversified producers typically experience smaller percentage drawdowns in earnings than single-commodity peers.
The trade-off is equally important to understand. During a strong lithium bull market, Mineral Resources may capture less upside than a pure-play producer because iron ore and mining services revenues dilute the commodity-specific leverage effect.
Mineral Resources vs. PLS Group: A Framework for Risk-Profile Matching
| Feature | Mineral Resources (MIN) | PLS Group (PLS) |
|---|---|---|
| Commodity exposure | Lithium + Iron Ore + Services | Primarily lithium |
| EBITDA sensitivity to lithium | Partial | High |
| Revenue diversification | Yes | Limited |
| Upside capture in lithium bull markets | Moderate | High |
| Downside protection in lithium bear markets | Better | More vulnerable |
| Suitable for | Investors seeking managed commodity risk | Investors seeking concentrated lithium exposure |
How Does Pilbara Minerals' Pilgangoora Operation Compare Globally?
Scale, Cost Position, and Strategic Significance
The Pilgangoora operation in Western Australia is one of the world's largest hard-rock lithium mining complexes, and scale in this industry matters enormously. Larger operations spread fixed costs across higher production volumes, resulting in lower unit costs per tonne of spodumene concentrate produced. This cost advantage becomes a survival mechanism during price downturns, when marginal producers face severe pressure on their economics.
Hard-rock spodumene lithium extraction, which is the dominant lithium extraction method in Australia, differs structurally from the brine-based operations concentrated in South America's lithium triangle. Key distinctions include:
- Capital intensity: Hard-rock mines require significant upfront infrastructure investment but can be ramped up and curtailed relatively quickly compared to brine evaporation operations
- Production flexibility: Spodumene operations can adjust output volumes with greater speed than lithium brines, which rely on solar evaporation cycles that can span 12 to 24 months
- Grade consistency: Hard-rock deposits typically offer more predictable lithium grades, allowing for more reliable production planning and cost estimation
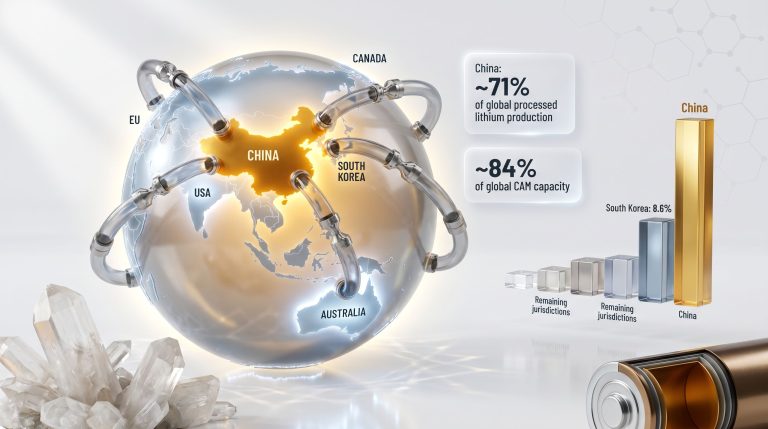
- End-product: Australian spodumene is typically converted to lithium hydroxide or lithium carbonate at processing facilities, primarily located in China
The concentration of Australian lithium processing in China represents a supply chain consideration that is increasingly noted by industry analysts, as any disruption to conversion capacity or trade relationships could affect realised prices for spodumene exporters.
The next major ASX story will hit our subscribers first
What Are the Key Risk Factors Every Investor Should Understand Before Buying ASX Lithium Stocks?
Commodity Price Sensitivity: The Central Risk Variable
Lithium equities remain among the most commodity-price-sensitive instruments available to retail investors on the ASX. The operating leverage dynamics described earlier work with equal force in both directions. A 10% to 15% decline in lithium prices can translate into a 30% to 50% or greater reduction in producer-level EBITDA, and equity markets typically reprice shares to reflect this earnings deterioration rapidly and without warning.
The recent 14% softening in lithium carbonate prices over a single month demonstrates how quickly this dynamic can emerge. Investors who entered positions near the peak of the recovery cycle may already be experiencing meaningful paper losses, despite the underlying business remaining fundamentally sound.
The Lithium Company Lifecycle: A Three-Stage Risk Framework
Understanding where a company sits in its development journey is essential for accurate risk assessment. The three stages carry vastly different risk and return profiles:
-
Exploration stage: No defined resource, no revenue, no production. Returns are driven entirely by geological discovery and speculative sentiment. Capital loss risk is highest at this stage.
-
Development stage: Resource defined, feasibility studies underway or completed, project financing being arranged. Risks include permitting delays, capital cost overruns, construction challenges, and commodity price deterioration during the development period.
-
Production stage: Revenue generating, but exposed to operational risks including equipment reliability, labour availability, processing recovery rates, and ongoing commodity price sensitivity.
Liquidity and Market Capitalisation Considerations
Micro-cap lithium stocks with market capitalisations below AU$100 million present a specific category of risk that is frequently underestimated by retail investors. At this scale:
- Bid-ask spreads can be wide, meaning the price at which shares can be sold may be materially lower than the last traded price
- A single institutional seller can move the price significantly against a retail investor attempting to exit
- Trading volumes may be insufficient to liquidate a meaningful position without impacting the market price
- Company-specific news, including negative drilling results or funding difficulties, can trigger rapid and severe price declines with limited opportunity to exit
ASX Lithium Stocks: Short-Term Momentum vs. Long-Term Structural Demand
The Bull Case: Why Structural Demand Supports a Multi-Year Thesis
The demand argument for lithium extends considerably beyond the electric vehicle narrative that dominated earlier in the decade. Three structural demand vectors are now converging:
- Electric vehicle fleet expansion: Global EV adoption continues to accelerate across passenger vehicles, commercial transport, and two-wheelers, with cumulative lithium demand requirements compounding over time
- Grid-scale battery storage: Utility-scale battery installations are growing rapidly as renewable energy penetration increases, requiring firm dispatchable storage to manage intermittency. This demand source is largely independent of EV adoption rates
- AI data centre power infrastructure: The exponential growth in artificial intelligence computing capacity is driving unprecedented electricity consumption at data centres, creating demand for battery-based grid balancing solutions that operate independently of transportation electrification trends
On the supply side, the 2022 to 2024 price collapse triggered widespread production curtailments, project deferrals, and a sharp reduction in exploration spending. New lithium supply projects face lead times of five to ten years from discovery to commercial production, meaning the supply response to any renewed price strength is inherently slow.
The Bear Case: What Could Derail the Recovery
Balancing the structural bull case requires honest engagement with the risks:
- Lithium recycling: As the first generation of electric vehicle battery packs approaches end-of-life, recycled lithium volumes will increase. The lithium battery recycling outlook suggests that over the medium term, recycled supply could displace a meaningful share of primary mining demand, particularly in markets with strong battery collection infrastructure
- Sodium-ion battery technology: Sodium-ion chemistry is advancing as a lower-cost alternative to lithium-ion for certain applications, particularly stationary storage and shorter-range vehicles where energy density requirements are less demanding. If sodium-ion adoption accelerates, it could moderate lithium demand growth below consensus forecasts
- Macroeconomic headwinds: Chinese economic growth trajectories remain a critical variable, given that China accounts for the dominant share of global lithium processing and EV manufacturing. Interest rate environments and consumer spending capacity in major markets also influence EV demand timing
Frequently Asked Questions: ASX Lithium Stock Returns
What has been the best-performing ASX lithium stock over the past 12 months?
Among the established producers, PLS Group (ASX: PLS) delivered approximately 301% returns over the prior 12-month period, with a $5,000 investment growing to approximately $20,050. Among smaller explorers and developers, performance varied widely, with several micro-cap names generating even higher percentage returns from much lower market capitalisation bases, though with correspondingly elevated risk profiles.
Are ASX lithium stocks a good investment in 2026?
The answer depends entirely on investment horizon, risk tolerance, and portfolio context. The structural demand thesis for lithium remains compelling over a multi-year timeframe, supported by grid storage growth, EV adoption, and supply constraints. However, near-term commodity price volatility is real, and the recent 14% pullback in lithium carbonate prices demonstrates that the recovery cycle is not linear. Investors should distinguish between speculative positioning in explorers and longer-term structural exposure through established producers.
What is the difference between a lithium producer and a lithium explorer on the ASX?
The ASX lithium sector spans a broad spectrum of company maturity:
- Explorer: Conducting geological surveys and drilling programs to identify lithium mineralisation. No defined resource, no revenue, highest risk.
- Developer: Has defined a lithium resource, is advancing feasibility studies, environmental approvals, and project financing. Risk is lower than explorers but still elevated.
- Producer: Actively mining and selling lithium products, generating revenue and, in favourable price environments, profits. Risk profile is driven primarily by commodity prices and operational execution.
Why do small ASX lithium stocks sometimes outperform larger producers in percentage terms?
The mathematical base effect is fundamental here. A company with a AU$30 million market capitalisation requires far less capital inflow to produce a 100% price gain than a company valued at AU$700 million. Additionally, small explorers are re-rated on news flow and optionality, meaning a single positive drilling result or resource upgrade can trigger disproportionate buying interest from investors positioning for future development value, even when no revenue or earnings exist to support traditional valuation frameworks.
How does lithium carbonate price movement affect ASX lithium stocks returns?
Through operating leverage, commodity price changes produce amplified effects on producer earnings. The following table illustrates the approximate relationship:
| Lithium Price Change | Approximate EBITDA Margin Impact | Approximate Equity Re-Rating Effect |
|---|---|---|
| +20% | +15 to +25 percentage points | Potentially +40% to +80% share price gain |
| -20% | -15 to -25 percentage points | Potentially -30% to -60% share price decline |
| -40% | Severe compression | Potential loss of EBITDA profitability |
These figures are illustrative approximations based on generalised cost structures. Actual impacts vary significantly by company.
Summary: What the 2026 ASX Lithium Recovery Tells Us About Commodity Cycle Investing
Key Takeaways for Investors
The performance of ASX lithium stocks returns over the past 12 months offers a masterclass in commodity cycle dynamics. Several structural observations stand out:
- The 2026 lithium recovery is not purely a price story. It reflects genuine supply discipline following years of curtailments, combined with broadening end-use demand that extends beyond electric vehicles into grid storage and data infrastructure
- Diversified producers like Mineral Resources offer a different risk-return architecture than pure-play operators like PLS Group. Neither is superior in absolute terms; the appropriate choice depends on an investor's commodity price conviction and risk appetite
- Both large-cap producers and micro-cap explorers are participating in the 2026 recovery, but with fundamentally different risk characteristics that should never be conflated when making investment decisions
- Recent price softening serves as a live demonstration that commodity cycle recoveries are rarely smooth, and that position sizing relative to individual risk tolerance is a non-negotiable discipline in this sector
- The long lead times required to bring new lithium supply online, typically five to ten years from discovery to production, mean that supply responses to price recovery are structurally slow, which supports the medium-term bull case
Final Disclaimer: Past returns in the lithium sector, however impressive, are not a reliable guide to future performance. Commodity cycles are inherently unpredictable, and the operating leverage that amplifies gains during upswings accelerates losses during downturns. This article contains general information only and does not constitute financial advice. Investors should consider their own circumstances and seek independent financial advice before making investment decisions.
For ongoing analysis of ASX resource sector performance and lithium market dynamics, recent ASX lithium surges at Motley Fool Australia cover developments across Australian mining and energy transition stocks. In addition, top ASX lithium shares tracked by IG Markets provides further context for investors monitoring the sector closely.
Want to Catch the Next Major ASX Mineral Discovery Before the Market Does?
Discovery Alert's proprietary Discovery IQ model scans ASX announcements in real time, instantly identifying significant mineral discoveries across lithium and more than 30 other commodities — turning complex geological data into clear, actionable investment opportunities for both short-term traders and long-term investors. Explore historic discoveries and their extraordinary returns, then begin your 14-day free trial to position yourself ahead of the next major market-moving find.