
August 14, 2026
When the Market Opens Lower: Reading the Forces Behind ASX Weakness
Global equity markets rarely move in straight lines, and the relationship between overnight sessions in New York and the morning open in Sydney is far more complicated than most retail investors appreciate. When the ASX market open lower signal flashes across trading terminals, the instinct is to look immediately at Wall Street. However, the mechanics of how international sentiment translates into domestic pricing are layered, time-sensitive, and frequently misunderstood. Understanding what actually drives a negative open requires looking well beyond a single index close.
When big ASX news breaks, our subscribers know first
What a Lower Open Actually Signals for Australian Investors
A negative open on the S&P/ASX 200 does not inherently mean a negative session. It means that the aggregate of overnight information, including commodity moves, currency shifts, futures pricing, and offshore equity performance, has caused more sell orders than buy orders to stack up during the pre-open window.
The ASX operates across three distinct phases each trading day:
| Session Phase | Time (AEST) | Key Activity |
|---|---|---|
| Pre-Open | 7:00am – 10:00am | Orders queued, price discovery begins |
| Normal Trading | 10:00am – 4:00pm | Live market execution across all sectors |
| After-Hours | 4:00pm – 7:00pm | Closing single price auction, settlement prep |
One detail that many newer investors overlook is the staggered open mechanism. Individual ASX-listed stocks do not all begin trading at precisely 10:00am. They open in randomised batches across a window extending to approximately 10:10am. This design exists specifically to prevent algorithmic order clustering at a single price point, reducing volatility at the open and improving the integrity of price discovery. For a full breakdown of ASX trading hours, the exchange publishes official session times and calendar details on its website.
It is a structural feature that differentiates the ASX from several other major exchanges where the open is simultaneous across all listings.
Prior Session Performance and What the Numbers Reveal
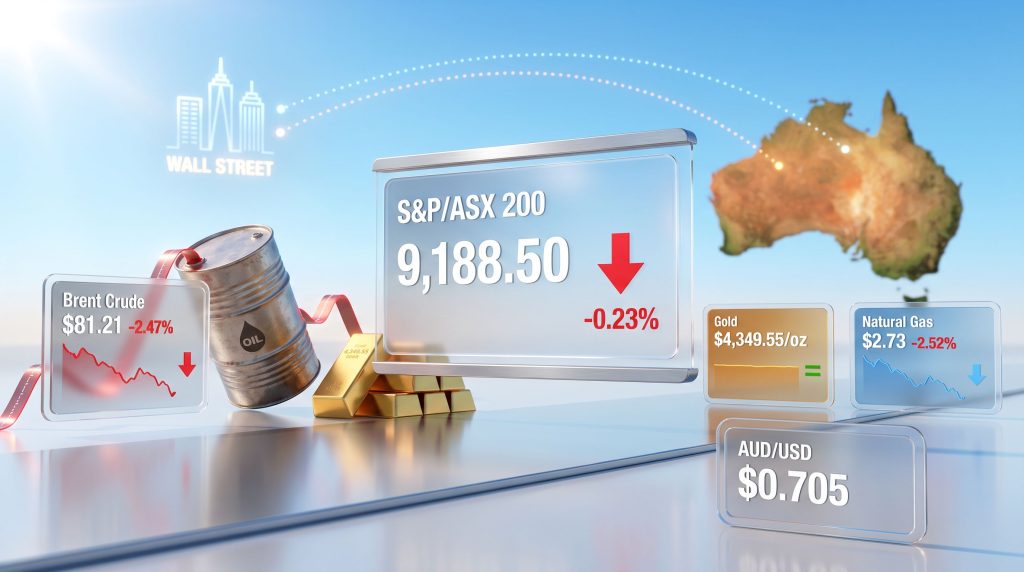
The S&P/ASX 200 closed at 9,188.50 on Thursday, 14 August 2026, a retreat of 20.90 points or 0.23%. That headline number, however, understates the degree of softness visible across broader benchmarks.
| Index | Close | Change | % Move |
|---|---|---|---|
| S&P/ASX 200 | 9,188.50 | –20.90 | –0.23% |
| All Ordinaries | 9,381.40 | –23.30 | –0.25% |
| S&P/ASX 100 | 7,713.80 | –14.50 | –0.19% |
| S&P/ASX Small Ords | 3,541.40 | –20.10 | –0.56% |
The Small Ordinaries underperforming the large-cap benchmark by more than double is a pattern worth examining. Smaller companies carry higher liquidity risk and tend to be more domestically exposed, meaning they are disproportionately sensitive to shifts in local sentiment rather than benefiting from the diversified earnings bases that buffer large-cap multinationals.
Furthermore, when small-caps sell off harder than the ASX 200, it frequently indicates that risk appetite is deteriorating at the margin of the market rather than at its centre. The ASX under commodity pressure analysis provides deeper context on how these structural vulnerabilities interact with raw material price cycles.
Why a Positive Wall Street Session Didn't Lift the ASX
Overnight, US equity markets delivered a broadly constructive session. The S&P 500 gained approximately 0.6%, the Nasdaq Composite rose 0.8%, and the Dow Jones Industrial Average added 0.1%, supported by further positive inflation data and strong corporate earnings results. Yet the ASX was still tipped to open lower. This apparent contradiction is one of the most misunderstood dynamics in Australian retail investing.
Several factors explain why a Wall Street rally can coexist with an ASX market open lower scenario:
- Sector composition divergence: The S&P 500 is heavily weighted toward technology and consumer discretionary sectors. The ASX 200 derives a significantly larger proportion of its weight from materials, energy, and financials. A tech-led US rally therefore carries limited direct translation benefit to Australian index weightings.
- Commodity price decoupling: Even when equities rise in the US, simultaneous falls in commodity prices can negate the sentiment boost for Australian resource stocks, which represent a substantial share of the local index.
- Currency friction: A strengthening US dollar on the back of positive American economic data can suppress the AUD/USD rate in ways that create mixed signals for export-oriented companies.
- Time-zone information gaps: Events occurring in Asian or European sessions after the US close but before the ASX open can materially shift the landscape in the intervening hours.
Commodity Prices: The Real Pulse of the ASX Morning Open
For a resource-heavy index like the ASX 200, commodity price movements are arguably a more reliable leading indicator than Wall Street equity performance. The current commodity landscape presents a mixed picture heading into the open.
| Commodity | Price | Movement |
|---|---|---|
| Iron Ore | $95.05/t | –0.04% |
| Brent Crude | $81.21/bbl | –2.47% |
| Gold | $4,349.55/oz | Stable |
| US Natural Gas | $2.73/MMBtu | –2.52% |
| AUD/USD | $0.705 | Monitored |
Iron ore holding near $95.05 per tonne with a negligible decline provides a degree of stability for the major diversified miners. However, at this price level, iron ore remains well below the highs that defined the super-cycle of earlier years, meaning the earnings buffer for large miners is thinner than it once was. Shifting iron ore demand trends out of China remain a critical variable for how this commodity behaves through the remainder of the year.
The 2.47% decline in Brent crude to $81.21 per barrel is a more meaningful headwind. ASX-listed energy producers are directly exposed to benchmark crude pricing, and a move of this magnitude in a single session is sufficient to reprice sentiment across the sector. In addition, part of the crude weakness stems from limited progress in diplomatic talks aimed at reopening the Strait of Hormuz, combined with signals of rising oil flows that eased supply anxiety. Broader crude oil price trends suggest that downward pressure on energy benchmarks may persist across multiple sessions.
Natural gas futures falling 2.52% to $2.73 per MMBtu compounds the energy sector pressure. Gas-focused producers and downstream processors listed on the ASX face margin compression when futures prices move sharply in a single direction over a short window.
Gold holding at $4,349.55 per ounce tells a nuanced story. Sustained gold safe-haven demand at elevated prices reflects ongoing geopolitical anxiety, but for ASX-listed gold producers, the effect is a double-edged one. Higher gold prices improve revenue projections but also attract valuation scrutiny when the price appears to be driven by fear rather than fundamental demand growth.
Geopolitical Risk Layers Adding Complexity to the Open
Two geopolitical threads are adding uncertainty to the morning's risk calculus.
How Are Tariffs Affecting the ASX Open?
The first involves Australian trade policy. Australian Prime Minister Anthony Albanese has confirmed he engaged directly with US President Donald Trump regarding the potential removal of a 12.5% tariff on Australian exports to the United States. Any movement on this tariff, in either direction, carries meaningful implications for ASX-listed companies with significant US revenue exposure.
Consequently, a tariff reduction would be a positive catalyst for export-linked stocks, while an escalation or stalled negotiation injects ongoing uncertainty into earnings forecasts for affected sectors. The broader global tariff impact of the current US trade posture continues to create ripple effects across commodity-exporting economies like Australia.
What Role Does Russian Sanctions Risk Play?
The second thread involves Russia's response to European Union sanctions. According to S&P Global reporting, Russia has signalled the potential seizure of EU-linked ships in retaliation for sanctions enforcement targeting Russian oil trades. President Putin characterised the EU's legal framework enabling member states to confiscate Russian oil from sanctioned vessels as an act of international piracy.
Whether or not this escalates into physical confrontation at sea, the market's perception of oil supply chain risk alone is sufficient to introduce volatility into energy pricing globally, and by extension, into ASX energy sector stocks.
Geopolitical disruptions to global oil supply chains historically generate short-term volatility in ASX energy and materials sectors, even when Australian producers have no direct exposure to the conflict geography involved.
The next major ASX story will hit our subscribers first
Corporate Earnings as a Counterweight: QBE Insurance in Focus
Not every signal pointing into the ASX's open on 14 August 2026 was negative. QBE Insurance Group delivered a half-year earnings result that exceeded market expectations by a meaningful margin, demonstrating how individual stock performance can diverge sharply from index-level weakness.
| Metric | Current Period | Prior Period | Change |
|---|---|---|---|
| Adjusted NPAT | $1,033m | $997m | +3.6% |
| Insurance Operating Result | $691m | ~$639m | +8.0% |
| Return on Equity | 17.7% | N/A | Above 15% target |
| Combined Operating Ratio | 92.8% | 92.8% | Stable |
A return on equity of 17.7% comfortably exceeding QBE's stated medium-term target of 15%+ reflects disciplined underwriting in an environment where natural catastrophe frequency and claims inflation have challenged insurers globally. The combined operating ratio holding steady at 92.8% is particularly significant.
In insurance, a combined ratio below 100% indicates that the company is earning underwriting profit before investment income is considered, and stability in this metric across two consecutive half-year periods signals operational consistency rather than cyclical luck.
The adjusted net profit after tax rising from $997 million to $1,033 million represents genuine earnings momentum driven by premium growth rather than cost reduction alone. This kind of result is capable of generating meaningful intraday divergence for QBE shares even against a broadly weaker market backdrop. For live updates on individual stock reactions to results like this, the AFR Markets Live blog provides real-time commentary throughout the trading session.
Sector Vulnerability Map for a Weak Open
When the ASX market open lower scenario materialises, the impact is not evenly distributed. Different sectors absorb pressure differently depending on their commodity linkages, earnings calendars, and liquidity profiles.
Materials and Mining
This sector sits closest to commodity price movements and tends to reprice fastest at the open. Copper exploration activity remains active, with Antares Metals (ASX:AM5) confirming copper mineralisation at depth through maiden drilling at Conglomerate Creek in Queensland.
Furthermore, Cosmo Metals (ASX:CMO) has identified a broad mineralised zone at the Kanowna Gold Project in Western Australia, while Capricorn Metals (ASX:CMM) has made a strategic acquisition of the Piastri project in WA. Osmond Resources (ASX:OSM) is progressing toward a maiden mineral resource estimate for its Orion project in Spain.
New mineralisation confirmations at exploration-stage companies can create isolated positive moves within a sector experiencing broader index-level weakness, a dynamic that experienced small-cap investors frequently exploit.
Energy
The dual decline in crude oil and natural gas futures makes the energy sector the most directly exposed to the current commodity backdrop. Producer margins compress quickly when benchmark prices move 2–3% in a single offshore session.
Financials
Bank earnings results create their own intraday dynamics. Commonwealth Bank recently released results that were met with a sell-the-news response despite solid underlying performance, illustrating how even strong financial sector earnings can generate unexpected price action when investor expectations are already priced in ahead of the release.
A Framework for Interpreting a Lower ASX Open
For investors navigating a session where the ASX market open lower signal is active, a structured pre-market checklist reduces reactive decision-making:
- Review overnight Wall Street performance and identify which sectors led the move
- Check key commodity prices, specifically iron ore, crude oil, and gold, for directional bias relevant to ASX sector weightings
- Monitor AUD/USD at $0.705 for currency-driven implications on export stock earnings
- Scan ASX futures pricing during the pre-open window for directional confirmation
- Identify which companies are reporting earnings that session to locate potential intraday divergence opportunities
- Distinguish between a technically driven pullback and a structurally deteriorating trend using sector rotation patterns
A lower open is a data point, not a verdict. The difference between a temporary pullback and a genuine trend reversal becomes visible only across multiple sessions, and rarely announces itself clearly in the first hour of trade.
Disclaimer: This article is intended for informational purposes only and does not constitute financial or investment advice. All figures and market data referenced reflect conditions as reported for the session dated 14 August 2026. Investors should conduct independent research and consult a licensed financial adviser before making any investment decisions. Past market behaviour is not a reliable indicator of future performance.
Want to Catch Significant ASX Mineral Discoveries the Moment They're Announced?
While navigating a lower ASX open demands a sharp eye on sector movements and commodity signals, Discovery Alert's proprietary Discovery IQ model does the heavy lifting for mineral discovery opportunities — instantly scanning ASX announcements across 30+ commodities and delivering real-time alerts to subscribers before the broader market reacts. Start your 14-day free trial today, or explore Discovery Alert's discoveries page to see how historic finds like those from De Grey Mining and WA1 Resources translated into extraordinary market returns.