August 14, 2026
When Monthly Data Tells a Bigger Story Than Annual GDP
Economic diversification rarely announces itself with a single data point. It accumulates across months and sectors, quietly reshaping the composition of a national economy until the numbers become impossible to ignore. Saudi Arabia's monthly business activity data has reached that threshold. The Saudi operating revenue index in May 2026 recorded an 11.4% year-on-year increase, according to figures released by the General Authority for Statistics (GASTAT), with momentum visible across more than eight distinct industry categories. Understanding what this reading means, and what it does not mean, requires looking beyond the headline figure.
When big ASX news breaks, our subscribers know first
What the Operating Revenue Index Actually Measures
The Operating Revenue Index is a composite statistical tool published monthly by GASTAT that captures business-level revenue flows across Saudi Arabia's major economic sectors. Unlike quarterly GDP estimates, the ORI operates at higher frequency and greater sector granularity, making it one of the most useful near-real-time indicators of private sector commercial activity available to analysts and investors.
Where GDP aggregates value-added output across an entire economy at a relatively broad level, the ORI tracks actual revenues generated by businesses operating within defined industry classifications. This distinction matters considerably in an economy undergoing structural transformation, because revenue growth at the sector level can signal demand shifts, investment payoffs, and market deepening long before these effects fully register in GDP aggregates.
The ORI's monthly cadence allows economists to identify turning points, sectoral rotations, and demand accelerations that quarterly GDP figures may smooth over or capture only with a significant lag.
GASTAT compiles ORI data through its Statistical Transactions System (STS), drawing on administrative and commercial reporting from businesses operating across the kingdom. The May 2026 release represents one of the most comprehensive monthly snapshots of Saudi commercial activity published this year.
Saudi Operating Revenue Index in May 2026: The Full Picture
Headline Performance at a Glance
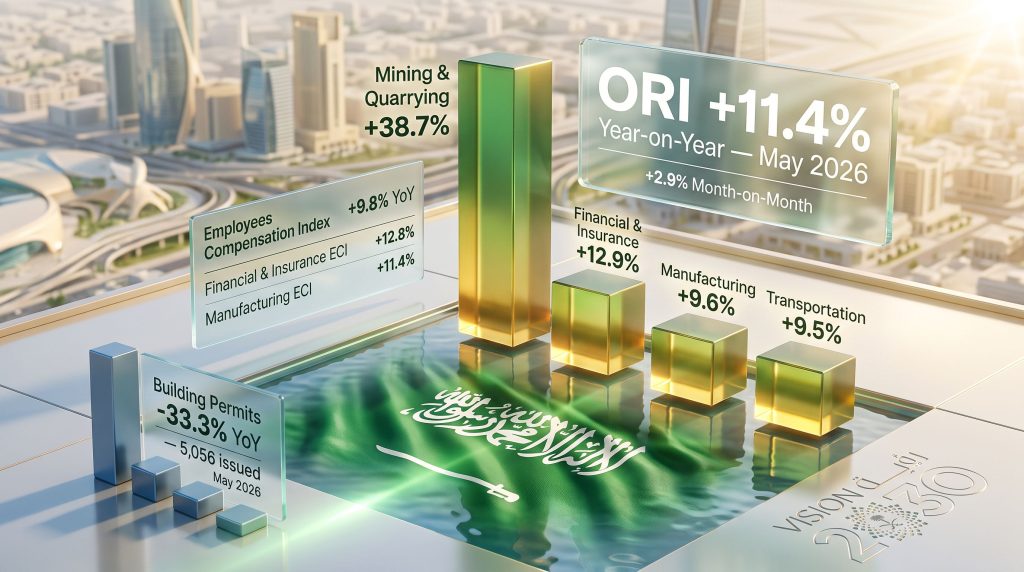
The May 2026 ORI reading delivered on multiple fronts simultaneously. Annual growth of 11.4% was complemented by a sequential monthly expansion of 2.9% from April 2026, confirming that the acceleration was not a base-effect distortion but a genuine broadening of business momentum. Furthermore, Saudi critical minerals development has been a key driver of this commercial expansion.
| Performance Metric | May 2026 Result |
|---|---|
| Year-on-Year ORI Growth | +11.4% |
| Month-on-Month ORI Growth | +2.9% |
| Strongest Annual Sector Gain | Mining and Quarrying (+38.7%) |
| Employees Compensation Index (YoY) | +9.8% |
| Building Permits Change (YoY) | -33.3% |
The breadth of sectoral participation is arguably as significant as the headline number. When growth concentrates in one or two sectors, it often reflects commodity pricing or a single government programme. When it spans transportation, hospitality, financial services, manufacturing, and retail simultaneously, it indicates something more structural.
Sector-by-Sector Annual Growth Breakdown
The annual performance across individual sectors reveals a hierarchy worth examining closely:
- Mining and quarrying: +38.7%, the standout result by a considerable margin
- Financial and insurance activities: +12.9%, reflecting continued banking sector deepening
- Manufacturing: +9.6%, consistent with domestic industrial output expansion
- Transportation and storage: +9.5%, supported by logistics corridor development
- Arts, entertainment and recreation: +9.1%, a direct beneficiary of cultural liberalisation
- Accommodation and food service: +8.2%, tracking rising visitor and domestic hospitality demand
- Real estate activities: +5.8%
- Administrative and support services: +5.5%
- Information and communication: +4.8%
- Wholesale and retail trade (including motor vehicle repair): +3.6%
- Construction: +2.5%
The 38.7% surge in mining and quarrying is the reading that commands the closest attention. Saudi Arabia is estimated to hold untapped mineral wealth potentially valued in the trillions of dollars, with significant deposits of gold, phosphate, copper, zinc, and rare earth elements distributed across the Arabian Shield geological formation. The Arabian Shield survey has historically been underexplored relative to its geological prospectivity, and increased extraction activity registering at this scale in the ORI suggests that investment in the sector is beginning to translate into commercial output, not merely exploration commitments.
Saudi Arabia's mineral sector ambitions are embedded in the National Mining Strategy, which targets a tripling of the sector's contribution to GDP by 2030. A single month's ORI reading cannot confirm that trajectory, but a 38.7% annual revenue surge is the kind of data point that suggests the strategy is generating real operational traction.
Monthly Momentum: Dissecting the 2.9% Sequential Increase
Month-on-month data carries its own analytical weight, particularly when it corroborates the annual trend rather than contradicting it. The 2.9% expansion from April to May 2026 was driven by:
- Mining and quarrying contributing the largest sequential uplift at +10.2%
- Information and communication activities rising +1.9%
- Wholesale and retail trade expanding +1.3%
- Financial and insurance activities growing +1.1%
- Manufacturing posting a +0.6% sequential gain
The fact that multiple sectors simultaneously accelerated between April and May reduces the probability that the annual result is a statistical artefact. Sequential gains across mining, finance, retail, and technology within the same month point to genuine, concurrent operational expansion rather than isolated sector spikes.
The Employees Compensation Index: Reading the Labour Market Signal
Annual ECI Performance
The Employees Compensation Index expanded 9.8% year on year in May 2026, a figure that carries considerable macroeconomic significance beyond the labour market itself. When revenue growth and wage growth trend upward together across the same industries, it creates the conditions for a self-reinforcing domestic demand cycle. According to Arab News reporting on the sector, mining and manufacturing have been particularly instrumental in lifting Saudi operating activity this year.
| Sector | Annual ECI Growth |
|---|---|
| Financial and Insurance Activities | +12.8% |
| Manufacturing | +11.4% |
| Wholesale and Retail Trade | +9.4% |
| Construction | +7.6% |
| Mining and Quarrying | +5.0% |
The alignment between high-ORI sectors and high-ECI sectors is particularly meaningful. Financial services recorded both strong revenue growth (+12.9%) and the highest wage growth (+12.8%), suggesting the sector is competing aggressively for skilled labour. Manufacturing similarly posted the second-highest ECI gain alongside solid revenue expansion, indicating that industrial employers are investing in their workforces concurrently with output growth.
Monthly ECI Movement
| Sector | Monthly ECI Change (Apr to May) |
|---|---|
| Information and Communication | +0.7% |
| Human Health and Social Work | +0.3% |
| Wholesale and Retail Trade | +0.5% |
| Mining and Quarrying | +0.3% |
| Transportation and Storage | +0.1% |
| Overall ECI | +0.1% |
The modest overall monthly ECI movement of +0.1% should not be read as weakness. Monthly wage adjustments are structurally stickier than revenue movements. The sectoral composition of even the marginal monthly gain, spanning digital communications, healthcare, retail, and mining, reflects an economy distributing compensation gains across a genuinely diversified set of industries.
Building Permits: What the Sharp Decline Actually Signals
The Numbers Behind the Contraction
Total building permits issued in May 2026 fell to 5,056, down from 7,584 in May 2025, representing a 33.3% year-on-year decline. The comparison against April 2026 (6,803 permits) produced a 25.7% monthly contraction, making this the most conspicuous negative data point in the May release.
Why This Requires Careful Contextualisation
A reflexive interpretation would treat a 33.3% permit decline as a construction sector alarm. The data, however, argues against that conclusion for several reasons:
- Construction sector ORI still posted +2.5% annual revenue growth, confirming that active project execution continued throughout May despite lower permit issuance
- Building permit figures capture new approvals, not delivery on existing project pipelines. A large backlog of previously approved permits can sustain construction activity well after the approval rate moderates
- Saudi Arabia's largest infrastructure investments, including giga-projects operating under distinct regulatory frameworks, may not be captured consistently within standard municipal permit data
- Monthly permit figures are subject to administrative processing timelines, seasonal patterns, and application clustering effects that can produce sharp single-month swings without signalling structural change
Interpreting a single month's permit contraction as a construction sector downturn, in the face of positive construction revenue data, risks drawing conclusions from noise rather than signal. Sustained permit weakness across multiple months would warrant more concern.
The next major ASX story will hit our subscribers first
May 2026 ORI Within the Broader Economic Context
Connecting to Q1 2026 GDP
GASTAT confirmed in June 2026 that Saudi Arabia's real GDP expanded 3.0% year on year in the first quarter of 2026, with both oil and non-oil activities each contributing 2.9% growth. The symmetry between oil and non-oil expansion is analytically significant because it contradicts narratives that frame Saudi growth as exclusively hydrocarbon-dependent.
The Saudi operating revenue index in May of +11.4% suggests that the momentum characterising Q1 carried meaningfully into Q2. If subsequent monthly ORI releases for June and July maintain similar trajectories, the case for Q2 2026 GDP outperforming Q1 strengthens considerably.
Vision 2030 Sector Alignment
| Vision 2030 Priority Area | Corresponding ORI Sector | May 2026 Annual Growth |
|---|---|---|
| Minerals and Mining Expansion | Mining and Quarrying | +38.7% |
| Industrial Development | Manufacturing | +9.6% |
| Financial Sector Deepening | Financial and Insurance | +12.9% |
| Tourism and Entertainment | Arts, Entertainment and Recreation | +9.1% |
| Hospitality Growth | Accommodation and Food Service | +8.2% |
| Digital Economy | Information and Communication | +4.8% |
The correspondence between Vision 2030 target sectors and May 2026 ORI outperformers is striking. In addition, the broader context of critical minerals demand driven by the global energy transition is amplifying investment into precisely the sectors the strategy identifies as transformation priorities. This does not mean the diversification programme has been delivered, but it does indicate that commercial activity is accelerating in alignment with strategic objectives.
Risk Factors and Forward-Looking Considerations
The following observations involve forecasts and scenario analysis. They should not be treated as investment advice or predictions of specific outcomes.
Several variables warrant ongoing monitoring as subsequent ORI releases become available:
- Hydrocarbon fiscal linkage: Non-oil sectors are clearly gaining velocity, but the government's capacity to fund infrastructure and strategic programmes remains partially tied to oil revenue. Sustained oil price weakness could constrain fiscal transfer capacity even as commercial sector revenues grow
- Permit pipeline normalisation: If building permit issuance remains depressed across multiple months rather than rebounding, the construction sector's current revenue resilience may prove temporary as the backlog of active projects depletes
- Wage-productivity alignment: The 9.8% annual ECI growth is a positive domestic consumption signal only if it is matched by productivity improvements. Wage growth outpacing output growth per worker would introduce cost pressures that could compress margins and eventually moderate hiring
- Mining sector sustainability: The 38.7% annual mining ORI gain is exceptional. Whether this represents a sustained extraction ramp-up, a commodity price effect, or a base-period distortion matters enormously for projecting the sector's medium-term contribution to non-oil GDP
Furthermore, Saudi exploration licences and Saudi mining licences issued in recent years are beginning to translate into active operations, which may help sustain the elevated mining ORI readings across coming months. However, broader commodity price dynamics will ultimately determine how much of this growth is structural versus cyclical.
Frequently Asked Questions: Saudi Operating Revenue Index in May 2026
What is the Saudi Operating Revenue Index?
The ORI is a monthly statistical measure compiled by GASTAT tracking business revenue performance across multiple economic sectors in Saudi Arabia, functioning as a real-time indicator of commercial activity.
Why did the ORI rise 11.4% in May 2026?
Growth was led by mining and quarrying (+38.7%), financial and insurance activities (+12.9%), and manufacturing (+9.6%), with additional contributions from transportation, hospitality, and retail sectors. The Saudi Gazette has noted that the 11.4% rise reflects broad-based gains rather than concentration in a single sector.
What does the Employees Compensation Index reveal?
The ECI's 9.8% annual rise in May 2026 indicates that revenue growth is translating into wage improvements across multiple industries, supporting consumer spending power and domestic economic resilience.
Does the building permits decline contradict positive ORI data?
Not conclusively. Construction sector revenues still grew 2.5% annually, existing project pipelines remain active, and administrative timing effects can influence single-month permit figures significantly.
How does the May 2026 data connect to Vision 2030?
The sectors recording the strongest ORI growth, including mining, manufacturing, financial services, tourism, and entertainment, correspond directly with Vision 2030 diversification priorities, suggesting the Saudi operating revenue index in May is tracking in alignment with strategic objectives across the kingdom's key transformation industries.
For official statistical data and methodology documentation, readers can access the GASTAT Statistical Transactions System releases at stats.gov.sa and related business coverage at arabnews.com.
Want to Track the Next Major Mineral Discovery Before the Market Does?
Saudi Arabia's mining and quarrying sector surged 38.7% in a single month, a reminder of how quickly mineral activity can reshape an economy — and create significant investment opportunities. Discovery Alert's proprietary Discovery IQ model delivers real-time notifications on significant ASX mineral discoveries, transforming complex geological data into actionable insights for investors at every level; explore historic examples of exceptional discovery returns or start your 14-day free trial today to position yourself ahead of the broader market.