August 1, 2026
The Quiet Revolution Reshaping How Australians Invest in Resources
For most of the twentieth century, gaining meaningful exposure to the global mining sector required either direct stock selection, substantial capital, or access to managed funds with high entry thresholds. Today, that calculus has changed entirely. Exchange-traded funds have democratised access to some of the most complex and cyclical sectors on earth, and nowhere is this more visible than in the performance of ASX mining ETFs during the 2025-26 financial year.
The numbers that emerged from FY26 were not incremental. They were the kind of returns that reshape investor conviction, challenge assumptions about portfolio construction, and invite serious questions about what actually drove such extraordinary outcomes, and whether any of it is repeatable.
Understanding those questions requires more than reading a performance table. It demands a structural examination of how ASX mining ETFs work, why FY26 was so exceptional, and how investors should think about positioning in a sector defined by volatility, commodity cycles, and geopolitical complexity. Furthermore, an ETF investing strategy that accounts for these dynamics is essential before committing capital.
When big ASX news breaks, our subscribers know first
Two Structural Forces That Rewired Mining Demand in FY26
The Green Energy Transition and Its Insatiable Appetite for Metals
The energy transition is not a single event. It is a multi-decade industrial reshaping that is fundamentally altering demand curves for a specific subset of commodities. Copper, lithium, cobalt, nickel, manganese, graphite, silver, and rare earth elements are no longer purely industrial inputs. They are the foundational materials of decarbonisation infrastructure, from utility-scale battery storage to offshore wind interconnectors to EV charging networks.
What made FY26 distinctive was the convergence of accelerating EV adoption globally with genuine supply-side constraints across several key metals. New mine development timelines are lengthening, often taking a decade or more from discovery to production. Environmental permitting processes have become more complex across multiple jurisdictions. The result is a structural tightening in supply that commodity markets responded to forcefully during FY26.
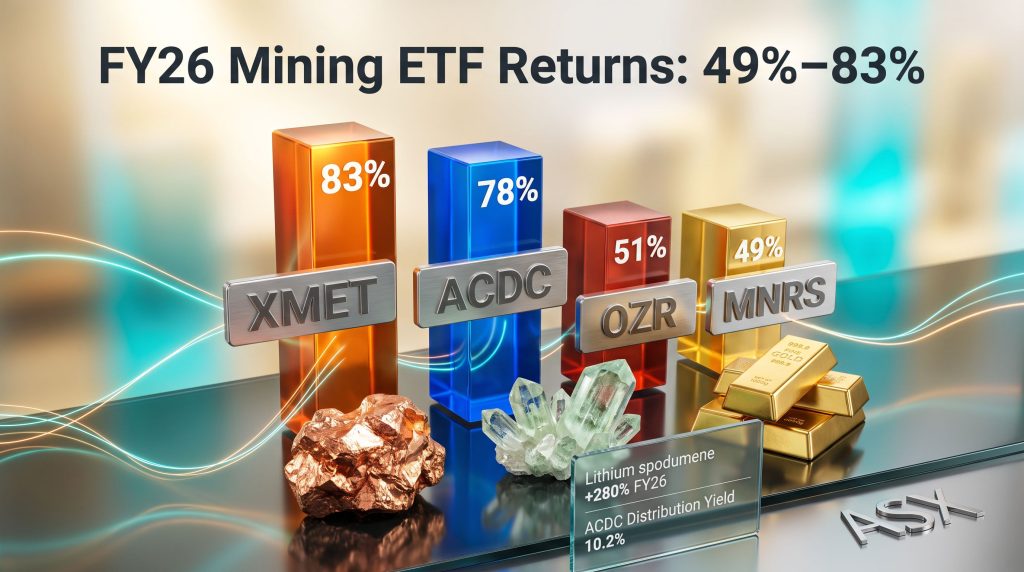
Lithium prices illustrated this dynamic most dramatically. Spodumene concentrate prices surged approximately 280% across the financial year, while lithium carbonate climbed roughly 160%. These are not marginal movements. They represent a fundamental repricing of a commodity that sits at the centre of the global battery supply chain. The scale of critical minerals demand translating directly into extraordinary earnings growth for producers globally cannot be overstated.
AI Infrastructure Build-Out: The Underappreciated Commodity Story
Less discussed but equally significant was the role that artificial intelligence infrastructure played in commodity demand during FY26. Data centres powering large-language models and AI inference workloads require enormous amounts of electricity. Copper is the primary conductor enabling that electricity distribution, from grid connections to internal cabling within server farms.
The scale of planned data centre investment across North America, Europe, and Asia created a secondary demand surge for copper that compounded the already-tightening transition metals market. The emerging copper supply crunch is broadly regarded as one of the most structurally significant commodity challenges of the 2020s, and FY26 saw that thesis begin to materialise in earnest across earnings results for major miners.
The intersection of two mega-trends, the green energy transition and the AI infrastructure build-out, created a commodity demand environment in FY26 that was genuinely unlike anything seen in prior cycles. Both forces are structural rather than cyclical, which is precisely what makes evaluating their persistence so complex for investors.
What Is an ASX Mining ETF and How Does It Actually Work?
An ASX mining ETF is an exchange-traded fund listed on the Australian Securities Exchange that provides diversified exposure to mining and resources companies, either domestically listed, globally listed, or both, without requiring investors to select individual mining stocks. They trade like shares throughout the ASX trading session and typically track a benchmark index tied to commodities, metals, or resources companies.
The structural advantages of this vehicle are significant. Rather than concentrating capital in a single miner and bearing the full operational, geological, and commodity price risk of that company, an ETF spreads exposure across dozens or hundreds of companies. Management expense ratios are generally far lower than actively managed funds, and the intraday tradability of ETFs provides liquidity that managed funds cannot match.
Domestic vs. Global Mining ETF Exposure
One of the most important distinctions for Australian investors is understanding the geographic composition of a mining ETF before buying.
-
Domestic resources ETFs (such as OZR) hold companies listed on the ASX, predominantly large-cap Australian miners and energy producers. These funds provide concentrated exposure to companies like BHP, Rio Tinto, and Woodside Energy.
-
Global thematic mining ETFs (such as XMET and ACDC) invest in internationally listed companies across multiple exchanges, providing access to miners and battery technology companies that are not accessible through the ASX directly.
-
Currency hedging introduces another critical variable. Hedged ETFs neutralise the impact of AUD/USD fluctuations on returns, while unhedged ETFs retain full currency exposure. In periods where the Australian dollar weakens against major currencies, hedged ETFs can materially amplify both capital returns and income distributions, a dynamic that played out with considerable force during FY26.
FY26 Performance Leaderboard: How the Top ASX Mining ETFs Ranked
Australian investors currently have $372 billion deployed across 458 ASX-listed ETFs, reflecting the maturation of this investment vehicle within the domestic market. The mining and resources subset of that universe produced some of the strongest returns of any sector category in FY26.
| ETF Ticker | ETF Name | FY26 One-Year Return | Distribution Yield | Geographic Focus | Key Commodity Theme |
|---|---|---|---|---|---|
| XMET | BetaShares Energy Transition Metals ETF | 83% | 3.6% | Global | Copper, Lithium, Rare Earths |
| ACDC | Global X Battery Tech & Lithium ETF | 78% | 10.2% | Global | Lithium, EV Batteries |
| OZR | SPDR S&P/ASX 200 Resources ETF | 51% (total return) | 2.4% | Australian | Broad Resources |
| MNRS | BetaShares Global Gold Miners ETF (Hedged) | 49% (total return) | 8.6% | Global ex-AU | Gold Mining |
The S&P/ASX 300 Metals and Mining Index rose 53% in price terms and delivered 59% total returns including distributions across FY26, establishing the benchmark against which these ETFs should be contextualised.
Deep Dive: Breaking Down Each High-Performing ASX Mining ETF
XMET: The Energy Transition Metals ETF Leading the FY26 Pack
The BetaShares Energy Transition Metals ETF delivered an 83% one-year return in FY26, with a historical distribution yield of 3.6%. This was the standout performer across the ASX mining ETF universe for the financial year.
XMET targets global producers of metals specifically critical to energy transition infrastructure. Its investment universe spans copper, lithium, nickel, cobalt, graphite, manganese, silver, and rare earth elements. The top holdings position the fund heavily toward copper miners, with BHP Group, Anglo American, and First Quantum Minerals among the largest positions.
The copper story within XMET deserves particular attention. Unlike lithium, which experienced dramatic price volatility across recent years, copper has structural supply deficits that most mining analysts project will persist well into the 2030s. Grade decline at existing copper mines is a well-documented phenomenon: as the highest-grade ore is extracted, remaining reserves become progressively lower grade, requiring more energy and water to process for equivalent metal output.
New large-scale copper discoveries capable of meeting future demand are increasingly rare, and the lead time from discovery to production typically exceeds a decade. In addition, innovations such as direct lithium extraction are beginning to reshape how markets think about supply timelines across transition metals more broadly.
XMET's 83% return reflects not just a single year of favourable commodity pricing but the beginning of a structural repricing of transition metals that many analysts believe remains in relatively early stages given the scale of electrification infrastructure still to be built globally.
ACDC: The Battery Technology and Lithium ETF Built for the EV Era
The Global X Battery Tech and Lithium ETF produced a 78% one-year return with a 10.2% historical distribution yield, making it one of the highest-yielding ETFs across the entire ASX market in FY26.
ACDC's outsized distribution reflected the extraordinary lithium price environment of FY26. The fund paid $16.34 per unit on 16 July, representing the largest dollar-value single payout recorded across Global X's ETF range. This figure was not driven by operational income in the traditional sense but rather by the flow-through of dramatically improved earnings from underlying holdings across the lithium and battery supply chain.
What makes ACDC structurally interesting is the breadth of its exposure. Rather than being purely a mining ETF, it spans the entire battery ecosystem:
- Mining layer: Rio Tinto, Mineral Resources, and Pilbara Minerals (PLS Group) provide upstream lithium production exposure
- Manufacturing layer: Contemporary Amperex Technology (CATL), the world's largest EV battery manufacturer, anchors the midstream
- Industrial technology layer: Siemens AG and Panasonic represent diversified industrial and electronics exposure connected to the energy transition
This diversification across the battery supply chain means ACDC is not purely a lithium price bet. It captures value creation at multiple points along the chain from ore in the ground to battery cell in a vehicle.
OZR: The Broad Australian Resources ETF Anchored by Domestic Giants
The SPDR S&P/ASX 200 Resources ETF delivered a 51% total one-year return in FY26, ranking as the top-performing domestic-stock-only ETF on the ASX for the financial year.
OZR tracks the S&P/ASX 200 Resources Index and holds 59 companies spanning miners, oil and gas producers, and other resources businesses including steel makers. The fund's 40% weighting to BHP is the most important single characteristic to understand, as it means OZR's performance is substantially correlated with BHP's operational results and commodity exposure.
Beyond BHP, Woodside Energy and Rio Tinto represent significant holdings, providing exposure to LNG production and diversified mining respectively. The concentration risk embedded in OZR's structure is a genuine consideration: a fund with 40% of capital in a single company behaves quite differently from a genuinely diversified vehicle, particularly during periods where BHP underperforms or outperforms its sector peers. Investors seeking a broader view of ASX-listed ETF options may find it useful to compare OZR against peer funds before committing.
MNRS: The Currency-Hedged Global Gold Miners ETF
The BetaShares Global Gold Miners ETF delivered a 49% total return in FY26, with a 8.6% historical distribution yield. MNRS tracks the Nasdaq Global ex-Australia Gold Miners Hedged AUD Index, which encompasses 54 gold mining companies listed internationally.
The top holdings, Barrick Mining, Newmont Corporation, and Wheaton Precious Metals, represent three distinct models within the gold sector:
- Barrick and Newmont are traditional large-scale gold miners, with earnings highly leveraged to the gold price
- Wheaton Precious Metals operates as a streaming and royalty company, providing capital to miners in exchange for the right to purchase future production at predetermined prices, a model that offers gold exposure with structurally lower operational risk
The currency hedging within MNRS proved particularly valuable during FY26. When the AUD weakens against the USD and other major currencies, hedged ETFs capture the full return of underlying holdings in AUD terms without the dilution that unhedged investors experience. During FY26, this mechanism amplified both capital returns and distribution amounts materially.
Gold miners provide a form of leveraged exposure to the gold price that physical gold ETFs cannot replicate. Because mining companies have fixed operating cost bases, a rise in the gold price flows disproportionately to the bottom line, amplifying returns during gold bull markets but equally magnifying losses during downturns.
Comparing ASX Mining ETF Categories: Matching Exposure to Objectives
| Category | Example ETFs | Best Suited For | Key Risk |
|---|---|---|---|
| Broad ASX Resources | OZR, QRE, MVR | Core portfolio diversification | Concentration in large-cap ASX miners |
| Energy Transition Metals | XMET | Long-term green economy exposure | Commodity price volatility |
| Battery Technology and Lithium | ACDC | EV supply chain thematic investing | Lithium price cycle risk |
| Global Gold Miners (Hedged) | MNRS | Inflation hedge and currency protection | Gold price sensitivity |
| Global Gold Miners (Unhedged) | GDX | Direct gold sector exposure | AUD/USD currency risk |
| Copper-Focused | WIRE | Single-metal thematic concentration | Supply and demand cycle risk |
The next major ASX story will hit our subscribers first
What Investors Should Evaluate Before Buying an ASX Mining ETF
The performance figures from FY26 naturally attract investor interest, but sound ETF selection requires looking well beyond trailing returns. The following framework provides a disciplined approach to evaluation:
Step-by-Step: How to Evaluate an ASX Mining ETF Before Investing
-
Identify the benchmark index the ETF tracks and understand its construction methodology, whether market-cap weighted, equal weighted, or thematically screened
-
Review the top 10 holdings and assess concentration risk, paying particular attention to any single-stock or single-commodity dominance that could amplify volatility
-
Compare the management expense ratio against peer ETFs in the same category, as seemingly small MER differences compound meaningfully over multi-year holding periods
-
Assess whether the ETF is currency-hedged or unhedged and how that aligns with your view on the AUD relative to major currencies over your intended holding period
-
Review the historical distribution yield alongside total return to understand the income and capital growth balance, avoiding the trap of chasing yield figures that may reflect exceptional one-off commodity price events
-
Check average daily trading volume to ensure adequate liquidity for your intended position size, as thinly traded ETFs can carry material bid-ask spread costs
-
Review the rebalancing frequency and holdings transparency of the ETF, understanding how often the portfolio is updated and whether holdings data is published with sufficient frequency for informed monitoring
Key Risks Specific to ASX Mining ETFs
Commodity Price Cycles: The Defining Risk
Mining ETF returns are fundamentally anchored to commodity prices, which are inherently cyclical. The boom conditions of FY26 reflected a genuine structural shift in demand, but structural shifts do not eliminate cyclicality. Lithium experienced a severe price correction between 2022 and 2024 before recovering strongly in FY26. Copper has experienced multiple significant bear markets despite long-term structural demand arguments.
Past performance in commodity-linked ETFs can be especially misleading. FY26's 49% to 83% return range across mining ETFs reflects a confluence of structural demand shifts, supply constraints, and macroeconomic conditions that may not persist uniformly. Commodity cycles are inherently mean-reverting over time, and investors entering after extraordinary performance periods carry elevated timing risk.
Additional Risk Dimensions to Understand
- Geopolitical risk: Global mining ETFs hold companies operating across multiple jurisdictions, some of which carry meaningful political and regulatory instability risk
- Environmental and permitting risk: Increasingly complex environmental approval processes globally are extending development timelines and creating uncertainty for new mine supply
- Single-theme concentration: Thematic ETFs like ACDC and XMET can experience severe drawdowns during periods when their specific commodity or technology theme falls out of favour
- Currency risk in unhedged vehicles: Unhedged global mining ETFs expose Australian investors to AUD/USD movements that can significantly enhance or erode returns independent of underlying asset performance
Frequently Asked Questions: ASX Mining ETFs
What Is the Difference Between QRE, MVR, and OZR for Australian Resources Exposure?
All three provide domestic ASX resources exposure but differ in index methodology, number of holdings, and rebalancing approach. OZR tracks the S&P/ASX 200 Resources Index with 59 holdings, while QRE and MVR use different index construction rules that can result in materially different sector weightings and top-holding concentrations. For instance, the VanEck Resources ETF (MVR) provides an alternative construction methodology worth examining alongside OZR.
Are ASX Mining ETFs Suitable for Long-Term Investors or Short-Term Traders?
Both, but for different reasons. Long-term investors can use broad resources ETFs as a structural allocation to commodity demand growth. Short-term traders may use thematic ETFs to express views on specific commodity price movements, though the volatility of these vehicles demands disciplined risk management.
Can ASX Mining ETFs Be Held Inside a Self-Managed Super Fund (SMSF)?
Yes. ASX-listed ETFs are eligible investments for SMSFs, subject to the fund's investment strategy and trustee obligations. The tax treatment of distributions within an SMSF depends on the fund's phase, either accumulation or pension phase.
What Is the Typical Management Fee Range for ASX Mining ETFs?
Management expense ratios for ASX mining ETFs typically range from approximately 0.35% to 0.67% per annum, depending on the complexity of the strategy, the geographic scope of the underlying index, and whether currency hedging is employed.
Do ASX Mining ETFs Pay Regular Dividends or Distributions?
Most ASX mining ETFs pay distributions semi-annually or quarterly, though payment amounts vary significantly depending on the income generated by underlying holdings. In exceptional years like FY26, distribution amounts can be materially higher than historical averages due to elevated commodity-related earnings.
The Macro Outlook: Can Mining ETFs Continue to Deliver?
Structural Tailwinds That Extend Beyond FY26
Several of the forces that drove FY26 performance have multi-decade structural characteristics:
- Global electricity grid infrastructure requires enormous volumes of copper, aluminium, and steel for transmission and distribution upgrades
- Battery storage deployment for grid-scale renewable energy is accelerating, maintaining lithium and related battery metal demand
- EV penetration rates across major markets remain well below saturation levels, sustaining forward demand projections for battery materials
- Data centre construction for AI workloads represents a new and largely incremental source of copper and energy demand that was not present in prior commodity cycles
The Supply-Side Constraint That Markets Are Pricing
New mine development timelines have lengthened considerably over the past two decades. Environmental approvals, community consultation requirements, and infrastructure development needs mean that even a well-funded project with a confirmed resource can take eight to fifteen years from discovery to first production. This structural lag between demand growth and new supply response is a key reason many commodity analysts remain constructive on transition metals despite the strong price appreciation already seen.
Gold's role in the macro environment also warrants attention. The case for gold safe-haven investment remains robust in a world of elevated geopolitical uncertainty and persistently high government debt levels, supporting the fundamental investment case for gold mining ETFs like MNRS beyond pure commodity price speculation.
Building a Considered Position in ASX Mining ETFs
The FY26 performance of ASX mining ETFs was exceptional by any historical measure. However, exceptional past performance is precisely the environment in which disciplined investment thinking matters most, because it is also when the greatest number of investors enter markets at or near peak valuations.
A considered approach to this sector might involve:
- Using a broad domestic resources ETF like OZR as a core holding that captures Australia's inherent comparative advantage in resources production
- Layering a thematic global ETF like XMET or ACDC on top for targeted exposure to the structural demand themes most likely to persist over the next decade
- Considering currency-hedged vehicles like MNRS for international exposure where AUD strength could otherwise erode returns
- Sizing positions relative to risk tolerance, recognising that commodity-linked ETFs can deliver 30% to 40% drawdowns in adverse market conditions just as they can deliver 50% to 80% gains in favourable ones
The structural case for transition metals and resources broadly remains compelling. Consequently, the most important variable for long-term investors is not which ETF had the best FY26 return. It is whether the underlying demand thesis remains intact over the holding period, and whether the entry price reflects a fair assessment of that future.
This article contains general information only and does not constitute personal financial advice. Investors should consider their own circumstances and seek professional financial advice before making investment decisions. Past performance is not indicative of future returns.
Want to Know Which ASX Mineral Discoveries Could Drive the Next Wave of Mining Returns?
Discovery Alert's proprietary Discovery IQ model delivers real-time alerts on significant ASX mineral discoveries, instantly translating complex mineral data into actionable investment insights for both traders and long-term investors. Explore historic examples of major mineral discoveries and their market returns, then begin your 14-day free trial to position yourself ahead of the broader market.