August 6, 2026
The Structural Forces Rewriting the Rules for ASX Mining Shares
Commodity cycles have always moved in long, grinding waves, shaped by geology, capital, and the pace of industrial transformation. However, the forces currently propelling the ASX mining shares commodities super cycle are unlike anything seen in the previous generation of resource booms. Where the China-driven surge of the 2000s was largely anchored to a single geography building a single type of infrastructure, today's demand profile is geographically dispersed, technologically diverse, and structurally reinforced by three simultaneous megatrends operating across different time horizons.
Understanding why ASX mining shares have delivered back-to-back years of outsized performance requires looking past short-term price charts and examining the deeper architecture of the current commodity environment. The distinction between a cyclical upswing and a genuine super cycle matters enormously for investment decision-making, and the evidence is increasingly pointing toward the latter.
When big ASX news breaks, our subscribers know first
What Separates a Super Cycle from a Standard Bull Market?
Not every commodity price rally qualifies as a super cycle. Standard bull markets in resources are typically driven by temporary supply disruptions, short-term inventory drawdowns, or speculative positioning, and they tend to revert relatively quickly as new supply enters the market or demand softens.
A true commodities super cycle is defined by different characteristics:
- Structural demand growth that persists across multiple economic cycles rather than being tied to a single event
- Prolonged supply constraints rooted in geological scarcity, long project development timelines, or geopolitical access barriers
- Price elevation that outlasts normal correction cycles, forcing producers to permanently re-rate their cost structures and capital allocation strategies
- Demand coming from multiple end-use sectors simultaneously, reducing the single-point-of-failure vulnerability that collapsed the previous cycle
The China super cycle of 2000 to 2011 was predominantly driven by one nation's infrastructure buildout. When Chinese fixed asset investment growth began moderating around 2011 to 2012, commodity prices suffered a prolonged multi-year deflation. The current cycle is structurally different because demand is being generated concurrently by global electrification, AI infrastructure construction, and energy security diversification across the United States, Europe, Southeast Asia, and the Middle East.
Furthermore, no single geography can switch off all three demand engines simultaneously. For a broader look at key drivers of the new commodities supercycle, expert analysis confirms this multi-engine demand structure as one of the most compelling features distinguishing the current environment from previous cycles.
"The geographic distribution of today's commodity demand across multiple regions and end-use sectors represents a fundamental structural shift compared to the China-centric cycle of the 2000s, materially reducing the single-point-of-failure risk that caused the previous cycle's dramatic collapse."
Many analysts describe the current environment as still being in the early confirmation phase of a super cycle rather than a fully mature one, which carries an important implication: the largest price gains may still lie ahead rather than already being priced in.
ASX Materials Sector Performance: Two Years of Structural Outperformance
The performance data for ASX mining shares in 2025 and into 2026 is not merely impressive in isolation. Its significance lies in the consecutive nature of the outperformance, which historically has been a more reliable signal of structural trend change than any single year of strong returns.
| Metric | 2025 Full Year | 2026 Year-to-Date |
|---|---|---|
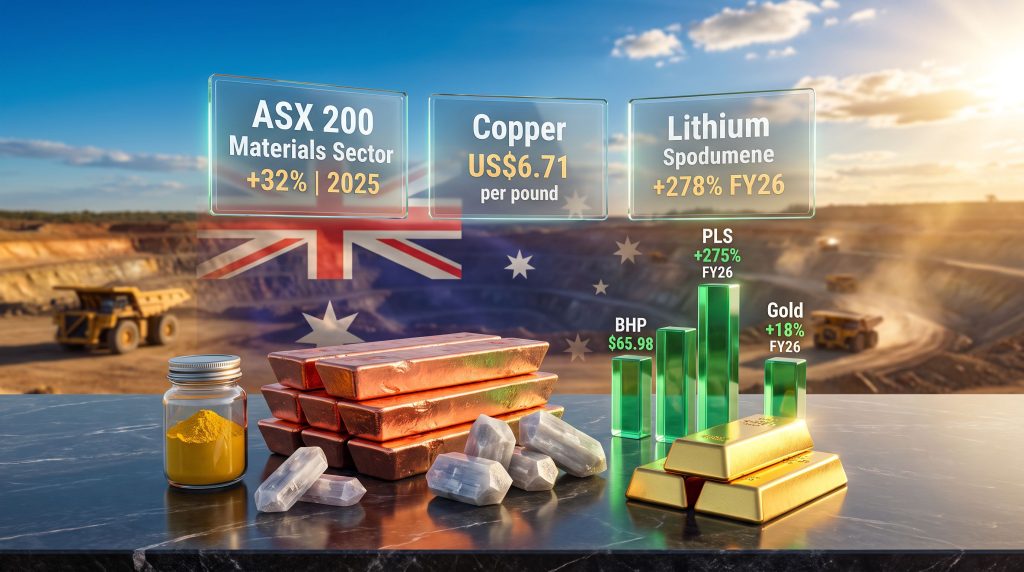
| ASX 200 Materials Sector | +32% | +15.8% |
| ASX 200 Benchmark (XJO) | Benchmark | +6.2% |
| ASX 200 Energy Sector | N/A | +22.2% |
| ASX 200 Consumer Staples | N/A | +16.2% |
| ASX 200 All-Time High (Points) | N/A | 9,296.7 |
The ASX 200 itself reached an all-time high of 9,296.7 points during trading, with the benchmark index up 6.2% calendar year-to-date. While that headline figure reflects healthy broader market conditions, it masks a stark internal divergence. For investors seeking to act on these trends, our ASX mining stocks guide provides detailed analysis of the companies best positioned to benefit.
CommSec Equity Market Strategist James Gruber has characterised the ASX 200 as a two-tiered market in 2026, with resource-sector companies pulling decisively ahead of domestically oriented businesses in sectors like financials and consumer discretionary. This bifurcation matters for portfolio construction because it suggests that passive broad-market exposure may significantly underperform targeted commodity sector positioning during the current phase of the cycle.
It is worth noting that the energy sector has actually led all ASX 200 sectors year-to-date at +22.2%, boosted by higher oil and gas prices stemming from the prolonged US-Iran conflict. Consumer staples follows at +16.2%, with materials at +15.8%. However, mining's outperformance across two consecutive years carries a different quality of signal than energy's single-year boost from geopolitical supply disruption.
Why Australia's Market Is Uniquely Positioned as a Commodity Proxy
Australia holds disproportionately large global reserves across precisely the metals most in demand during the current super cycle. The nation is among the world's leading holders of copper, lithium, gold, and uranium resources, giving ASX-listed producers natural leverage to global commodity price movements.
For international investors unable to access commodity futures markets directly, and for domestic Australian investors seeking exposure to global electrification and AI infrastructure themes, ASX mining shares function as accessible equity proxies for these structural commodity trades. This dynamic is particularly important given that the Australian technology sector remains relatively small by global standards, meaning the AI investment thesis plays out through an entirely different channel on the ASX than it does on US exchanges.
Portfolio managers at Blackwattle Investment Partners have identified this dynamic explicitly, noting that recent ASX index gains have appeared more thematic than broad-based, with returns concentrated in a narrow group of sectors. Their analysis points to the Resources sector's copper exposure as the primary vehicle through which the AI infrastructure trade is being expressed in Australian-listed markets. BHP Group Ltd (ASX: BHP), in their assessment, is increasingly valued by the market for its copper exposure rather than its iron ore earnings.
Copper: The Metal That Ties AI Infrastructure to Mining Earnings
Why Is Copper Central to the Super Cycle?
Copper's role in the current super cycle deserves particular analytical attention because it bridges two otherwise separate investment themes: the global electrification buildout and the AI technology infrastructure boom. Indeed, the copper supply crunch is now widely regarded as one of the most structurally significant constraints facing the global energy transition.
The copper price reached a record US$6.71 per pound in mid-2026, representing an 18% gain across FY26. While the electrification demand story is well understood, the AI data centre demand component remains underappreciated by many retail investors. Each hyperscale data centre requires substantially more copper wiring, power distribution equipment, and cooling infrastructure than a conventional commercial building of equivalent size.
The supply side of the copper equation makes this demand picture more acute. The average timeline from mineral discovery to first commercial production at a copper mine runs between 10 and 15 years, accounting for exploration, resource definition, feasibility studies, environmental approvals, construction, and commissioning. This means that even if today's record copper prices incentivise a wave of new project approvals, the resulting supply will not reach markets until the mid-2030s at the earliest.
Declining ore grades at major established copper mines around the world compound this supply constraint. As the highest-grade deposits are progressively depleted, miners must process ever-larger volumes of rock to produce equivalent quantities of copper, increasing both costs and energy consumption. This grade decline phenomenon is a long-term geological reality that cannot be reversed by capital investment alone.
Key copper demand drivers operating simultaneously in 2026:
- AI hyperscale data centre construction requiring high-density copper wiring and power systems
- Grid infrastructure expansion to accommodate renewable energy integration across Europe, North America, and Southeast Asia
- Electric vehicle motor and battery management system manufacturing
- Industrial heat pump and energy efficiency equipment rollouts
- Defence and aerospace applications in energy-security-prioritising nations
Lithium: Understanding the Recovery from a Historic Crash
Lithium's price trajectory over recent years represents one of the most instructive case studies in commodity cycle dynamics available to investors. After the extraordinary price spike of 2022, lithium spodumene prices collapsed sharply through 2023 and 2024 as a supply glut materialised from aggressive project development during the peak. The lithium oversupply downturn that followed serves as a critical reminder that even structurally sound commodity themes can experience severe interim corrections.
The FY26 recovery has been striking: lithium spodumene prices surged 278% over the financial year. Pilbara Minerals Ltd (ASX: PLS), one of the ASX's most closely watched lithium producers, saw its share price rise 275% across FY26, reaching a record high of $6.81 in June 2026.
What makes this recovery more credible than previous false dawns in the lithium market is the breadth of the demand recovery. Rather than being driven purely by passenger EV adoption, the current lithium demand resurgence is being generated from multiple concurrent sources:
- Battery gigafactory capacity expansions in Europe and North America reaching operational readiness and beginning to draw on raw material supply chains
- Accelerating EV adoption in Southeast Asian and Indian markets where growth rates are outpacing mature Western markets
- Grid-scale stationary battery storage deployment to firm intermittent renewable energy output
- Consumer electronics demand recovering from the post-pandemic inventory correction
The lesson from lithium's crash-and-recovery cycle is that commodity markets with long project development timelines are prone to overcorrecting in both directions. The supply glut that caused the 2023 to 2024 crash was itself a product of producers responding to 2022 price signals, and the resulting supply growth temporarily overwhelmed demand. As that excess supply is absorbed, structural demand reasserts itself.
The next major ASX story will hit our subscribers first
Gold's Structural Bull Market and the Central Bank Demand Story
Gold appreciated 18% across FY26, supported by a global trend of central bank gold demand that represents a more durable driver than the speculative or fear-driven buying that has historically characterised gold bull markets.
Sovereign wealth funds and reserve managers across multiple regions are actively diversifying their foreign exchange reserve holdings away from US dollar-denominated assets, increasing gold's share of their balance sheets. This is not a short-term trade but a multi-year strategic reallocation that creates a persistent demand floor beneath the gold price.
For low-cost gold producers with disciplined capital allocation, structurally elevated gold prices create a compounding value proposition. The margin between the gold price and a miner's all-in sustaining cost (AISC) widens, generating elevated free cash flow that can be deployed into reserve growth, dividend increases, or debt reduction.
Capricorn Metals Ltd (ASX: CMM) illustrates this dynamic particularly well. Its share price reached a record high of $16.48 in January 2026. Fund managers who have studied the company characterise it as one of the highest-quality gold producers on the ASX, with a low-cost operating base and a management team with a demonstrated track record of disciplined capital deployment. The pending approval of the Mt Gibson project is expected to transform CMM into a 300,000+ ounce per annum producer, with production costs sitting well below the prevailing gold price.
ASX Mining Share Performance: The Key Stocks Driving the Cycle
The ASX mining shares commodities super cycle is not delivering uniform returns across all miners. Performance has been concentrated in companies with direct exposure to the highest-demand commodities.
| Company | Commodity Focus | Key Price Milestone | FY26 Highlight |
|---|---|---|---|
| BHP Group Ltd (ASX: BHP) | Diversified / Copper | Record $65.98 (June 2026) | Reclaimed largest ASX company by market cap (May 2026) |
| Rio Tinto Ltd (ASX: RIO) | Diversified | Record $195.84 (June 2026) | Exposure across copper, aluminium, iron ore, and lithium |
| Sandfire Resources Ltd (ASX: SFR) | Pure-play copper | Record $21.75 (January 2026) | ASX 200's largest pure-play copper miner |
| Pilbara Minerals Ltd (ASX: PLS) | Lithium | Record $6.81 (June 2026) | Share price +275% over FY26 |
| Capricorn Metals Ltd (ASX: CMM) | Gold | Record $16.48 (January 2026) | Mt Gibson approval pending; 300k+ oz/year production profile |
Pure-play producers like Sandfire Resources offer higher earnings leverage to commodity price movements than diversified majors, but this comes with correspondingly higher concentration risk. A single commodity price correction has a more direct impact on a pure-play miner's earnings than on a diversified major with offsetting commodity exposures across its portfolio.
Risk Factors That Investors Must Weigh Carefully
No investment thesis is complete without a rigorous examination of its failure modes. The ASX mining shares commodities super cycle has compelling structural foundations, but several risk factors could interrupt or compress its timeline.
Supply-side response: The natural corrective mechanism in any commodity cycle is price-induced new supply. The 10 to 15 year development timeline for copper projects means this response is slow, but it is not zero. Projects currently being approved in response to elevated prices will begin contributing supply in the early 2030s, and this supply wave could compress margins in the second half of the decade.
Technological substitution: A less commonly discussed risk is the potential for materials science innovation to reduce copper or lithium intensity in future energy and transport technologies. Aluminium wiring, solid-state battery chemistries, or sodium-ion battery technologies could each reduce the per-unit demand for specific metals, though these transitions typically unfold over decades rather than years.
Geopolitical variables: The current US-Iran conflict has increased energy prices globally, which creates a dual effect for miners: higher copper and aluminium demand from energy diversification efforts, but also higher fuel costs that compress operating margins. China's position as both the world's largest commodity consumer and the dominant processor of critical minerals represents a concentrated geopolitical risk for the entire supply chain.
Domestic cost pressures: Australian miners face labour market tightness in Western Australia and Queensland, extended regulatory and environmental approval timelines for new projects, and elevated fuel costs from the ongoing oil price shock.
Scenario analysis for ASX mining investors:
| Scenario | Key Trigger | Likely Duration | Implications |
|---|---|---|---|
| Extended Super Cycle | Electrification demand structurally exceeds supply growth for a decade | 2026 to 2035 | Sustained earnings growth, dividend expansion, valuation re-rating |
| Strong Upswing | Robust demand but new supply responds faster than anticipated | 2026 to 2029 | Three to four years of strong returns followed by price normalisation |
| Cycle Interruption | Major China demand shock or rapid geopolitical de-escalation | Near-term | Commodity price correction, earnings downgrades |
How to Evaluate ASX Mining Shares During a Super Cycle
What Metrics Matter Most for Miner Analysis?
Thematic tailwinds elevate all boats to some degree, but disciplined stock selection remains essential. Investors should ground their analysis in fundamentals rather than narrative momentum alone. Understanding the commodity price impact on individual companies is fundamental to separating genuinely attractive opportunities from those simply riding market sentiment.
The critical metrics for evaluating miners in a super cycle environment:
- All-in Sustaining Cost (AISC): This is the most important profitability metric. AISC captures all costs required to maintain current production levels, including operating costs, royalties, sustaining capital, and corporate overheads. A miner with an AISC of US$1,400 per gold ounce generates dramatically different margin outcomes at a US$3,000 gold price than one with an AISC of US$2,200.
- Reserve life: The number of years of production supported by current mineral reserves directly affects how long a miner can sustain its earnings trajectory without discovering or acquiring new resources.
- Debt-to-EBITDA ratio: Balance sheet strength determines a company's resilience through commodity price downturns and its capacity to fund growth projects without diluting shareholders.
- Commodity price sensitivity analysis: Understanding the earnings impact of a 10% movement in the relevant commodity price allows investors to model downside scenarios with precision.
- Ore grade quality: Higher-grade deposits deliver lower processing costs per unit of metal produced, creating a structural cost advantage that compounds over a mine's life. Grade is a geological characteristic that cannot be manufactured through operational efficiency alone.
Comparing investment approaches for commodity exposure:
| Approach | Risk Level | Earnings Leverage | Liquidity | Best Suited For |
|---|---|---|---|---|
| Diversified Major (BHP, RIO) | Lower | Moderate | High | Conservative commodity exposure |
| Pure-Play Producer (SFR, PLS) | Medium-High | High | Medium-High | Targeted commodity thesis |
| ASX Resources ETF | Medium | Moderate | High | Passive broad exposure |
| Junior Explorer or Developer | Very High | Very High | Low | Speculative, high-conviction positions |
For those comparing ASX stocks riding the supercycle, independent analysis highlights that the highest-quality returns tend to cluster around companies with low-cost production profiles and long reserve lives rather than simply those with maximum commodity price exposure.
"When market returns are generated by a narrow group of thematic leaders, concentration risk increases substantially. Investors should assess whether their commodity exposure is appropriately distributed across multiple metals and minerals rather than over-indexed to a single AI-linked trade. A crowded trade is vulnerable to sharp reversal if the underlying narrative is challenged by unexpected supply responses or demand disappointments."
What Indicators Should Investors Monitor Going Forward?
The commodities super cycle is a multi-year thesis, but its trajectory will be shaped by observable leading indicators that investors can track in real time.
The highest-value signals to watch:
- Copper price trajectory and exchange inventory levels at the London Metal Exchange and COMEX, which reflect the real-time balance between physical supply and demand
- Lithium spodumene contract pricing for upcoming quarters, which signals whether the spot price recovery has translated into contracted offtake arrangements
- Central bank gold purchase data from the World Gold Council, published quarterly, which tracks sovereign demand trends
- AI capital expenditure announcements from major technology companies, which function as forward-looking demand indicators for copper and power infrastructure
- New copper mine permitting and development timelines globally, which determine when new supply will enter the market and how long the current deficit may persist
- Australian mining sector earnings revisions from the major sell-side research houses, which will reflect commodity price changes flowing through to company-level profitability in real time
The convergence of AI infrastructure demand, global electrification programmes, energy security realignment, and central bank gold accumulation has created a commodity demand environment with limited historical precedent. The ASX materials sector's back-to-back outperformance in 2025 and into 2026 suggests institutional capital is beginning to price in a prolonged cycle. However, the absence of the speculative excess that typically characterises a cycle peak means the current positioning arguably still reflects rational fundamental repricing rather than irrational exuberance.
This article contains general information only and does not constitute financial advice. Commodity prices, share prices, and market conditions can change rapidly and past performance is not an indicator of future returns. Investors should consider seeking independent financial advice before making investment decisions.
Want to Know Which ASX Mining Discoveries Could Define the Next Phase of This Super Cycle?
Discovery Alert's proprietary Discovery IQ model delivers real-time alerts the moment significant mineral discoveries are announced on the ASX, instantly cutting through the complexity of 30+ commodities to surface actionable opportunities in copper, lithium, gold, and beyond — precisely the metals driving today's structural super cycle. Explore Discovery Alert's dedicated discoveries page to understand the historic returns major ASX mineral discoveries have generated, and begin your 14-day free trial to position yourself ahead of the broader market.