
June 26, 2026
When Index Levels Lie: The Hidden Warning Inside ASX Breadth Data
Market breadth is one of the oldest and most reliable tools in technical analysis, yet it remains chronically underappreciated by retail investors fixating on index levels. When the number of declining stocks consistently exceeds advancing stocks across every session of a trading week, while the headline index holds near multi-month highs, something structurally important is being communicated. That signal is not noise. It is the market quietly revealing that conviction is narrowing, participation is thinning, and the apparent stability of the index number is being manufactured by a shrinking cohort of outperformers.
This is precisely the dynamic that defined Australian equity markets in late June 2026, and understanding it is essential context for anyone trying to navigate the ASX weekly wrap: narrow leadership, sticky core inflation and weak Aussie environment that investors are now confronting.
When big ASX news breaks, our subscribers know first
ASX 200 Range-Bound With Deteriorating Internals
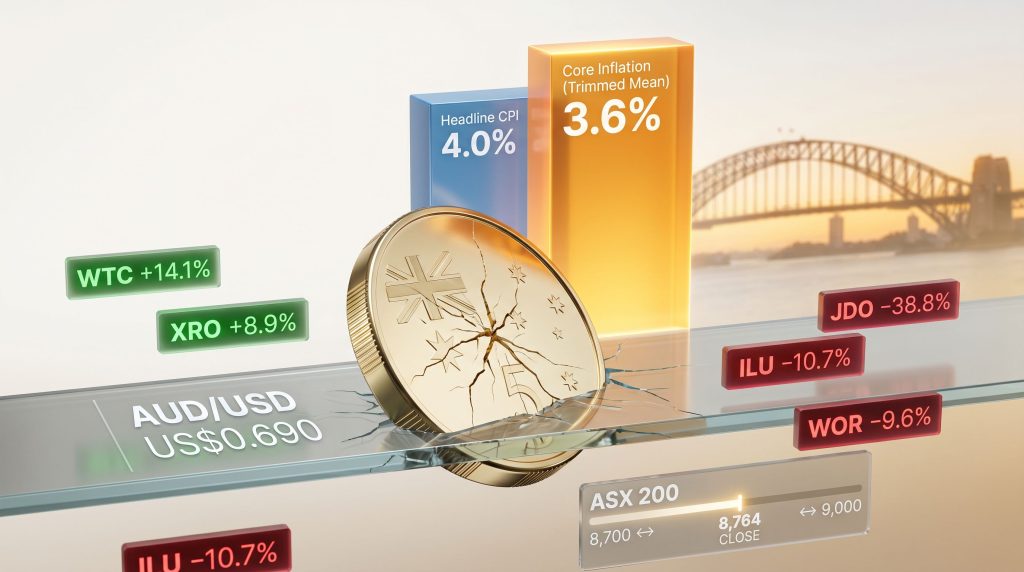
The ASX 200 closed Friday's session at 8,764 points, having spent the entire week oscillating within a now well-established corridor between approximately 8,700 (support) and 9,000 (resistance). On the surface, that looks orderly. Beneath the surface, the internals tell a more cautionary story. ASX market performance continues to exhibit this tension between headline stability and internal deterioration.
Decliners outnumbered advancers in every single session across the five-day trading week. Yet the ASX 200 VIX, the index's implied volatility gauge, actually compressed during this period, sliding from 12.44 to 11.72. A VIX reading in the low-to-mid teens is historically subdued, suggesting the options market is pricing minimal near-term stress even as breadth deteriorates.
This combination — falling volatility alongside negative breadth — is a classic signature of institutional complacency building quietly beneath an apparently stable market surface. It is the kind of environment where risk feels low until it suddenly does not.
Narrow leadership is not simply an academic observation. It has practical portfolio implications. When a handful of stocks are doing the heavy lifting for an index, the withdrawal of just one or two of those leaders can produce disproportionate index-level damage.
Leadership rotation was sharp and daily throughout the week:
- Wednesday belonged to technology, with WiseTech Global (WTC) surging 14.1% to $32.81 and Xero (XRO) advancing 8.9% to $70.77, as domestic investors selectively looked through offshore megacap weakness
- Thursday shifted to cyclicals on stock-specific catalysts, with Lend Lease (LLC) up 9.3%, Guzman y Gomez (GYG) gaining 9.1%, and Reece (REH) climbing 8.4%
- Friday handed the baton to gold miners, with Perseus Mining (PRU) +3.8%, Ramelius Resources (RMS) +3.5%, and Regis Resources (RRL) +3.5% carrying the index into the close
None of these moves reflected a cohesive macro thesis driving the whole market. Each was isolated, stock-specific, and quickly followed by a rotation away from the previous day's winners.
Inflation Bifurcation: Relief at the Headline, Persistence in the Core
The week's most consequential domestic data release was the May inflation print, and it delivered a classically split verdict that left neither bulls nor bears with a clear win.
| Inflation Metric | Previous Reading | Latest Reading | Market Expectation | Outcome |
|---|---|---|---|---|
| Headline CPI (Annual) | 4.2% | 4.0% | 4.4% | Better than expected |
| Monthly CPI Change | Positive | -0.7% MoM | N/A | First monthly fall since Aug 2025 |
| Trimmed Mean (Core) | Below 3.6% | 3.6% | 3.5% | Above expectations |
| Core Inflation Context | N/A | Highest since Sept 2024 | N/A | Structurally concerning |
The headline softening to 4.0% annually and the first monthly price decline since August 2025 provided genuine relief. Markets had braced for 4.4%, so the undershoot was notable. However, the trimmed mean — which strips out the most volatile price components and serves as the Reserve Bank of Australia's preferred gauge of underlying inflationary pressure — moved in the opposite direction, accelerating to 3.6% and reaching its highest reading since September 2024.
Why the Trimmed Mean Matters More Than the Headline
Understanding the distinction between headline and core inflation is critical for interpreting RBA policy signals. Headline CPI is heavily influenced by items like fuel costs, fresh food, and utility prices, which can swing dramatically from month to month based on seasonal or geopolitical factors. The trimmed mean removes the top and bottom 15% of price movements by weight, leaving the middle 70% as a more stable representation of economy-wide inflationary pressure.
When this core measure is rising while headline inflation falls, it typically means that the disinflation occurring at the surface is being driven by volatile, transitory factors rather than by genuine demand destruction or supply normalisation. That is precisely the situation Australian policymakers now face.
RBA Deputy Governor Andrew Hauser reinforced this concern in recent public commentary, emphasising that underlying inflation remains too elevated and that further policy restraint will be necessary to bring it back within the target band. With core inflation projected to remain above 3% through mid-2027, the probability of near-term rate cuts has diminished materially.
Domestic Economic Resilience Complicates the Picture
The inflation problem is made harder to solve by the fact that the economy is not buckling under rate pressure:
- Employment: 40,300 jobs added in May; unemployment rate at 4.4%, reflecting ongoing labour market tightness
- Household spending: Monthly rebound of +1.3%, signalling that consumer demand remains intact despite elevated borrowing costs
- Manufacturing PMI: Held in expansion at 51.2 for June, pointing to an economy that is softening but not contracting
- 10-year government bond yield: Eased to approximately 4.7%, a four-month low, as bond markets price a more cautious RBA path
The policy paradox here is acute. A resilient economy validates the case for holding rates higher for longer, but that same resilience is one of the structural forces sustaining inflationary pressure. The RBA cannot rely on economic weakness to do its disinflationary work for it.
Why the Australian Dollar Is Weakening Despite Strong Data
One of the more counterintuitive dynamics of the current environment is the divergence between reasonably solid domestic fundamentals and a weakening Australian dollar. The AUD/USD pair fell below US$0.690 during the week, touching a three-month low and representing a meaningful psychological threshold for import cost dynamics and commodity sector earnings translation.
The explanation lies not in Australian fundamentals but in the global interest rate differential framework. Furthermore, this ASX weekly wrap: narrow leadership, sticky core inflation and weak Aussie environment is increasingly shaped by diverging central bank trajectories globally.
| Impact Channel | Short-Term Effect | Medium-Term Effect |
|---|---|---|
| Import costs | Higher input inflation for manufacturers and retailers | Sustains core CPI above target |
| Resource sector earnings | AUD-denominated revenues increase on translation | Partially offsets commodity price weakness |
| Tourism and education exports | More competitive pricing for inbound visitors | Structural uplift for services sector |
| Consumer purchasing power | Reduced real income for households | Potential demand destruction over time |
Markets ended the week pricing approximately a 75% probability of a September Federal Reserve rate hike, driven by persistent US inflationary pressures and a hawkish Fed posture. In contrast, RBA rate expectations softened further, with markets assigning only around a 50% probability of another increase from the current 4.35% cash rate, and some participants beginning to price RBA cuts into the second half of 2027.
When the Fed is hiking or holding at elevated levels while the RBA is expected to ease, the interest rate differential mechanically pressures the AUD lower. This is not a temporary anomaly. It is a structural headwind that will persist until one of two things changes: the Fed pivots, or the RBA surprises with unexpected hawkishness.
The Anatomy of Judo Capital's 39% Collapse
The single most dramatic equity event of the week was the implosion of Judo Capital (JDO), which collapsed 38.8% to 52-week lows in a single session on Thursday. While the immediate trigger was a downward revision to the company's 2026 earnings outlook, the deeper story is a structural one that carries implications well beyond Judo specifically.
The Judo Capital episode is not merely a company-specific stumble. It exposes a systemic fault line within Australia's smaller lender ecosystem, where wholesale funding dependency creates acute margin vulnerability in a higher-for-longer rate environment.
Unlike the major Australian banks, which benefit from large, diversified, and relatively low-cost retail deposit bases, challenger lenders like Judo rely disproportionately on wholesale funding markets. When the cost of that wholesale funding rises persistently, net interest margins compress rapidly and earnings guidance becomes increasingly difficult to maintain.
The read-across from this event is meaningful. Technology One (TNE) also declined 7.1% during the week, reflecting broader vulnerability across rate-sensitive growth valuations whenever inflation data surprises to the upside. In a sticky-inflation, higher-for-longer rate environment, the market continues to apply a significant valuation discount to any business model carrying elevated funding cost exposure or stretched growth multiples.
Other Notable Decliners
The pain was widely distributed across several sectors:
- Resources: Iluka Resources (ILU) –10.7%, Beach Energy (BPT) –8.2% to a five-year low, Worley (WOR) –9.6%
- Lithium: Pilbara Minerals (PLS) –6.4%, Liontown stock performance continued its challenging trajectory with (LTR) –5.5%, reflecting continued spot price weakness in the underlying commodity
- Biotech: Mesoblast (MSB) –9.1%, IperionX (IPX) –9.8%
Global Markets: Semiconductor Strength vs. Megacap Doubt
Offshore leads provided little support, with a notable bifurcation emerging within US technology that complicated simple sector-level narratives.
The semiconductor complex delivered extraordinary performance following strong earnings results. Micron surged approximately 16% on a blowout quarterly result and upbeat forward guidance. Qualcomm advanced 13%, Sandisk gained 22%, Applied Materials climbed 13.4%, and Western Digital added 4.9%. The common thread was AI infrastructure demand driving exceptional data centre and memory chip consumption.
However, the consumer-facing megacap technology names moved in the opposite direction. Alphabet, Microsoft, Amazon, Meta, Apple, and Nvidia all declined during the week as institutional investors began questioning whether the extraordinary scale of AI capital expenditure programs will ultimately generate returns commensurate with the investment. The Nasdaq logged multiple consecutive down sessions, finishing the week soft.
China presented a clear headwind, particularly into Friday's session. The Shanghai Composite fell 2.26% to a two-week low, while the Shenzhen Component dropped 3.44%, with both indices down approximately 1.55% for the week. Selling was concentrated in technology and growth names as AI-driven optimism gave way to caution. Renewed trade friction between China and Japan over tungsten and rare earth export restrictions added to the negative sentiment. For context on how China steel demand dynamics feed into these broader pressures, the picture remains similarly cautious.
For Australian equity investors, China's weakness matters enormously. China remains Australia's largest export market by a considerable margin, and deteriorating Chinese demand signals translate directly into earnings risk for the ASX Materials and Resources sectors.
The next major ASX story will hit our subscribers first
Commodities Under Pressure: Gold, Oil and the AUD Dynamic
Commodity markets were broadly weak throughout the week, and this weakness was a principal source of pressure on the resource-heavy ASX. Consequently, the relationship between gold and mining equities remained under scrutiny as investors weighed the metal's pullback against sector-specific positioning.
Gold declined from above US$4,100/oz to approximately US$4,000/oz, representing a weekly loss of roughly 5% and touching an intraday eight-month low at one point. The mechanics are straightforward: higher-for-longer US interest rates increase the opportunity cost of holding a zero-yield asset like gold, while a strengthening USD makes the metal more expensive for buyers in other currencies. Both forces are fundamentally bearish for the gold price.
Friday's outperformance by ASX gold producers despite the metal's pullback was a notable divergence, illustrating how short-covering and stock-specific positioning can temporarily disconnect equity performance from commodity fundamentals.
Crude oil extended its decline below US$71/barrel, marking a third consecutive weekly fall and unwinding much of the geopolitical risk premium that had built up earlier in the year. Growing market confidence in the US-Iran diplomatic process, a temporary US waiver on Iranian crude exports, improved tanker flows through the Strait of Hormuz, and recovering Middle East export volumes have collectively relieved supply-side anxiety.
Lower oil prices create a dual dynamic for Australia: they weigh on energy sector earnings while simultaneously easing domestic fuel costs, providing a disinflationary input that feeds directly back into the RBA's policy calculations.
The Structural Metals Cycle: Why ASX Materials May Be at an Inflection Point
Beyond the week's tactical noise, a more significant multi-year structural case is building across the ASX materials complex. The convergence of AI data centre buildout, grid-scale electrification, and years of chronic underinvestment across the global mining sector is creating demand-supply imbalances in copper market trends, zinc, manganese, and rare earths that are unlikely to resolve quickly.
A rarely discussed but critically important data point underpins this thesis: the top five global mining companies collectively represent approximately 0.4% of the MSCI All Country World Index, compared to approximately 16.8% for the top five technology companies. This extreme underrepresentation means that institutional reallocation toward materials requires only a modest shift in asset allocation frameworks to generate disproportionate price appreciation in mining equities.
Key ASX Structural Metals Positions
| Company | Commodity Exposure | Key Near-Term Catalyst | Key Financial Metric |
|---|---|---|---|
| Sandfire Resources (SFR) | Copper (Spain, Botswana) | Motheo A1 maiden reserve; 23 July production update | 149-165kt CuEq FY26 target; net cash US$76m; +79% YTD |
| Capstone Copper (CSC) | Diversified Americas copper | 30 July earnings | Six consecutive quarters of record adjusted EBITDA; US$329m Q1; +64% YTD |
| South32 (S32) | Copper, zinc, manganese, alumina | Hermosa Final Record of Decision (July 2026) | Consensus fair value ~$4.67-$4.72 |
| Lynas Rare Earths (LYC) | NdPr rare earths | 23 July quarterly update | H1 FY26 revenue +63% to $413.7m; margins at 19% |
| Pilbara Minerals (PLS) | Lithium spodumene | Ngungaju restart (~200kt, early July) | Record 232,400t March quarter; FOB costs $520/t; $1.455b cash |
Lynas Rare Earths (LYC) deserves particular attention in the context of current geopolitical dynamics. As the largest rare earths producer operating outside China, Lynas occupies an increasingly strategic position in global critical mineral supply chains. The ongoing China-Japan trade friction over tungsten and rare earth export restrictions highlights exactly why ex-China rare earth production capacity commands a structural premium. Lynas's H1 FY26 revenue grew 63% to $413.7 million, with operating margins expanding to 19% on stronger neodymium-praseodymium (NdPr) pricing.
Pilbara Minerals (PLS) presents a study in the distinction between operational quality and near-term equity performance. The company delivered record March quarter output of 232,400 tonnes, reduced free-on-board costs to $520/t, maintains a substantial cash buffer of $1.455 billion, and has locked in a US$1,000/t SC6 floor price via its Canmax offtake agreement, providing meaningful downside protection against further lithium spot price weakness. Despite these operational achievements, the stock fell 6.4% to $5.03 during the week.
Capstone Copper (CSC) is a higher-beta complement to Sandfire's more concentrated copper exposure, with diversified Americas operations spanning Arizona, Mexico, and Chile. Six consecutive quarters of record adjusted EBITDA, culminating in US$329 million for Q1, represent an extraordinary operational streak. The ASX weekly wrap: narrow leadership, sticky core inflation and weak Aussie themes are equally reflected in how high-conviction names like Capstone attract capital even as broader market breadth deteriorates.
ASX 200 Outlook: Scenario Framework for H2 2026
| Scenario | Trigger Conditions | ASX 200 Range Implication |
|---|---|---|
| Bull Case | Core inflation moderates convincingly; Fed pauses; AUD recovers; China stabilises | Break above 9,000 resistance |
| Base Case | Inflation remains sticky; RBA holds; index consolidates; stock-specific leadership | Range-bound 8,700-9,000 |
| Bear Case | Fed hikes again; AUD falls further; China demand deteriorates; commodities extend decline | Test of 8,700 support and below |
The base case appears most probable given current macro dynamics. Softer headline inflation, a strong labour market, rebounding household spending, and easing bond yields collectively point to a domestic economy that is slowing but not contracting. Against that stability, sticky core inflation, a structurally weak currency, a hawkish Fed, and soft Chinese demand continue to warrant measured caution.
Four macro variables warrant the closest monitoring heading into the second half of 2026:
- The US Federal Reserve rate path and the direction of the USD, which remain the most powerful external variables influencing AUD-denominated asset pricing
- Australian trimmed mean inflation trajectory, which will determine whether the RBA holds, hikes, or eventually pivots toward easing
- US-Iran diplomatic developments and their flow-through to global oil prices and Australian energy sector earnings
- Chinese demand signals, including fiscal policy direction, technology sector sentiment, and commodity import data, which drive the near-term earnings cycle for ASX Materials
In a low-volatility, narrow-breadth market environment, the risk-adjusted return opportunity increasingly lies in thematic sector selection rather than broad index exposure. Gold producers and quality growth names continue attracting capital, while rate-sensitive financials, lithium equities, and biotech remain structurally challenged until the macro backdrop shifts decisively.
Until greater clarity emerges across these key variables, the ASX weekly wrap: narrow leadership, sticky core inflation and weak Aussie dynamic is likely to persist, with the ASX 200 trading the 8,700 to 9,000 range and rewarding investors who prioritise stock-specific stories and thematic discipline over those simply buying market beta.
This article is intended for informational purposes only and does not constitute financial product advice. Past performance is not indicative of future results. Readers should consider their own financial circumstances and consult a licensed financial adviser before making any investment decisions. All figures cited reflect data available at the time of writing and may have changed subsequent to publication.
Want to Stay Ahead of the Next Major ASX Mineral Discovery?
While navigating narrow market breadth and sticky inflation requires disciplined stock selection, Discovery Alert's proprietary Discovery IQ model delivers real-time notifications on significant ASX mineral discoveries — instantly cutting through complex data to surface actionable opportunities the moment they emerge. Explore historic examples of exceptional discovery returns and begin your 14-day free trial at Discovery Alert to position yourself ahead of the market.