August 11, 2026
The Geological Foundations Behind Australia's $180 Billion Energy Export Machine
Few economic narratives are as geologically determined as Australia's. The continent sits atop one of the world's most extraordinary concentrations of sedimentary basins, ancient cratonic geology, and thermally stable rock formations — a combination that has produced hydrocarbon deposits, coal seams, and uranium mineralisation of exceptional scale. Understanding why Australia generates $180 billion annually from Australia energy resources export earnings requires looking beneath the surface, quite literally, at the structural endowments that make this output possible and the market forces that translate geological abundance into sovereign wealth.
When big ASX news breaks, our subscribers know first
A $180 Billion Sector in Context: What Australia's Energy Export Earnings Actually Represent
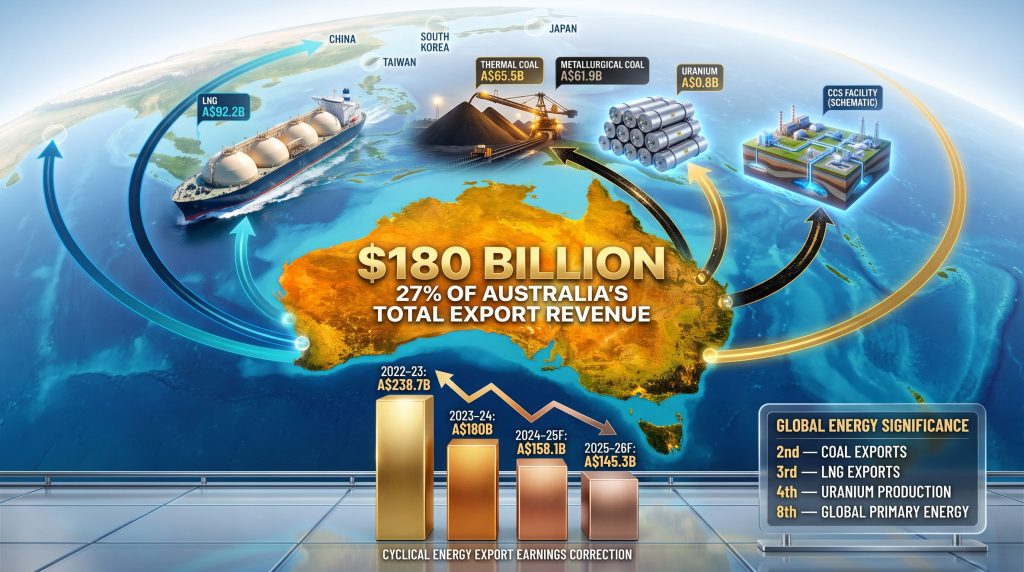
Australia's resource and energy exports of $180 billion in 2023–24 were not an accident of timing or a lucky commodity cycle. They reflect decades of infrastructure investment, geological exploration, and trade relationship development with energy-hungry Asian economies. According to Geoscience Australia's Australia's Energy Commodity Resources (AECR) 2026 publication, this figure equates to roughly 27% of Australia's total export revenue — a concentration of income in a single commodity category that has few equivalents among advanced economies.
To contextualise this, the United Kingdom's entire goods export base generates roughly the same order of magnitude. For a country of approximately 26 million people, sustaining this level of resource export throughput represents a structural economic advantage that is both a strength and a source of long-term vulnerability.
Export Earnings Across the Commodity Cycle: A Five-Year View
| Financial Year | Energy Export Earnings (A$) | Key Driver |
|---|---|---|
| 2021–22 | ~A$180B (estimated) | Post-COVID demand recovery |
| 2022–23 | A$238.7 billion | LNG price spike, thermal coal boom |
| 2023–24 | A$180 billion | Commodity price normalisation |
| 2024–25 (forecast) | A$158.1 billion | Softening LNG and coal pricing |
| 2025–26 (forecast) | A$145.3 billion | Energy transition structural pressures |
Sources: Geoscience Australia AECR 2026; Department of Industry, Science and Resources
The trajectory from peak to normalisation tells its own story. The $238.7 billion recorded in 2022–23 was driven in large part by a European energy crisis that redirected global LNG demand and pushed spot prices to historic levels. That windfall has since unwound, with forecast earnings pointing toward A$145.3 billion by 2025–26 — a contraction of nearly $93 billion from the peak within three years.
What this cycle illustrates is a fundamental truth about resource economies: the underlying geology does not change, but the revenue it generates is hostage to global pricing conditions that lie entirely outside domestic control.
Where Australia Sits in the Global Energy Production Hierarchy
According to AECR 2026 data, Australia ranked as the eighth-largest primary energy producer globally in 2024, accounting for 2.7% of world energy commodity output. For context, this is achieved with a population that represents just 0.3% of the world's total — making Australia one of the most energy-productive nations per capita on the planet.
Australia's Commodity-by-Commodity Global Rankings
| Commodity | Global Ranking | Key Metric |
|---|---|---|
| Coal (exports) | 2nd largest exporter | ~25% of global coal trade |
| LNG (exports) | 3rd largest exporter | Competing with Qatar and the United States |
| Uranium (production) | 4th largest producer | ~33% of known global uranium resources |
| Primary energy production | 8th globally | 2.7% of world energy commodity output |
What these rankings share is a common geological explanation. Australia's coal resources are predominantly located in the Bowen Basin of Queensland and the Hunter Valley of New South Wales — ancient swamp environments that over hundreds of millions of years compressed into some of the world's highest-quality coking and thermal coal deposits.
The nation's LNG reserves trace back to marine sedimentary basins off the northwest coast of Western Australia, whilst uranium mineralisation is concentrated in the Gawler Craton of South Australia and the Athabasca-equivalent formations of Western Australia.
The Uranium Paradox: Fourth in Production, First in Resources
One of the more underappreciated dynamics in Australian energy trade is the gap between uranium production ranking and resource endowment. Australia holds approximately one-third of the world's known uranium resources yet ranks only fourth in annual production. Furthermore, this disparity reflects historical policy constraints — constraints that, as nuclear energy experiences renewed global attention, are increasingly being examined through a fresh economic lens.
The global uranium reserves picture is closely tied to Australia's commercial significance, which extends beyond current revenue of A$0.8 billion. As European nations reconsider nuclear energy timelines, and as Southeast Asian countries begin investing in small modular reactor technology, Australia's uranium endowment could transition from a secondary export category to a strategically material one over the coming decade.
In addition, uranium mining in Western Australia remains a key part of this evolving conversation, as policy and investment decisions in that state will significantly influence how quickly Australia can close the gap between its resource endowment and production output.
Breaking Down the Revenue: What Drives Australia Energy Resources Export Earnings
LNG: The Dominant Revenue Engine
Liquefied Natural Gas is the single largest contributor to Australia's energy export earnings. At its 2022–23 peak of A$92.2 billion, LNG accounted for approximately 38.6% of total energy export revenue — a larger share than either thermal or metallurgical coal individually. Australia's LNG export infrastructure is concentrated across three primary hubs: the Pilbara coast of Western Australia, the Browse Basin offshore facilities, and the Curtis Island export terminal complex in Queensland.
A technical dimension that is often overlooked in mainstream coverage is the distinction between pipeline gas and LNG in Australia's export mix. Because Australia lacks direct pipeline connections to its major Asian markets, virtually all of its natural gas exports require liquefaction at cryogenic temperatures (approximately -162°C), transportation via purpose-built LNG carriers, and regasification at the destination terminal.
This infrastructure-intensive process creates significant capital barriers to entry, which paradoxically also provides existing Australian LNG exporters with a durable competitive moat. The North West Shelf extension is, for instance, a critical example of how Australia is working to sustain this advantage into the future.
Coal's Dual Revenue Streams: A Closer Look
Australia's coal export sector operates across two commercially distinct market segments that respond to different demand drivers:
- Thermal coal (used in electricity generation): Contributed A$65.5 billion in 2022–23. Demand is primarily driven by electricity sector decisions in Japan, South Korea, Taiwan, India, and Southeast Asia. Price is highly sensitive to seasonal weather patterns, competing LNG pricing, and renewable energy capacity additions.
- Metallurgical coal (used in steelmaking via blast furnaces): Contributed A$61.9 billion in 2022–23. Demand is structurally linked to global steel production, which remains overwhelmingly dependent on blast furnace technology. Australia's premium hard coking coal — characterised by low sulphur content, high caking ability, and low ash levels — commands price premiums over lower-grade coking coal from competing origins.
An important technical point for investors and analysts to understand is that metallurgical coal faces a different long-term demand trajectory than thermal coal. Whilst the energy transition is expected to progressively displace thermal coal from electricity systems, the steel sector's transition away from blast furnaces toward electric arc furnace (EAF) technology is considerably slower and more capital-intensive.
This creates a bifurcated timeline within coal itself — thermal coal facing earlier displacement pressure whilst premium metallurgical coal retains demand durability into the 2030s and potentially beyond.
The combined value of thermal and metallurgical coal exports reached A$127 billion at the 2022–23 peak — underscoring that despite the energy transition narrative, coal remains the backbone of Australia's energy trade balance in the near to medium term.
The 8:1 Export-to-Import Ratio: What It Means for the Economy
Australia exports approximately eight times more energy than it imports — a ratio that distinguishes it from virtually every other major developed economy. This structural surplus has several important macroeconomic implications:
- Currency linkage: The Australian dollar is well-documented as a commodity-linked currency. Strong energy export volumes and elevated commodity prices tend to support AUD strength, which simultaneously makes other Australian exports less competitive. This creates a classic resource curse dynamic that policymakers must continuously navigate.
- Fiscal exposure: Commonwealth and state government budgets are materially sensitive to energy commodity price cycles through royalty revenues, corporate tax receipts, and resource levies. The difference between a A$238 billion energy export year and a A$145 billion year translates directly into government fiscal capacity.
- Trade balance mechanics: Energy exports function as the primary structural offset to Australia's persistent deficit in services trade and manufactured goods. Without Australia energy resources export earnings, Australia's current account dynamics would look substantially more challenging.
Private Investment Signals: The $42 Billion Pipeline and the 25% Exploration Surge
Despite the cyclical earnings decline from peak levels, private sector behaviour tells a notably different story about medium-term confidence. Total energy exploration expenditure in Australia reached $1.81 billion in 2024, representing a 25% increase compared to 2023 spending levels. This acceleration in exploration investment is a leading indicator of future production capacity and resource confidence.
Simultaneously, 24 major energy projects with a combined committed value exceeding $42 billion were progressing through development pipelines as of 2024. Together, these signals suggest that private sector participants — with substantially longer investment horizons than commodity markets — view Australia's energy resource base as commercially viable well into the medium-term future.
What a $42 Billion Project Pipeline Delivers
- Near-term additions to LNG, coal, and emerging low-carbon production capacity
- Sustained employment and capital expenditure in resource-dependent regional economies across Western Australia, Queensland, and the Northern Territory
- Continued royalty and corporate tax flows to state and federal governments
- Infrastructure development that creates durable export capacity regardless of short-term price cycles
The next major ASX story will hit our subscribers first
Australia's Low-Carbon Energy Transition: CCS, Hydrogen, and the Geological Advantage
Carbon Capture and Storage: Where Geology Becomes a Strategic Asset
Australia's geological profile creates a structural advantage for carbon capture and storage deployment that is not widely appreciated outside the specialist community. The same large sedimentary basins that host hydrocarbon reserves also possess the porous reservoir rock and impermeable cap rock combinations required for long-term geological CO₂ storage.
Geoscience Australia's AECR 2026 assessment identifies substantial geological storage potential across multiple offshore basins. The current CCS landscape in Australia comprises:
- 2 operational CCS projects injecting CO₂ into geological formations
- 17 CCS projects in active development stages
- Ongoing regulatory framework development governing offshore geological storage, with increasing alignment between state and federal policy environments
What is less commonly understood is the technical challenge of CCS at scale. Geological storage sites require extensive characterisation to confirm that cap rock integrity is sufficient to prevent CO₂ migration over geological timeframes. Australia's offshore basins, particularly those in the Browse and Carnarvon regions, have been extensively studied through decades of oil and gas exploration, providing a data advantage that is not available in many competing CCS jurisdictions.
Hydrogen: The Long-Duration Transition Play
Australia's renewable hydrogen sector is progressing through the transition from pilot-scale demonstration to larger proof-of-concept operations. This progression matters because the energy and cost economics of hydrogen production change significantly at scale. The pathway from demonstration-scale to commercially viable export volumes, however, involves solving several interconnected challenges:
- Reducing the cost of green hydrogen production below the threshold at which Asian industrial customers will substitute it for fossil-fuel alternatives
- Developing purpose-built hydrogen carrier technologies (including liquid hydrogen, ammonia, and methylcyclohexane) capable of transporting hydrogen from Australian production sites to Asian demand centres
- Establishing the port infrastructure, regulatory frameworks, and bilateral trade agreements required to operationalise export volumes
Furthermore, critical minerals demand is increasingly shaping the broader low-carbon transition, adding another dimension to Australia's evolving energy export mix beyond fossil fuels and hydrogen alone.
Key Risks to Australia's Energy Export Earnings Outlook
Commodity Price Volatility Remains the Dominant Near-Term Risk
The earnings trajectory from A$238.7 billion in 2022–23 to a forecast A$145.3 billion in 2025–26 demonstrates with uncomfortable clarity how exposed Australia's revenue base remains to pricing cycles it cannot control. The primary drivers of this contraction include:
- Normalisation of LNG spot prices as European energy security concerns eased and alternative supply sources came online
- Softening thermal coal demand as renewable energy capacity expanded across key Asian importing markets
- Moderated metallurgical coal pricing as Chinese steel production growth slowed
Trade Concentration Risk: A Structural Vulnerability
Australia's energy export earnings are concentrated among a small cluster of trading partners — Japan, South Korea, China, and Taiwan collectively account for the overwhelming majority of LNG and coal export volumes. This geographic concentration creates bilateral relationship risk that became starkly visible during the Australia-China trade tensions of 2020–2022, when Chinese restrictions on Australian coal imports forced rapid market redirection.
The Structural Demand Transition: A Medium to Long-Term Challenge
The long-term risk for Australia energy resources export earnings is not a price cycle — it is structural demand displacement. As Asian economies accelerate renewable energy deployment and as their own energy transition policies mature, the volume demand for thermal coal and eventually LNG will come under sustained pressure.
The timing and pace of this transition will determine whether Australia can develop credible low-carbon energy export categories at sufficient scale to partially replace fossil fuel revenue. Based on current development trajectories, that substitution is unlikely to be complete within a 10-year horizon — creating a potential revenue gap that represents the central long-term challenge for Australian energy trade policy. The IEA's country profile for Australia provides further context on how these energy mix dynamics are assessed at the international level.
Three Scenarios for Australian Energy Export Earnings to 2030
| Scenario | Key Assumptions | Estimated 2030 Earnings Range |
|---|---|---|
| Managed Transition (Base) | Gradual coal/LNG decline, uranium growth, early hydrogen contribution | A$130–150 billion |
| Extended Fossil Demand (Upside) | Asian energy security demand persists, nuclear expansion drives uranium | A$180–200 billion |
| Accelerated Transition (Downside) | Faster renewable deployment, low-carbon exports fail to scale | A$100–120 billion |
Note: These scenarios are speculative projections for analytical purposes only and should not be treated as forecasts or investment advice. Actual outcomes will depend on global energy markets, policy developments, and technological trajectories that remain highly uncertain.
Australia's position as a top-10 global energy producer is not guaranteed beyond 2030. Maintaining it will require the same long-term investment discipline and geological expertise that built the current export base — applied now to an entirely different set of energy commodities.
Frequently Asked Questions: Australia Energy Resources Export Earnings
How much did Australia earn from energy exports in 2023–24?
Australia's energy resources sector generated $180 billion in export earnings in 2023–24, representing approximately 27% of total national export revenue, according to Geoscience Australia's AECR 2026 publication.
What percentage of global energy production does Australia account for?
Australia produced 2.7% of global energy commodity output in 2024, ranking eighth among all nations for primary energy production.
What is Australia's largest energy export by value?
LNG is Australia's largest energy export category by value, reaching A$92.2 billion at its 2022–23 peak and representing approximately 38.6% of total energy export earnings in that year.
Why does Australia hold so much of the world's uranium but rank only fourth in production?
Australia holds approximately one-third of global known uranium resources but has historically produced less than its endowment would suggest due to policy restrictions and limited mine development. As nuclear energy attracts renewed international interest, this gap between resource endowment and production represents a potential medium-term opportunity.
Is private sector investment in Australian energy growing?
Energy exploration expenditure reached $1.81 billion in 2024, a 25% increase on the prior year, with 24 major projects worth over $42 billion at committed development stage — suggesting sustained private sector confidence in the sector's medium-term viability.
What low-carbon energy technologies is Australia developing?
Australia is actively advancing carbon capture and storage (2 projects operational, 17 in development) and renewable hydrogen (progressing from pilot to demonstration scale), both underpinned by the country's geological storage potential and renewable energy resources.
For primary data and further analysis, Geoscience Australia's official Australia's Energy Commodity Resources (AECR) 2026 publication is available at ga.gov.au. Ongoing sector coverage is available through Australian Mining. This article contains forward-looking scenario analysis and should not be construed as financial or investment advice.
Want To Capitalise On The Next Major ASX Mineral Discovery Before The Broader Market?
Australia's extraordinary geological endowment drives not only its $180 billion energy export machine, but also a continuous pipeline of significant mineral discoveries across its ancient cratons and sedimentary basins — and Discovery Alert's proprietary Discovery IQ model instantly identifies these high-potential ASX announcements the moment they are made, turning complex mineral data into actionable insights for both short-term traders and long-term investors. Explore historic examples of exceptional discovery returns and begin your 14-day free trial today to position yourself ahead of the market.