August 11, 2026
The Geography of Vulnerability: Why a 21-Mile Corridor Holds the World's Energy System Hostage
Most infrastructure failures announce themselves gradually. Pipelines corrode over decades. Grids degrade through underinvestment. But chokepoint crises arrive without warning and compound without mercy. The Strait of Hormuz shipping disruption that escalated through mid-2026 did not merely stress test global energy markets — it exposed a foundational fragility that energy planners, shipping executives, and policymakers had spent years hoping they would never have to confront at full scale.
At its narrowest navigable point, the Strait of Hormuz measures just 21 miles across. Yet through this sliver of water flows approximately 17 to 21 million barrels of crude oil and petroleum products every single day under normal operating conditions — representing roughly one-fifth of global oil consumption. Add the substantial portion of global LNG supply that also transits the Strait, and the concentration of systemic risk becomes almost difficult to comprehend. No pipeline network, no alternative maritime corridor, and no combination of rerouting strategies comes close to replicating what the Strait moves on an ordinary Tuesday.
This is not a new vulnerability. However, its severity has intensified as Asian energy demand has grown dramatically over the past two decades. The share of Hormuz-transiting oil bound for East and South Asian markets now dominates the flow, meaning that any disruption to the Strait functions as a direct supply shock to the world's fastest-growing economies. The chokepoint's strategic importance has not diminished with time — it has deepened.
When big ASX news breaks, our subscribers know first
From 140 Ships to 3: How Quickly the Strait Collapsed
Charting the Collapse in Transit Volumes
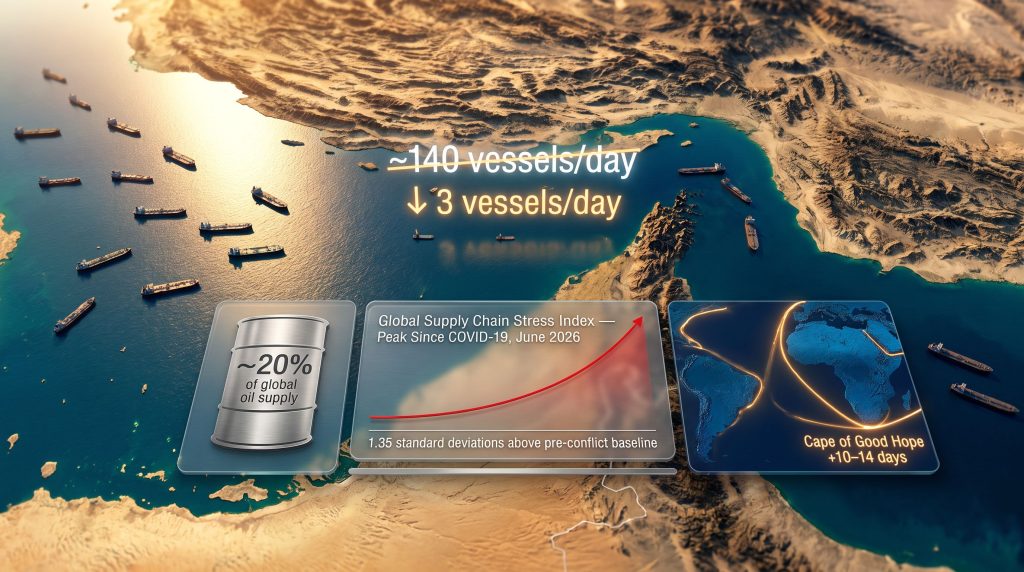
Under normal pre-conflict conditions, approximately 140 vessels transited the Strait of Hormuz daily — a relentless procession of tankers, bulk carriers, and LNG vessels feeding the world's energy appetite. When military escalation involving Iran, the United States, and Israel intensified in 2026, that number did not decline gradually. It collapsed.
At the initial disruption phase, daily transits fell to as few as 7 ships per 24-hour period — less than 5% of normal throughput. A subsequent escalation event reduced that figure further, with reports confirming as few as 3 commodity vessel crossings in a single day. The arithmetic is stark: at that level, the Strait had effectively ceased to function as a meaningful commercial corridor.
| Disruption Phase | Daily Transit Volume | Estimated Supply Impact |
|---|---|---|
| Pre-conflict baseline | ~140 vessels/day | Normal operations |
| Initial escalation | ~7 vessels/day | ~15-20% global supply reduction |
| Peak disruption | ~3 vessels/day | Near-total regional shutdown |
| Post-peak partial recovery | Partial resumption | Supply stress persists |
The cumulative supply impact was severe. Analysts estimated that global oil supply was reduced by approximately 20% at the height of the crisis — one of the most significant single-chokepoint supply shocks in modern energy history. Furthermore, hundreds of tankers and bulk carriers sat stranded at Persian Gulf anchorages, creating layered congestion that cascaded into cargo backlogs affecting non-energy commodities as well.
What makes this disruption uniquely damaging compared to previous Hormuz tension events is the dual exposure: crude oil and LNG flows were both constrained simultaneously. During the Iran-Iraq Tanker War of the 1980s, LNG was not a material component of Gulf exports. Today it is, which means the 2026 disruption hit energy-importing nations across both their oil and gas supply chains at the same time. For a broader perspective on how these events unfolded, this detailed breakdown of the Hormuz crisis provides essential context.
The Stress Index That Markets Are Ignoring
What 23 Components Are Really Telling Us
UBS senior international economist Pierre Lafourcade has been tracking the bank's proprietary Global Supply Chain Stress Index — a 23-component diagnostic tool designed to capture the breadth and depth of supply chain disruption beyond the simplistic lens of oil prices alone. The findings are sobering.
The index reached its highest level since the COVID-19 pandemic in June 2026. By July, the median component reading had eased by 0.4 standard deviations from June's peak — but at 1.26 standard deviations above the pre-conflict baseline, the index remained deeply stressed. The average reading across all 23 components remained 1.35 standard deviations above February levels, the point before the US-Iran conflict escalated.
UBS analysis indicates that even if a formal agreement to reopen the Strait is implemented, supply chain stress is expected to linger well beyond the diplomatic resolution — a structural lag that markets have historically underpriced in previous chokepoint disruptions.
The most critical insight from the index is not the aggregate reading, but the divergence between components:
- Improving: Air freight costs in July; delivery times across Asia excluding China
- Worsening: Ocean shipping costs across all major benchmarks — Baltic, Harper Petersen, Drewry, and Freightos all moved higher simultaneously
- Worsening: Delivery times in the United States; seaborne oil and gas flow volumes
- Partially recovering: Oil and gas shipping volumes in the Asia region recaptured approximately half of the decline recorded since Strait closure began
- Stable but constrained: Global non-energy cargo shipping volumes remained roughly flat
This divergence matters enormously for interpreting market signals. Oil prices declined by approximately $20 per barrel from the July 23 peak — a move markets interpreted as reflecting optimism around a potential diplomatic resolution. However, that price signal and the underlying supply chain data are telling very different stories. The index confirms that operational normalisation has lagged market sentiment by a considerable and widening margin. Consequently, the oil market disruption caused by these dynamics continues to reverberate well beyond the Strait itself.
Three Scenarios for What Happens Next
Modelling the Path From Crisis to Resolution
The pace and durability of any diplomatic agreement, the speed of fleet repositioning, and the depth of structural damage to shipping confidence and insurance markets will together determine which of three plausible futures materialises.
Scenario 1: Rapid Reopening With Sustained Compliance (Low Probability)
This scenario requires full transit resumption within 30 days of a formal Iran-Oman framework agreement, followed by oil prices retreating toward pre-conflict levels within 60 to 90 days. The supply chain stress index would normalise within one quarter. The preconditions include a verifiable ceasefire, immediate insurance market re-engagement, and rapid tanker repositioning from African rerouting.
The constraint: Iran has publicly stated that the Strait will remain closed until the United States meets six sweeping geopolitical demands — a position that makes rapid full compliance structurally unlikely regardless of diplomatic goodwill from intermediaries.
Scenario 2: Partial Reopening With Persistent Friction (Moderate Probability)
Transit volumes recover to 50 to 70% of the pre-conflict baseline over 60 to 90 days. Brent crude stabilises in the $80 to $90 per barrel range as the risk premium partially unwinds. Shipping costs remain elevated for three to six months as fleet repositioning lags and insurance premiums stay high. The supply chain stress index remains 0.5 to 0.9 standard deviations above pre-conflict baseline through Q4 2026, with ongoing vessel attack risk sustaining war risk insurance surcharges.
Scenario 3: Prolonged Disruption With Structural Rerouting (Elevated Risk)
Transit volumes remain severely constrained beyond 90 days. Global energy markets price in a sustained geopolitical risk premium of $10 to $20 per barrel above fundamental value. Bank of America analysis underscores the severity: stabilising oil market flows through the Strait would require approximately 10 times the current number of available escort and support vessels — a logistical impossibility in the near term. Inflationary knock-on effects intensify across energy-importing economies, particularly in South and Southeast Asia, where clean energy transition ambitions become increasingly difficult to maintain against a backdrop of acute energy security stress.
Who Bears the Heaviest Economic Burden
Asia's Structural Import Dependency Creates Asymmetric Risk
The economic exposure to the Strait of Hormuz shipping disruption is not evenly distributed. The asymmetry runs sharply in one direction: toward Asian energy importers.
India sits at the extreme end of this exposure. With approximately 90% of domestic oil demand met through imports, Indian refiners have been forced to accelerate procurement from West African suppliers — particularly Nigeria and Angola — as an emergency diversification strategy. India is also evaluating a $42 billion domestic fuel reserve plan, a policy initiative that has gained considerable urgency directly as a result of the disruption.
China recorded a historic slump in crude import volumes in June before a partial recovery in July. China's top refiners have pivoted toward Russian crude to partially offset Persian Gulf supply constraints, while LNG exposure continues to weigh on the country's broader energy cost structure.
Japan and South Korea maintain strategic petroleum reserves but face acute LNG vulnerability given the Strait's role in global gas trade. Both nations are price-takers in the Asian LNG spot market, meaning elevated gas prices feed directly into industrial and residential energy costs.
The Gulf Producers' Paradox
The disruption has, furthermore, damaged the producers themselves. ADNOC reported 15 vessel attacks on its shipping operations during the conflict period — a figure that reflects both the physical danger and the actuarial basis for surging war risk insurance premiums. In response, ADNOC committed approximately $1.3 billion to acquire 11 supertankers, one of the largest single vessel procurement decisions by a national energy company in recent years.
Saudi Aramco, meanwhile, deepened its Asia-bound crude oil discount ahead of a potential Hormuz agreement, reflecting the competitive market share that alternative suppliers gained during the disruption. The UAE's Abu Dhabi Crude Oil Pipeline (ADCOP) provides partial land-based export capacity that bypasses the Strait, but its throughput ceiling limits how much volume can realistically be redirected. Kuwait and Iraq possess no meaningful pipeline bypass capacity at all, leaving their export revenues entirely hostage to Strait access.
Five Channels Through Which the Economic Damage Transmits
The financial cost of the Strait of Hormuz shipping disruption extends well beyond the crude oil price headline. In addition to headline energy costs, five distinct transmission channels are simultaneously active:
1. Energy Price Inflation
Brent crude trading near $85 to $88 per barrel during peak disruption carried a significant premium above pre-conflict fundamentals. Natural gas and LNG spot prices rose across Asian import markets, with downstream fuel cost increases rippling through transportation, manufacturing, and agriculture. The resulting oil price shock has reverberated far beyond the Gulf region.
2. Freight and Logistics Cost Escalation
Ocean shipping rates rose across all major benchmark indices simultaneously. Cape of Good Hope rerouting adds approximately 10 to 14 days to voyage times between the Persian Gulf and major Asian destinations, compounding both cost and delivery time pressures across every cargo category.
3. Insurance Market Disruption
War risk insurance premiums surged for vessels transiting or planning to transit the Strait. Multiple major carriers suspended Hormuz crossings entirely following insurance coverage cancellations. ADNOC's 15 reported vessel attacks provide the actuarial justification for premiums that remain structurally elevated even as diplomatic negotiations progress. Shipping disruptions following tanker attacks have deepened the crisis further, according to regional reporting.
4. Inventory Depletion and Supply Security Costs
Strategic petroleum reserve drawdowns accelerated across multiple consuming nations. Refinery throughput adjustments became necessary as feedstock availability grew unpredictable, with some facilities operating below optimal utilisation rates.
5. Inflationary Persistence Beyond Resolution
UBS modelling confirms that supply chain stress will persist for months after any Strait reopening. Inventory rebuilding cycles, fleet repositioning costs, and insurance premium normalisation all operate on longer timescales than diplomatic agreements — creating a structural lag between political resolution and economic relief that markets are currently underweighting. This pattern is consistent with the broader commodity market volatility observed across global trade in 2025 and 2026.
The next major ASX story will hit our subscribers first
Monitoring the Road to Recovery: What to Watch
Leading Indicators of Genuine Normalisation
For analysts, traders, and energy security professionals tracking the Strait of Hormuz shipping disruption, the following indicators represent the most reliable early signals of genuine recovery:
- Daily transit vessel counts returning toward 80 or more ships per day from the 3 to 7 range recorded at peak disruption
- War risk insurance premiums declining materially across major underwriters
- UBS Global Supply Chain Stress Index median reading falling below 0.5 standard deviations above the pre-conflict baseline
- Tanker fleet repositioning away from Cape of Good Hope routing back toward Hormuz transit lanes
- Brent crude sustained below $80 per barrel without corresponding OPEC+ production changes
Warning Signs of Renewed Escalation
- Additional vessel attack reports in Persian Gulf waters
- Iran hardening or expanding its six-point demand framework
- Major carrier suspensions of Hormuz transits expanding beyond current operators
- Strategic petroleum reserve drawdowns accelerating in Japan, South Korea, or India
- Shipping cost indices resuming their upward trajectory after July's partial relief
The longer the disruption persists, the more likely it becomes that structural changes to global shipping patterns, energy procurement strategies, and infrastructure investment decisions grow self-reinforcing. The economic consequences of the Hormuz crisis will outlast any diplomatic resolution by a margin that markets are not yet pricing correctly.
Frequently Asked Questions: Strait of Hormuz Shipping Disruption
What percentage of global oil supply passes through the Strait of Hormuz?
Under normal operating conditions, the Strait handles approximately 17 to 21 million barrels per day of crude oil and petroleum products, representing roughly 20 to 21% of global oil consumption and a significant share of global LNG trade.
How severe was the 2026 Hormuz shipping disruption?
At peak disruption, daily vessel transits collapsed from approximately 140 ships per day to as few as 3 vessels — a reduction exceeding 97% from normal throughput. Analysts estimated global oil supply was reduced by approximately 20% at the height of the crisis.
Why can't ships simply reroute around the Strait of Hormuz?
Alternative routing via the Cape of Good Hope adds approximately 10 to 14 days to voyage times between the Persian Gulf and major Asian import destinations. Bank of America analysis indicated that stabilising oil market flows through alternative means would require approximately 10 times more vessels than are currently available. In addition, 34,000 shipping routes were diverted as a direct consequence of the Hormuz disruption, illustrating the sheer scale of the rerouting challenge.
When will global supply chains fully recover from the Hormuz disruption?
Even after a formal diplomatic agreement is implemented, supply chain stress is expected to persist for months. The UBS average stress reading remained 1.35 standard deviations above pre-conflict levels in July 2026. Fleet repositioning, inventory rebuilding, and insurance market re-engagement all operate on timescales that exceed diplomatic resolution timelines.
Which countries are most economically exposed to Hormuz disruption?
India (approximately 90% import-dependent for oil), Japan, South Korea, and China face the highest exposure. European nations face secondary exposure through LNG price contagion and freight cost escalation. Furthermore, geopolitical trade tensions have compounded the vulnerability of these nations considerably.
What is Iran's stated position on reopening the Strait?
Iran has publicly stated that the Strait will remain closed until the United States meets six sweeping geopolitical demands — a position that significantly complicates near-term diplomatic resolution despite ongoing Iran-Oman mediation efforts, including a draft agreement reportedly awaiting approval from Iran's supreme leadership.
The Structural Lesson the Crisis Has Already Taught
The 2026 Strait of Hormuz shipping disruption is not simply a geopolitical event that markets will eventually price out. It is a systemic stress test that has already begun reshaping infrastructure investment decisions, energy procurement strategies, and national security calculations across three continents. Supply chain stress metrics confirm that market optimism — reflected in the approximately $20 per barrel oil price decline from the July peak — has significantly outpaced actual operational normalisation.
The gap between diplomatic progress and supply chain recovery is real, measurable, and consequential. Tanker attack risk, insurance market dislocation, fleet repositioning lag, and the structural complexity of Iran's political preconditions together ensure that the economic consequences of this crisis will persist well beyond any formal agreement. For energy-importing nations, the disruption has permanently accelerated the timeline for emergency reserve expansion, supplier diversification, and alternative routing infrastructure investment.
When a single 21-mile navigable corridor controls one-fifth of global oil supply, the cost of geopolitical miscalculation is not measured in days. It is measured in quarters of sustained economic disruption across every sector of the global economy — and the full accounting for this crisis is still being written.
This article is for informational purposes only and does not constitute financial, investment, or trading advice. Scenario projections and supply chain stress estimates involve forward-looking assumptions subject to material uncertainty. Readers should consult qualified professionals before making investment or procurement decisions based on geopolitical risk assessments.
Want to Stay Ahead of the Market Disruptions Reshaping Commodity Supply Chains?
Discovery Alert's proprietary Discovery IQ model delivers real-time alerts on significant ASX mineral discoveries, instantly translating complex commodity and resource data into actionable investment insights — ensuring subscribers are positioned ahead of broader market movements driven by events like the Hormuz crisis. Explore historic discoveries and their exceptional returns, then begin your 14-day free trial to secure a market-leading edge.