July 18, 2026
Why Inflation Is Harder to Kill Than Most Investors Expect
The popular narrative around inflation tends to follow a reassuringly simple arc: central banks raise rates, demand cools, prices fall back into line. But that model assumes inflation is primarily a demand-side phenomenon, one that responds predictably to monetary tightening. The Australia inflation and interest rates outlook for 2026 and 2027 tells a far more complicated story, one where the underlying drivers are structural, entrenched, and in some cases self-reinforcing.
Understanding what is really happening inside Australia's price system, and why it matters for investors, businesses, and policymakers, requires looking beyond the headline numbers. Furthermore, the interplay between tariffs and investment markets adds another layer of complexity to an already difficult policy environment.
When big ASX news breaks, our subscribers know first
The Deceptive Comfort of Falling Headline Numbers
Headline CPI Versus Trimmed Mean: The Metric That Actually Matters
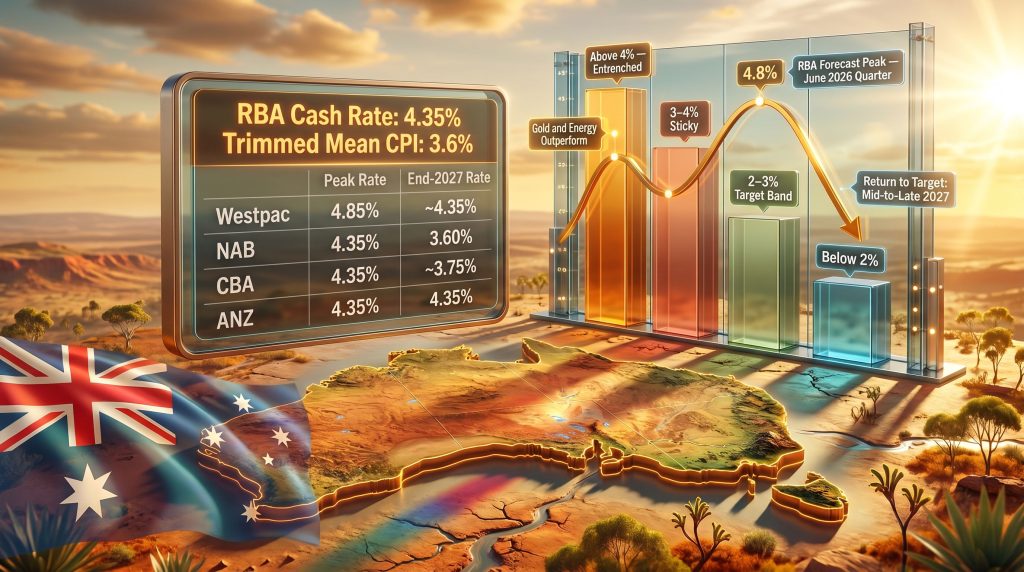
Australia's headline CPI printed at 4.0% in May 2026, a modest improvement from the 4.2% recorded in April. On the surface, this looks like progress. However, headline inflation is heavily influenced by energy prices, which are volatile and can swing dramatically based on geopolitical events, none of which reflect the deeper pricing behaviour embedded in the economy.
The more closely watched measure for the Reserve Bank of Australia is trimmed mean inflation, which strips out the most extreme price movements in either direction. In May 2026, trimmed mean CPI sat at 3.6%, the highest reading since September 2024. That figure is not moving in a reassuring direction.
| Metric | Reading |
|---|---|
| Headline CPI (May 2026) | 4.0% |
| Trimmed Mean CPI (May 2026) | 3.6% |
| RBA Forecast Headline Peak | 4.8% (June 2026 quarter) |
| Projected Return to Target | Mid-to-late 2027 |
| Consumer Inflation Expectations (June 2026) | 5.5% |
The RBA's own forecast has headline inflation peaking at 4.8% during the June 2026 quarter, with underlying inflation projected to remain above 3% until at least mid-2027. These are not minor overshoots. They represent a prolonged period of above-target price growth with no clear short-term resolution.
Australia's Inflation Is Different From the Global Cycle
Most developed economies saw inflation peak in 2022 and 2023 before trending sustainably lower. Australia's experience has diverged from that pattern in important ways.
Domestic inflation emerged and persisted even as economic growth slowed to approximately 1.75% GDP. This reveals something economists describe as a low-productivity inflation trap: the economy's speed limit — the maximum rate at which it can grow without generating inflationary pressure — has materially declined. In the pre-pandemic era, Australia could sustain GDP growth in the high twos without triggering domestic inflation. Today, growth barely above 1.5 to 2% is already doing exactly that.
This creates an uncomfortable policy dilemma. Either accept below-trend growth, which at current population growth rates amounts to a per capita contraction, or tolerate structurally higher inflation and the political instability that accompanies declining living standards. Neither option is comfortable, and both are already playing out simultaneously.
The RBA's Current Position and Why It Paused
Cash Rate Snapshot: June 2026
The RBA cash rate stands at 4.35%, effective from June 17, 2026, following three rate increases delivered earlier in the year. The June 2026 board meeting produced a hold decision, a pause that all four major Australian banks anticipated.
The reasoning behind the pause is nuanced. Consumer sentiment in the wake of the federal budget fell to levels not seen since March 2020, a reading that many economists regard as an overreaction to fiscal settings rather than a genuine signal of economic collapse. The RBA is carefully weighing near-term demand softness against the more durable risk of entrenched inflation expectations.
RBA Assistant Governor Sarah Hunter noted that if inflation expectations drift upward, the Board may need to tighten further or accept a sharper economic slowdown to re-anchor them, according to publicly available RBA communications.
The Big Four Forecasts: Where the Banks Stand
The four major Australian banks offer meaningfully different views on where rates go from here, reflecting genuine uncertainty about the inflation trajectory.
| Bank | Next Move | Rate Peak | First Cut | Rate at End-2027 |
|---|---|---|---|---|
| Westpac | Two further hikes (Aug and Sep 2026) | 4.85% | Late 2027 | ~4.35% |
| NAB | Hold, then cut | 4.35% | Early 2027 | 3.60% |
| CBA | Hold, then cut | 4.35% | Early 2027 | ~3.75% |
| ANZ | Hold throughout | 4.35% | No cuts projected | 4.35% |
The most hawkish view, held by Westpac, sees two further hikes bringing rates to a peak of 4.85% before any easing begins. The most dovish view, from NAB, has rates falling to 3.60% by end-2027. This is an unusually wide dispersion among institutions that all have access to the same economic data, which itself tells investors something important about the genuine uncertainty in the system.
The Four Structural Drivers Keeping Inflation Elevated
Wage Growth Outpacing Productivity
The Fair Work Commission's most recent minimum wage determination, when including youth wage adjustments, implies an effective increase of approximately 5.2%. In an environment where productivity growth is near zero, wage increases of this magnitude flow almost directly into prices.
Labour costs represent close to 50% of total costs for many Australian industrial and mining operators. For companies competing globally, including gold miners competing against South American and African peers, this cost escalation is a direct competitiveness problem. Consequently, when wage costs rise faster in Australia than in peer jurisdictions, the relative attractiveness of Australian operations declines.
Energy Prices: A Permanent Repricing, Not a Temporary Shock
The RBA's May 2026 revised baseline incorporated scenarios around prolonged Middle East conflict. The worst-case projection sees headline CPI reaching 5.2%, with trimmed mean inflation elevated for at least three years.
Critically, when examining the oil forward curve rather than just spot prices, energy is approximately $7 USD per barrel higher than pre-conflict levels on contracts stretching 10 to 15 years out. This is not a temporary disruption priced into near-term contracts. It is, in fact, a permanent repricing of Australia's cost base embedded into long-dated energy markets.
Inflation Psychology: The Pass-Through Problem
One of the most underappreciated structural shifts in the current cycle is the change in business pricing behaviour. Post-2022, Australian firms became comfortable passing cost increases to consumers rapidly and in larger increments than historical norms.
Real-world examples of this accelerating pass-through include:
- Construction materials firms announcing multiple sequential price increases within weeks of each other
- Fuel surcharges appearing on everyday consumer receipts, including food, beverage, and even airport coffee purchases
- Building industry invoices including fuel surcharge line items that were entirely absent from billing practices five years ago
Consumer acceptance of these increases has reinforced business pricing confidence. This inflation psychology — not just the headline number — is what the RBA must ultimately break, and it is considerably harder to break than a demand-driven price spike.
Pro-Cyclical Government Spending
Federal budget expenditure has expanded at a time when the economy is already operating near its productive capacity. Age care, childcare, healthcare, and population-linked spending are sustaining domestic final demand even as headline GDP growth remains weak. The result is a configuration where strong domestic demand inflation coexists with weak aggregate output growth, a mild stagflationary dynamic that creates genuine policy challenges.
The effective tax rate on small business operations, inclusive of various levies and compliance costs, has reached levels that economists consider deeply counterproductive for entrepreneurial activity and business investment. This, in turn, undermines the very productivity growth that would allow the economy to grow without generating inflationary pressure.
Is Australia Approaching Stagflation?
The Growth-Inflation Bind
When an economy generates domestic inflation at GDP growth rates of just 1.75%, it faces a structural constraint. It cannot accelerate without overheating, and it cannot slow without risking per capita income contraction. Australia is navigating exactly this bind.
Per capita GDP growth is effectively negative at current population growth rates near that threshold. Standard of living pressure is already feeding into political volatility, with fringe parties recording polling numbers not seen in decades. The RBA, consequently, faces a narrower corridor than most peer central banks.
The Productivity Imperative
Contributing factors to Australia's declining potential growth rate include:
- Insufficient business investment in technology and process improvement over the prior decade
- Regulatory and industrial relations complexity increasing the cost of doing business
- Under-investment in research and development relative to peer economies
- Industrial relations reforms lifting wage costs above productivity growth in ways that compound over time
There is, however, a genuinely positive signal worth noting. Private business investment in Australia is currently tracking above its peak mining boom levels, driven partly by data centre construction and broader technology adoption. Business credit data confirms this is not confined to data centres but extends to software spending, IT investment, and general technology adoption across the economy.
If this investment wave translates into measurable productivity gains, it could gradually lift Australia's non-inflationary growth speed limit. That is not guaranteed, but it represents the most credible near-term mechanism for resolving the growth-inflation bind without either a recession or entrenched above-target inflation.
Global Context: The End of the Easing Cycle
Central Bank Pivots Around the World
As of mid-2026, the global monetary easing cycle that began in 2024 is broadly considered complete. This has significant implications for Australia's own rate path.
- The European Central Bank reversed course and raised rates, with further increases projected
- The Bank of Japan is expected to hike in the near term, ending years of ultra-loose policy
- The US Federal Reserve faces persistent inflation with limited growth, making further cuts politically and economically difficult
- The Bank of England is expected to resume hiking in late 2026
The US 10-year Treasury yield has moved from below 4% to approximately 4.5%, the opposite direction to consensus forecasts at the start of 2026. Australian long-end yields are tracking higher in sympathy, compressing equity valuation multiples across the market. These dynamics closely mirror the broader gold and bond dynamics that have shaped institutional portfolio positioning throughout this cycle.
The New Fed Leadership Dynamic
Kevin Walsh's appointment as Fed Chair introduces a policy philosophy historically centred on balance sheet discipline and fiscal responsibility. Near-term political pressure from the White House favours lower rates, but Walsh's documented prior positions suggest a preference for tighter monetary conditions over extended periods.
For Australia, a higher-for-longer stance from the Fed reduces the RBA's room to cut without triggering currency depreciation and imported inflation. The interconnection between US inflation and debt pressures and Australian rate settings is more binding than many domestic commentators acknowledge.
Gold, the US Dollar, and What Central Banks Are Signalling
The US dollar has exhibited a negative correlation with risk assets in recent months, an unusual pattern that historically signals reserve currency stress. De-dollarisation is a multi-decade structural trend rather than a near-term event, and the US retains exceptional structural advantages in energy, capital markets depth, and technological leadership.
However, at the margin, gold during market volatility has demonstrated sustained strength even after a 20 to 25% pullback from its peak, reflecting a structural shift in institutional and central bank reserve allocation. Central banks globally are holding approximately 20% of reserves in gold, a figure well above typical individual investor allocations. This divergence between institutional positioning and retail portfolio construction represents a structural tailwind for gold as a strategic hedge that operates independently of short-term price volatility.
The next major ASX story will hit our subscribers first
What Elevated Rates Mean for Australian Asset Valuations
An Inflation Scenario Framework
| Inflation Scenario | Bond Yield Range | Equity Market Impact | Commodity Impact |
|---|---|---|---|
| Below 2% (deflation risk) | Below 3.5% | Distorted capital allocation | Weak demand signal |
| 2-3% (target band) | 3.5-4.5% | Broadly supportive | Moderate, stable |
| 3-4% (elevated/sticky) | 4.5-5.0% | Multiple compression, value rotation | Positive for real assets |
| Above 4% (entrenched) | Above 5% | Significant correction risk | Gold and energy outperform |
Historical analysis suggests equity markets become increasingly sensitive to bond yields above 5%, the level at which growth expectations begin to be discounted more aggressively. Markets have demonstrated awareness of this threshold, reacting negatively on each occasion the 10-year yield has approached that level.
Sectors Where Value Is Emerging
Parts of the market that have experienced significant de-rating despite stable or improving fundamentals include:
- Healthcare: Major global and Australian names down 50 to 70% from prior peaks, including benchmark stocks that were market darlings as recently as 2022
- Consumer staples and spirits: Trading at 10 to 12 times earnings despite resilient long-term demand characteristics
- European banks: Still valued at 8 to 9 times earnings with high single-digit dividend yields, considered by some fund managers to be in the early innings of a multi-year re-rating cycle similar to Australian banks three decades ago
- Australian industrial businesses: Beginning to re-enter value territory after a prolonged period of elevated valuations driven by passive superannuation flows
The broader observation among experienced investors is that underneath the surface of elevated headline index levels, a remarkable number of individual businesses are trading in the bottom half of their historical valuation ranges. This creates selective opportunity even within a macro environment that warrants caution at the index level.
Rate Cut Scenarios: When Does Relief Arrive?
Three Pathways to 2027
Base Case: First cut in second half of 2027
Inflation returns to the top of the 2 to 3% target band by mid-to-late 2027. Trimmed mean inflation eases to approximately 2.5% by early 2028. The RBA holds rates through 2026 and into 2027, then begins a gradual easing cycle. Consumer inflation expectations, currently at 5.5%, need to moderate meaningfully before cuts are credible.
Bear Case: No cuts through 2027
If the RBA does not deliver one further hike in 2026, the easing cycle may be delayed further. A second external shock before inflation is anchored could push the first cut into 2028, implying an extended period of above-target inflation and near-zero per capita growth.
Bull Case: Cuts begin early 2027
Requires a faster-than-expected decline in trimmed mean inflation, no further energy price shocks, and a moderation in wage growth. NAB's forecast of rates reaching 3.60% by end-2027 reflects this optimistic path. For a broader view of how these rate cut forecasts are tracking, independent analysis continues to evolve alongside shifting economic conditions.
The RBA is most likely to begin cutting interest rates in the second half of 2027, conditional on trimmed mean inflation falling sustainably below 3%. The cash rate is projected to remain at 4.35% through most of 2026, with the possibility of a further hike before any easing begins.
Frequently Asked Questions
What is Australia's current inflation rate in 2026?
Australia's headline CPI was 4.0% in May 2026, down from 4.2% in April. Underlying trimmed mean inflation remains higher at 3.6%, which is the measure most closely watched for RBA policy decisions. For the latest data and official projections, the RBA's inflation outlook provides the most comprehensive breakdown.
What is the RBA cash rate in June 2026?
The RBA cash rate is 4.35%, effective from June 17, 2026, following three rate increases earlier in the year.
Will the RBA cut interest rates in 2027?
Most forecasters expect rate cuts to begin in the second half of 2027, though the timing varies. NAB forecasts rates falling to 3.60% by end-2027, while ANZ projects rates holding at 4.35% through the same period.
Why is Australia's inflation so sticky?
Australia's inflation persistence reflects rising wage costs outpacing productivity growth, energy price increases from geopolitical shocks, government spending adding demand in a capacity-constrained economy, and a structural shift in business pricing behaviour toward faster and larger cost pass-throughs.
What is the RBA's inflation target?
The RBA targets inflation in a 2 to 3% band over the medium term, a slightly wider range than most peer central banks which target 2%. The Australia inflation and interest rates outlook suggests this band will not be reached until mid-to-late 2027.
How does Australia's inflation compare to global peers?
Australia's inflation trajectory has been slower to resolve than many peer economies. While global central banks broadly completed their easing cycles by mid-2026, Australia's domestic inflation dynamics have kept the RBA in a tighter policy stance for longer.
Disclaimer: This article contains forward-looking statements, forecasts, and economic projections sourced from publicly available bank research and central bank communications. These represent estimates only and are subject to significant uncertainty. Nothing in this article constitutes financial advice. Readers should conduct their own independent research and consult a qualified financial adviser before making investment decisions.
Want to Spot the Next Major ASX Mineral Discovery Before the Broader Market Does?
While navigating Australia's complex inflation and interest rate environment, savvy investors are turning to real assets and commodity-linked opportunities — and Discovery Alert's proprietary Discovery IQ model delivers instant, real-time alerts on significant ASX mineral discoveries, transforming complex geological data into actionable investment insights. Explore historic discoveries and their exceptional returns, then begin a 14-day free trial to position ahead of the market.