May 19, 2026

The Strategic Transformation of Australia's Resource-Based Investment Ecosystem
Australia's economic foundation rests heavily on natural resource extraction, with mining operations serving as critical drivers of both export revenues and domestic investment returns. The sector's influence extends far beyond simple commodity production, fundamentally shaping how institutional and retail investors approach portfolio construction within the Australian equity market. ASX 200 mining shares represent some of the most significant investment opportunities, demonstrating remarkable resilience and growth potential across diverse commodity cycles.
The materials sector demonstrates remarkable resilience during periods of broader market uncertainty, often providing defensive characteristics when traditional growth sectors face headwinds. Recent market performance data illustrates this phenomenon clearly, with materials companies outperforming other sectors even as macroeconomic conditions create challenging environments for discretionary spending and technology investments.
When big ASX news breaks, our subscribers know first
What Drives the Materials Sector's Dominance in Australia's Top 200 Index?
Understanding the ASX 200 Mining Universe
The Australian Securities Exchange maintains strict criteria for inclusion within its benchmark ASX 200 index, with mining companies representing approximately 20-25% of the total index weighting based on market capitalisation. This concentration reflects Australia's geological endowments and the scale advantages achieved by companies like BHP Group, Rio Tinto, and Fortescue Metals Group, each maintaining market capitalisations exceeding $50 billion.
Materials sector representation encompasses three primary categories:
• Iron ore and steel production companies
• Precious metals miners focusing on gold and silver extraction
• Base metals operations including copper, zinc, and nickel producers
• Diversified mining conglomerates with multi-commodity exposure
• Coal mining operations serving both metallurgical and thermal markets
The sector's index weighting fluctuates based on commodity price cycles, with iron ore price trends particularly influential given Australia's position as the world's largest iron ore exporter. During the week ending December 12, 2025, the materials sector rose 2.75%, demonstrating its capacity to outperform during periods of broader market weakness.
Commodity Price Correlation Matrix
Mining stock valuations exhibit strong correlations with underlying commodity prices, though these relationships vary significantly across different mineral categories. Iron ore prices directly influence the three largest Australian mining companies, with each $10 per tonne movement in iron ore prices typically translating to billions in revenue impact across BHP, Rio Tinto, and Fortescue.
Gold mining operations demonstrate different price sensitivity patterns, with companies like Evolution Mining and Northern Star Resources responding to both gold price movements and production cost variations. During December 2025, the gold market surge significantly outperformed other mining categories, with Evolution Mining gaining 6.33% and Northern Star Resources advancing 3.80% in a single week.
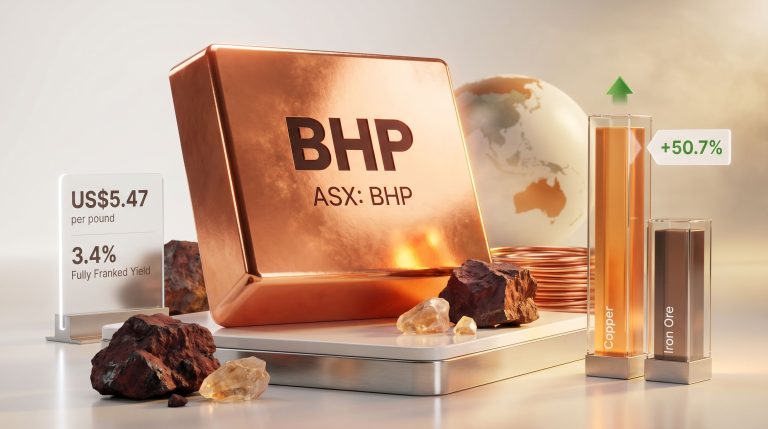
Furthermore, copper investment strategies create distinct investment opportunities for pure-play operators like Sandfire Resources, which gained 1.36% during the same period. The metal's essential role in renewable energy infrastructure and electric vehicle production creates long-term demand underpinnings that differ from cyclical industrial metals.
"Stronger commodity prices served as the primary catalyst for mining sector outperformance during December 2025, with multiple companies achieving new 52-week highs simultaneously."
Which Mining Subsectors Are Leading Performance Metrics?
Iron Ore Giants: Strategic Market Position Analysis
The three dominant Australian iron ore producers occupy privileged positions along the global cost curve, maintaining some of the world's lowest production costs per tonne. BHP Group demonstrated this advantage during December 2025, with share prices rising 1.67% to $45.59 while establishing a new 52-week high of $45.98.
Iron Ore Majors Performance Summary (Week ending December 12, 2025):
| Company | Stock Code | Weekly Return | Closing Price | 52-Week High |
|---|---|---|---|---|
| BHP Group | ASX: BHP | +1.67% | $45.59 | $45.98 |
| Fortescue Ltd | ASX: FMG | +3.93% | $22.98 | $23.38 |
| Rio Tinto | ASX: RIO | +3.56% | $143.40 | $143.53 |
Infrastructure advantages provide these companies with sustainable competitive moats, particularly their integrated rail and port facilities in Western Australia's Pilbara region. Fortescue's 3.93% weekly gain reflected market recognition of its operational efficiency improvements and cost reduction initiatives.
Rio Tinto's 3.56% advance to $143.40, accompanied by a new 52-week high of $143.53, demonstrated the company's successful diversification across multiple commodities while maintaining iron ore as its primary earnings driver.
Gold Mining Operations: Risk-Adjusted Return Profiles
Australian gold mining companies exhibited exceptional momentum during December 2025, outperforming most other mining subsectors. This outperformance reflected both rising gold prices and operational improvements across major producers.
Gold Mining Stock Performance Analysis:
| Company | Stock Code | Weekly Return | Closing Price | 52-Week High Status |
|---|---|---|---|---|
| Northern Star Resources | ASX: NST | +3.80% | $27.33 | Near high |
| Evolution Mining | ASX: EVN | +6.33% | $12.76 | New high: $12.81 |
| Newmont Corporation | ASX: NEM | +8.58% | $150.06 | Strong advance |
| Greatland Resources | ASX: GGP | +12.65% | $9.44 | New 52-week high |
Evolution Mining's 6.33% weekly gain and new 52-week high establishment highlighted the company's successful cost management strategies and production optimisation programs. The stock's momentum accelerated into the week's end, suggesting institutional accumulation.
Greatland Resources delivered the strongest performance among gold producers, advancing 12.65% to close at a new 52-week high of $9.44. This performance reflected market confidence in the company's gold and copper development projects.
Newmont Corporation's 8.58% surge to $150.06 demonstrated the attractiveness of established producers with diversified asset portfolios and consistent cash flow generation capabilities.
Diversified Mining Portfolios: Commodity Mix Optimisation
Companies maintaining exposure across multiple commodities demonstrated resilience during varying market conditions. Alcoa Corporation CDI advanced 6.14% to $70.53, achieving a 52-week high of $70.86, reflecting aluminium market dynamics and operational efficiency improvements.
The diversification strategy provides several advantages:
• Reduced exposure to single commodity price volatility
• Operational synergies across different mining operations
• Enhanced capital allocation flexibility
• Improved cash flow stability across commodity cycles
How Do Interest Rate Environments Impact Mining Share Valuations?
Capital-Intensive Business Model Sensitivity
Mining operations require substantial capital investments for both development and maintenance, making these companies particularly sensitive to interest rate movements. The Reserve Bank of Australia's decision to maintain the cash rate at 3.6% during December 2025 created a challenging backdrop for capital-intensive industries.
The central bank's policy stance diverged significantly from the US Federal Reserve, which implemented its third rate cut in four months, reducing rates to a 3.5%-3.75% range. This divergence created currency implications for Australian mining companies, many of which sell commodities in US dollars while maintaining cost structures in Australian dollars.
Interest Rate Environment Comparison:
• Australian cash rate: 3.6% (held steady)
• US Federal Reserve rate: 3.5%-3.75% (after 0.25% reduction)
• Policy trajectory: Australia considering increases; US implementing cuts
• Market expectations: 27% probability of Australian rate hike in February 2026
Dividend Sustainability Analysis Framework
The interest rate environment directly impacts mining companies' dividend sustainability calculations. Higher rates increase the opportunity cost of holding dividend-paying stocks while simultaneously raising debt servicing costs for leveraged miners.
RBA Governor Michele Bullock's statement that interest rate cuts were not on the horizon for the foreseeable future created initial market pressure. The ASX 200 declined for three consecutive days following the rate announcement before recovering on Thursday and Friday to close the week 0.73% higher.
Despite broader market weakness, mining stocks demonstrated defensive characteristics, with the materials sector rising 2.75% while most other sectors declined. Consequently, this performance suggested that commodity price strength more than offset interest rate concerns for resource companies.
What Risk Factors Should Investors Evaluate in Mining Portfolios?
Operational Risk Assessment Matrix
Mining operations face multifaceted risk exposures that extend beyond commodity price volatility. Geopolitical risks affect companies with international operations, while domestic miners face regulatory and environmental compliance costs.
The December 2025 market reaction to the RBA's interest rate decision illustrated sector-specific risk patterns. While the broader market experienced weakness across eight of eleven sectors, materials companies maintained positive momentum, suggesting their risk profiles differ substantially from other industries.
Sector Performance During Market Stress (Week ending December 12, 2025):
| Market Sector | Weekly Performance |
|---|---|
| Materials | +2.75% |
| Financials | +1.69% |
| A-REITs | +0.85% |
| Consumer Staples | -0.43% |
| Utilities | -0.82% |
| Healthcare | -0.97% |
| Energy | -1.15% |
| Industrials | -1.17% |
| Communication | -1.27% |
| Consumer Discretionary | -1.33% |
| Information Technology | -4.69% |
Market Risk Quantification Models
Currency exposure represents a significant risk factor for Australian mining companies, as most commodities trade in US dollars while operational costs occur in Australian dollars. The diverging monetary policies between Australia and the United States during late 2025 created additional complexity for currency hedging strategies.
Environmental compliance costs continue rising as regulatory standards tighten. Companies must allocate increasing capital toward emissions reduction, water management, and land rehabilitation, potentially impacting profitability margins.
However, labour relations remain critical for operational continuity, particularly in remote mining locations where skilled workforce availability can constrain production capacity. Recent wage inflation has pressured cost structures across the industry.
How Are Technology Innovations Transforming Mining Operations?
Automation and Productivity Enhancement Programs
Australian mining companies lead global automation adoption, implementing autonomous haul trucks, automated drilling systems, and remote-controlled processing equipment. These investments target both cost reduction and safety improvement objectives.
BHP Group operates some of the world's most advanced autonomous mining systems in its Pilbara iron ore operations, with fleets of driverless trucks and automated trains reducing operational costs while improving safety metrics. These technological advantages contribute to the company's position along the global cost curve.
Rio Tinto's Mine of the Future program integrates artificial intelligence and machine learning across operations, optimising equipment utilisation and predictive maintenance scheduling. These initiatives target productivity improvements of 10-15% across major operations.
Fortescue Metals Group implemented comprehensive digitalisation programs, including automated ore processing and integrated supply chain optimisation. The company's technology investments support its position as one of the world's lowest-cost iron ore producers.
Sustainability Integration and Carbon Transition
Mining companies face increasing pressure to reduce carbon emissions while maintaining production efficiency. This transition requires substantial capital investments in renewable energy systems, electric vehicle fleets, and carbon capture technologies.
Fortescue's ambitious decarbonisation targets include achieving carbon neutrality by 2030, requiring investments in renewable energy infrastructure and green hydrogen production. Furthermore, these initiatives position the company for potential premium pricing in environmentally conscious markets.
In addition, data-driven mining operations enable companies to optimise resource extraction while minimising environmental impact. BHP and Rio Tinto announced significant renewable energy procurement agreements, targeting 100% renewable electricity for major operations by 2030.
The next major ASX story will hit our subscribers first
What Market Opportunities Are Emerging for ASX 200 Mining Shares?
Global Supply Chain Repositioning Trends
The critical minerals transition continues expanding as renewable energy adoption accelerates globally. Australian mining companies possess advantageous positions in lithium, rare earth elements, and battery metals essential for energy transition technologies.
Infrastructure development requirements create sustained demand for steel-making inputs, supporting iron ore and metallurgical coal markets. Government infrastructure spending commitments across developed economies underpin medium-term demand projections.
Export market diversification strategies reduce dependence on any single trading partner while capturing price premiums in different regional markets. Australian miners benefit from geographic proximity to Asian growth markets while maintaining access to European and North American customers.
Merger and Acquisition Activity Patterns
Consolidation opportunities exist across various mining subsectors as companies seek scale advantages and operational synergies. Asset portfolio optimisation drives divestment and acquisition activity as miners focus on core competencies.
Cross-border investment flows increase as international mining companies seek exposure to Australian geological advantages and political stability. Regulatory frameworks generally support foreign investment in mining operations, subject to national security considerations.
How Do ASX 200 Mining Shares Compare Across Key Performance Indicators?
Financial Performance Metrics Comparison
Mining companies exhibit wide performance variations across fundamental financial metrics, reflecting differences in asset quality, operational efficiency, and capital allocation discipline.
Mining Sector Financial Benchmarks:
| Performance Metric | Top Quartile | Industry Median | Bottom Quartile |
|---|---|---|---|
| Return on Invested Capital | >15% | 8-12% | <5% |
| Free Cash Flow Yield | >8% | 4-6% | <2% |
| Net Debt-to-EBITDA | <1.0x | 1.0-2.0x | >2.5x |
| Operating Margin | >30% | 15-25% | <10% |
| Capital Intensity | <25% | 25-35% | >40% |
Production Efficiency Benchmarking
Cost per tonne metrics provide critical comparisons across mining operations, with the most efficient producers maintaining significant competitive advantages during commodity price downturns.
Recovery rates and processing efficiency measurements determine profitability for given ore grades. Advanced processing technologies enable economic extraction from lower-grade deposits, extending mine lives and improving asset utilisation.
Capital intensity ratios reveal management's ability to generate returns from invested capital. Companies achieving superior capital efficiency typically command premium valuations during market upturns.
Which Investment Strategies Optimise Mining Sector Exposure?
Portfolio Construction Methodologies
Commodity diversification provides risk reduction benefits while capturing exposure to different demand drivers. Iron ore exposure captures steel industry growth, while gold holdings offer inflation protection and safe-haven characteristics.
Market capitalisation weighting versus equal-weight approaches produce different risk-return profiles. Equal-weight strategies provide greater exposure to smaller mining companies with higher growth potential but increased volatility.
Strategic Allocation Framework:
• Large-cap miners (40-50%: BHP, Rio Tinto, Fortescue
• Mid-cap specialists (25-35%): Northern Star, Evolution Mining
• Small-cap explorers (10-20%): Development-stage companies
• Commodity diversification (15-25%): Base metals and specialty minerals
Risk Management Framework Implementation
Position sizing guidelines based on volatility profiles help manage portfolio risk while maintaining adequate exposure to sector opportunities. ASX 200 mining shares typically exhibit higher volatility than broad market indices, requiring careful position sizing.
Liquidity considerations become critical during market stress periods. Large-cap miners like BHP and Rio Tinto maintain superior liquidity characteristics compared to smaller exploration companies.
Hedging strategies for commodity price exposure include futures contracts and options strategies, though these instruments may not perfectly correlate with individual company performance due to operational factors.
What Economic Indicators Signal Mining Sector Performance?
Leading Economic Indicators Matrix
Manufacturing purchasing managers' indices (PMI) provide early signals of industrial metals demand, with readings above 50 indicating expansion in manufacturing activity. Global PMI trends correlate strongly with copper and steel demand patterns.
Infrastructure spending commitments from major economies create medium-term demand visibility for construction materials. Government stimulus programs often include substantial infrastructure components that support mining demand.
Global trade volume trends affect shipping demand and freight rates, indirectly impacting mining economics through transportation cost changes. For instance, container shipping rates and dry bulk freight indices provide useful leading indicators.
Monetary Policy Impact Assessment
Central bank policy divergence creates currency volatility that affects mining company profitability. The RBA's restrictive stance during December 2025, contrasting with US Federal Reserve easing, supported Australian dollar strength against the US dollar.
Real interest rate calculations help assess mining investment attractiveness relative to fixed-income alternatives. Higher real rates increase the opportunity cost of holding commodity-exposed equities.
Inflation expectations influence commodity demand as investors seek hard asset exposure during periods of currency debasement concerns. Mining stocks often outperform during inflationary periods due to their exposure to real assets.
How Should Investors Position for Long-Term Mining Sector Growth?
Structural Demand Drivers Analysis
Energy transition mineral requirements create multi-decade demand growth for lithium, cobalt, nickel, and rare earth elements. Australian miners possess significant reserves of these critical materials, providing strategic advantages in emerging markets.
Emerging market urbanisation continues driving steel demand growth, supporting iron ore and metallurgical coal markets. Infrastructure development in Asia, Africa, and Latin America creates sustained demand for construction materials.
Technology sector demand for specialty metals increases as electronic device sophistication advances. Semiconductor manufacturing requires various rare earth elements and precious metals in production processes.
Investment Thesis Validation Framework
Management quality assessment requires evaluation of capital allocation decisions, operational execution capabilities, and strategic vision alignment with industry trends. Successful mining executives demonstrate both technical expertise and financial discipline.
Operational excellence track records provide insight into companies' abilities to manage complex mining operations while maintaining cost discipline. Consistent production guidance achievement indicates management competence.
Strategic vision alignment with long-term industry trends helps identify companies positioned for sustainable growth. Focus areas include automation adoption, sustainability integration, and critical mineral exposure.
"The materials sector's 2.75% outperformance during a challenging market week demonstrates the defensive characteristics and growth potential of well-positioned mining companies within diversified portfolios."
The Australian mining sector's evolution reflects broader economic transformation toward resource sustainability and technological advancement. ASX 200 mining shares continue demonstrating their strategic importance within portfolios, with companies successfully navigating this transition while maintaining operational excellence positioning themselves for sustained competitive advantages in global commodity markets.
Finally, investors seeking exposure to Australia's resource sector should consider the Australian materials sector as a key component of long-term wealth creation strategies. The sector's defensive characteristics, combined with its exposure to global growth themes, make it an essential consideration for diversified portfolios.
Seeking Your Next Mining Investment Opportunity?
Discovery Alert's proprietary Discovery IQ model delivers real-time alerts on significant ASX mineral discoveries, instantly empowering subscribers to identify actionable opportunities ahead of the broader market. Understand why major mineral discoveries can lead to substantial market returns by exploring Discovery Alert's dedicated discoveries page, showcasing historic examples of exceptional outcomes, and begin your 30-day free trial today to position yourself ahead of the market.