June 10, 2026
The Measurement Gap That Has Always Existed Beneath the Surface of Mining Operations
Every tonne of ore that moves through a mining operation represents a compressible margin. The machinery that extracts it, the trucks that haul it, and the infrastructure that processes it all generate costs that are reasonably well understood. What remains stubbornly difficult to quantify, in real time, is whether the material itself is being moved as efficiently as the operation assumes. This is the foundational problem that autonomous 3D load measurement in mining is now designed to solve, and the gap between what operators believe they are moving and what they are actually moving is larger than most mine managers care to acknowledge.
The shift toward continuous, sensor-based measurement represents more than a technology upgrade. It reflects a growing recognition that the most expensive inefficiencies in mining are not equipment failures or logistical breakdowns, but the invisible inefficiencies embedded in every load cycle that never trigger an alarm, never appear on a maintenance report, and never surface until weeks later in a fuel invoice or a billing dispute.
When big ASX news breaks, our subscribers know first
Why Traditional Load Monitoring Creates More Problems Than It Solves
The Structural Limitations of Conventional Systems
For decades, mining operations have relied on a combination of weigh bridges, onboard payload sensors, and manual tallying to track material movement. Each of these approaches carries structural limitations that compound over time at scale.
Weigh bridges require vehicles to come to a complete stop, are subject to mechanical wear and calibration drift, and generate output as a single mass figure with no information about how that material is distributed across the truck bed. Furthermore, they cannot indicate whether residual carryback from the previous load is inflating the reading. In high-throughput operations processing hundreds of vehicle passes daily, the cumulative production time consumed by weigh bridge stops represents a meaningful output constraint.
Onboard payload sensors, which calculate estimated load mass through suspension pressure differentials, typically operate within an accuracy range of 5 to 10 percent of actual mass. These systems cannot distinguish between a truck carrying dense, high-value ore and one carrying low-density waste material at the same volumetric fill level. In subcontracted haulage arrangements where billing is tied to material moved, this distinction matters considerably.
Manual tallying introduces human error variance that ranges from 3 to 8 percent depending on operator consistency and site conditions. In dusty, low-visibility environments, visual assessment of truck load state becomes unreliable, particularly for identifying carryback material adhering to truck beds after tipping.
The Compounding Cost of Invisible Inefficiency
The financial consequences of these limitations do not appear on a single line item. They distribute across fuel ledgers, maintenance schedules, and billing reconciliation in ways that make root cause analysis difficult without the supporting data that traditional systems cannot provide.
Consider a few dimensions of this cost:
- Carryback material — ore or waste that adheres to truck beds after tipping — typically represents 2 to 8 percent of hauled tonnage and creates systematic billing inaccuracy in subcontracted transport arrangements
- Trucks operating at 60 to 70 percent of optimal payload capacity consume approximately 25 to 35 percent more fuel per tonne moved compared to fully optimised loads
- Billing disputes in subcontracted haulage environments average 5 to 12 percent of annual transport invoicing, with resolution timelines extending 60 to 180 days and average dispute resolution costs of $2,000 to $5,000 per incident
- Payload variance across mining haulage operations typically ranges between 8 and 15 percent of theoretical truck capacity
The most damaging feature of these inefficiencies is not their magnitude in any single cycle, but their invisibility. They surface in fuel invoices, maintenance logs, and billing disputes weeks after the load event that caused them, by which point hundreds of additional cycles have added to the problem.
What Autonomous 3D Load Measurement Actually Does
A Technical Foundation Built on LiDAR
Autonomous 3D load measurement uses sensor-based systems to automatically capture volumetric and load-state data from mining vehicles and stockpiles during normal operations, without halting production or requiring any driver interaction. The output is a continuous stream of calibrated data covering every load event, rather than the periodic snapshots that traditional systems provide.
The technology foundation is LiDAR (Light Detection and Ranging), which operates through pulse-based distance calculation. A LiDAR sensor emits rapid laser pulses toward a target surface and measures the return time of each pulse to calculate precise spatial positions. Modern industrial LiDAR sensors emit millions of pulses per second, generating point clouds — collections of millions of georeferenced three-dimensional data points that together reconstruct the geometry of a material surface with millimetre-to-centimetre precision.
The advantages of LiDAR over alternative sensing approaches are significant for mining applications. Camera-based vision systems require adequate ambient or artificial lighting and degrade substantially in the dust-laden, high-vibration environments characteristic of mining operations. Radar-based systems provide distance data but lack the spatial resolution necessary for precise volumetric measurement. LiDAR operates as an active sensing technology, independent of ambient light conditions, and maintains measurement integrity in environments where other technologies fail. Platforms such as Emesent's mining solutions have demonstrated how LiDAR-based autonomous sensing can be deployed effectively across complex mine environments.
How Point Clouds Become Operational Intelligence
Raw point cloud data captured by a LiDAR sensor represents a precise three-dimensional map of the scanned surface, but it requires interpretation to become operationally useful. Software platforms convert this data into volume estimates using a combination of Poisson surface modelling, triangulation techniques, and calculus-based integration to calculate the three-dimensional area beneath the reconstructed material surface relative to a reference baseline — typically the floor of the truck bed or loading vessel.
The result is not just a volume figure. The system also performs equipment classification, identifying whether the vehicle in the scanning zone is a haul truck, a rail car, or another vehicle type, and load state assessment, flagging whether the load is full, underfilled, or showing evidence of carryback material. All of this is generated from a single pass through the scanning zone at normal operating speed.
The integrated system developed by Blickfeld and Ayavex Solutions, marketed as ScanHaul, completes this full analysis cycle within approximately three minutes of a vehicle passing through the scan zone. Blickfeld's Qb2 sensor provides the LiDAR capture capability, while Ayavex's software platform performs the reconstruction, analysis, and classification functions that convert raw spatial data into actionable operational output.
How the System Works in Practice
System Architecture at a Glance
The ScanHaul system integrates three core functional components:
| Component | Primary Function | Operational Capability |
|---|---|---|
| Blickfeld Qb2 LiDAR Sensor | Captures high-resolution 3D spatial data | Operates at full vehicle speed, no stoppage required |
| 3D Reconstruction Software (Ayavex) | Rebuilds surface geometry from point cloud data | Generates calibrated volume and load state classification |
| Classification Engine | Identifies equipment type and load condition | Distinguishes haul trucks from rail cars, flags underfill and carryback |
The Scanning Workflow, Step by Step
Understanding the operational sequence helps clarify why this approach eliminates the disruption associated with conventional measurement systems:
- A haul truck or rail car enters the designated scanning zone while maintaining normal operating speed
- The Blickfeld Qb2 LiDAR sensor captures a high-density point cloud of the load surface across the full vehicle traverse
- The Ayavex software platform reconstructs the three-dimensional geometry of the material surface from the captured point cloud data
- Volume is calculated by integrating the reconstructed surface against the known geometry of the vehicle loading floor
- The system compares measured volume against equipment-specific capacity benchmarks to classify load state
- An auditable, timestamped data record is generated and logged without any driver interaction, vehicle modification, or production halt
Environmental Resilience as a Deployment Prerequisite
Industrial mining environments impose conditions that eliminate many sensing technologies from practical consideration. Extreme thermal variation, continuous dust exposure, mechanical vibration, and the requirement for uninterrupted 24-hour, seven-day-a-week operation set a high baseline for sensor durability.
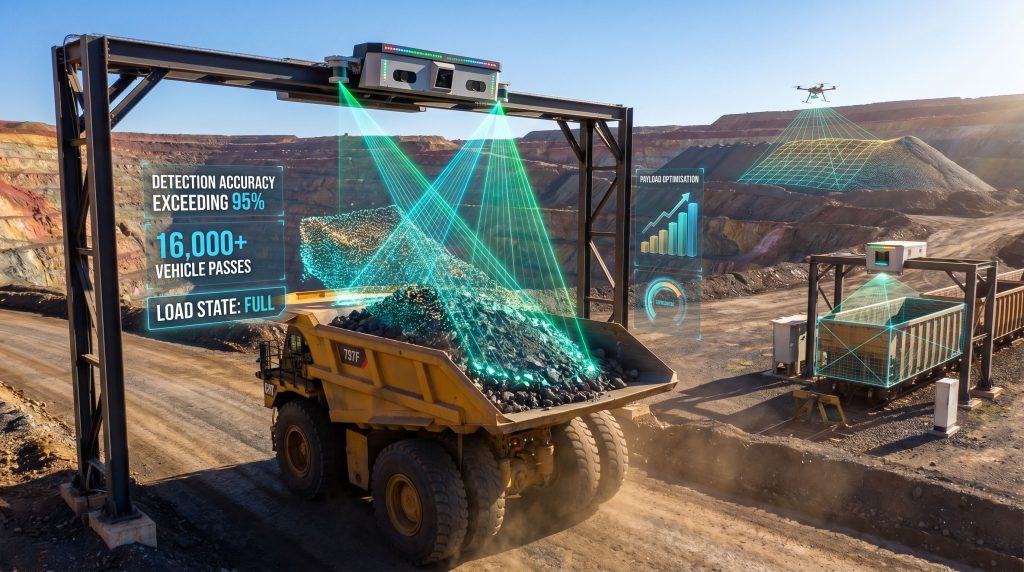
The ScanHaul system has been validated under these conditions in a Canadian arctic mining operation where ambient temperatures reached -37 degrees Celsius. The system processed more than 16,000 vehicle passes while maintaining detection accuracy exceeding 95 percent, all without requiring a maintenance interruption. This represents one of the more rigorous documented performance benchmarks in the autonomous sensing space for mining applications.
Field validation in arctic conditions at -37 degrees Celsius across more than 16,000 vehicle passes without maintenance interruption establishes a performance standard that few competing technologies can claim at equivalent environmental extremity.
Where This Technology Is Being Applied Across Mining Operations
Haul Truck Monitoring: The Core Application
The primary deployment model positions scanning zones along haul routes at points where trucks pass at regular intervals, such as exit points from loading areas or entry points to processing facilities. This placement captures load data from every vehicle pass without diverting trucks or requiring any schedule adjustment.
The metrics generated extend well beyond a single load reading. Fleet-level analysis becomes possible, including load consistency patterns across individual vehicles, carryback frequency by truck or operator, and payload distribution across the fleet as a whole. Integration with existing fleet management systems enables real-time operational dashboards that surface inefficiencies as they occur. This approach is part of the broader shift toward data-driven mining operations that define the future of the sector.
Rail Car Loading and Bulk Material Transport
Stationary scanning systems positioned at rail loading facilities apply the same volumetric measurement principles to rail car loading verification. This application is particularly valuable in subcontracted rail transport arrangements, where billing accuracy is tied to confirmed material volume. Over- and under-loading of rail cars creates both compliance risk and equipment stress, and autonomous 3D measurement provides objective documentation of load state at each departure.
Stockpile Volumetrics
Drone-mounted and vehicle-mounted LiDAR systems extend autonomous 3D measurement to ore stockpile inventory reconciliation. Traditional stockpile surveying relies on manual survey techniques or periodic drone photogrammetry, both of which provide snapshots rather than continuous monitoring. Point cloud-based measurement replaces these periodic methods with the potential for frequent or continuous inventory updates. In addition, 3D geological modelling platforms are increasingly being integrated alongside volumetric scanning to improve subsurface planning accuracy.
A useful comparison highlights where each approach fits:
| Method | Measurement Frequency | Personnel Required | Light/Dust Sensitivity | Cost per Survey |
|---|---|---|---|---|
| Manual Ground Survey | Weekly/Monthly | High | Low | High |
| Drone Photogrammetry | Daily/Weekly | Moderate | High (dust sensitive) | Moderate |
| Vehicle-Mounted LiDAR | Continuous | None | Low | Low (per unit time) |
Underground Stope Scanning
One of the most technically demanding applications involves measuring excavated underground cavities, known as stopes, where traditional survey methods are constrained by physical access limitations and personnel safety requirements. Autonomous robots equipped with SLAM (Simultaneous Localisation and Mapping) technology can navigate GPS-denied underground environments, mapping and scanning simultaneously without requiring survey personnel to enter active workings.
Operations using complete autonomous stope scanning have identified an estimated 10 to 15 percent of additional recoverable ore compared to traditional measurement approaches, which typically carry deviation margins of 5 to 7 percent. This recovery improvement represents a material financial upside for underground mining operations, where ore loss in unmeasured voids represents permanent revenue foregone.
Conveyor Belt Throughput Measurement
Stationary LiDAR positioned above conveyor belts calculates real-time volumetric flow rates by measuring the cross-sectional profile of material moving through the sensor field. Continuous throughput data enables blending control adjustments and plant feed consistency improvements that contact-based measurement systems cannot deliver without downtime for calibration. The elimination of contact sensors also removes a category of mechanical failure risk in high-throughput belt environments. Furthermore, mining automation trends suggest that conveyor monitoring will become an increasingly standard application as sensor infrastructure matures.
The Operational and Financial Case
Auditability as an Operational Asset
Every vehicle pass through a ScanHaul scanning zone generates a timestamped, equipment-identified, volumetrically quantified data record. In subcontracted haulage environments where billing disputes have historically required manual evidence gathering and extended resolution timelines, this objective record transforms dispute resolution from a subjective process into a data-supported one.
The downstream effects extend to ESG reporting. Verifiable material movement records support Scope 3 emissions tracking by enabling accurate correlation between payload optimisation and fuel consumption metrics, providing mining companies with documented evidence of efficiency improvements for environmental reporting frameworks.
Fuel Economics and Cost Reduction Pathways
The fuel efficiency relationship between payload optimisation and operating cost is direct and measurable. Research consistently indicates that trucks operating below optimal payload consume disproportionate fuel per tonne moved. Optimally loaded trucks use approximately 15 to 20 percent less fuel than underloaded equivalent vehicles, representing savings of $0.50 to $1.50 per tonne depending on fuel pricing and haul distances.
For a mid-sized mining operation processing 50,000 tonnes daily with a fleet of 300 haul trucks, the combination of fuel savings, carryback elimination, and billing accuracy improvements could represent $400,000 to $800,000 in annual savings through reduced operating costs alone.
Zero-Disruption Deployment
The compact system design requires no vehicle modification and no production halt during installation. A modular architecture enables phased deployment across multiple scanning zones or mine sites, and the system is designed for compatibility with existing fleet management, enterprise resource planning, and mine planning software environments. As Tsolmon Munkhchuluun, Chief Executive Officer of Ayavex Solutions, has articulated, the design philosophy centres on deploying quickly and solving one operational measurement problem completely before advancing to the next.
The next major ASX story will hit our subscribers first
How Autonomous 3D Load Measurement Compares to Alternative Technologies
A Technology-by-Technology Comparison
Selecting a load monitoring approach requires understanding where each technology performs well and where it creates operational risk:
| Technology | Accuracy Level | Operational Disruption | Environmental Tolerance | Data Continuity |
|---|---|---|---|---|
| Weigh Bridge | High (mass only) | High (full stop required) | Moderate | Periodic |
| Onboard Payload Sensors | Moderate (5–10% variance) | None | Moderate | Continuous |
| Camera-Based Vision Systems | Variable | None | Low (dust/light dependent) | Continuous |
| Drone Photogrammetry | High (periodic) | Low | Moderate | Periodic |
| Autonomous 3D LiDAR Scanning | High (continuous) | None | High | Continuous |
LiDAR Versus Photogrammetry for Load Monitoring
Photogrammetry, which reconstructs three-dimensional surfaces from overlapping two-dimensional images, offers a cost-effective solution for scheduled stockpile surveys where measurement frequency is not critical. Its dependence on adequate lighting and sensitivity to dust and precipitation limit its reliability in active mining environments where continuous monitoring is the objective.
LiDAR's active sensing mechanism — emitting and receiving its own light pulses rather than relying on ambient illumination — provides a fundamental operational advantage in these conditions. For real-time load monitoring across every vehicle pass in a dusty, high-throughput environment, LiDAR is the functionally appropriate technology. Photogrammetry remains a useful complement for periodic inventory checks where scheduled survey windows are acceptable. Recent academic research published in MDPI's Drones journal further supports the operational advantages of LiDAR-based sensing over image-dependent alternatives in demanding field conditions.
What the Future of Autonomous Load Measurement Looks Like
AI-Driven Point Cloud Analysis
The next development layer for autonomous 3D measurement involves integrating machine learning models into the point cloud analysis workflow. Rather than classifying load states against fixed benchmarks, AI-trained models will learn to identify material type variations, surface anomaly patterns, and density indicators from spatial data alone. The role of AI in mining is expanding rapidly, and this integration would reduce manual quality assurance time for scan data interpretation whilst enabling predictive load optimisation.
The processing speed requirements for AI-enhanced analysis at scale will likely drive further development in edge computing infrastructure for mining environments, with computation occurring at or near the scanning zone rather than relying on centralised processing.
Autonomous Scan Missions in Hazardous Zones
Quadruped robots and SLAM-enabled drones are progressively extending the operational reach of autonomous 3D measurement into geotechnically hazardous areas where personnel presence creates unacceptable safety exposure. Scheduled scan missions in blast-affected or structurally unstable zones, with real-time deformation monitoring and automated alerts for ground movement, remove survey personnel from active risk environments while maintaining measurement continuity.
This application represents a safety dividend from the same technology platform delivering operational efficiency gains — a dual-value proposition that strengthens the investment case for deployment.
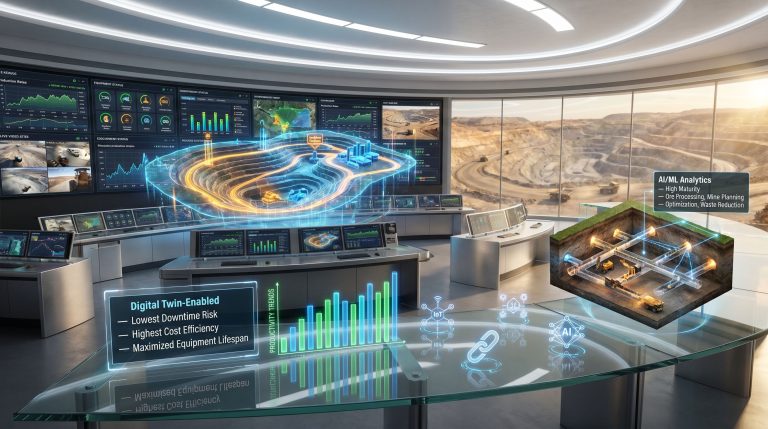
Integration with Digital Twin Environments
Continuous 3D scan data has a natural integration pathway into live mine digital twin environments, where physical material movement is mirrored in a virtual model used for planning, simulation, and operational decision-making. As autonomous haulage systems become more prevalent, LiDAR-based load data serves as a validation layer for autonomous haulage system payload management, confirming that programmatic loading instructions are producing the expected physical outcomes. Moreover, sensor-based ore sorting is emerging as a complementary capability that can be integrated within the same data ecosystem, further improving material characterisation across the value chain.
The modular deployment philosophy articulated by Ayavex Solutions — solving one measurement problem completely before advancing to the next — suggests a logical roadmap that extends autonomous 3D load measurement in mining from haul truck monitoring into crushing circuits, ROM pad management, and port loading facilities as the platform matures.
Frequently Asked Questions About Autonomous 3D Load Measurement in Mining
Which operations benefit most from this technology?
Operations with high vehicle pass frequency, subcontracted haulage arrangements, or documented carryback history generate the most immediate measurable return. Arctic, desert, and underground environments where conventional sensing technologies underperform are priority deployment candidates based on validated field performance data.
How does LiDAR accuracy compare to weigh bridges?
LiDAR provides volumetric output in cubic metres rather than mass output in tonnes. Conversion to mass requires bulk density inputs, which vary between approximately 1.2 and 3.2 tonnes per cubic metre depending on material type and moisture content. In field deployments, detection accuracy has exceeded 95 percent across tens of thousands of vehicle passes. Weigh bridges remain the reference standard for legally recognised mass measurement in regulated contexts; LiDAR-based volumetric measurement is best understood as a complement to mass-based systems rather than a replacement.
Can these systems operate underground?
SLAM-equipped autonomous robots and drones can navigate GPS-denied underground environments, mapping and scanning simultaneously. These systems enable stope measurement without survey personnel entering active underground workings, addressing both the accuracy gap and the personnel safety risk inherent in traditional underground surveying approaches.
How long does a single vehicle scan take to process?
The complete analysis cycle — including volume calculation, equipment classification, and load state assessment — is completed within approximately three minutes of a vehicle passing through the scan zone. This processing speed supports real-time operational feedback within the timeframe of a single haul cycle.
What maintenance does a LiDAR scanning system require in harsh conditions?
Industrial-grade LiDAR sensors are designed for continuous operation in extreme conditions without frequent maintenance intervention. Field validation in a Canadian arctic environment at -37 degrees Celsius across more than 16,000 vehicle passes without maintenance interruption provides direct evidence of operational durability in conditions that represent an upper boundary of environmental challenge for mining sensor deployments.
The Strategic Case, Condensed
The value proposition for autonomous 3D load measurement in mining rests on a combination of factors that individually are each sufficient to justify operational interest, and together represent a compelling operational and financial case:
- Continuous, high-accuracy data on every load event without production disruption or vehicle modification
- Environmental resilience validated at extremes that eliminate competing technologies from practical consideration
- Applications spanning haul truck monitoring, rail loading, stockpile volumetrics, underground stope scanning, and conveyor throughput — deployed from a single modular platform
- Financial returns built across fuel savings, billing accuracy, carryback elimination, and operational transparency rather than a single efficiency metric
- A forward integration pathway into AI-enhanced analysis, digital twin environments, and autonomous haulage system validation
For mining operations where marginal efficiency determines whether a project remains economically viable through commodity cycle fluctuations, the ability to measure every load event continuously and accurately is not an operational luxury. It is an increasingly fundamental capability.
Readers interested in exploring the industrial LiDAR partnership that produced the ScanHaul system can find additional context in coverage published by Global Mining Review at globalminingreview.com.
This article contains forward-looking statements and estimated financial figures based on industry research and publicly available data. Actual operational outcomes will vary depending on site-specific conditions, material types, fleet configurations, and operational practices. Nothing in this article constitutes financial or investment advice.
Want To Identify The Next Major ASX Mining Discovery Before The Market Moves?
Discovery Alert's proprietary Discovery IQ model scans ASX announcements in real time, instantly converting complex mineral data across 30-plus commodities into actionable insights for both short-term traders and long-term investors — the same kind of operational and technological advancements reshaping mining efficiency today are also driving the significance of major new discoveries. Start your 14-day free trial now, or explore why historic mineral discoveries have delivered extraordinary returns for investors who positioned themselves early.