July 27, 2026
When Every Exit Closes: Understanding the Bab el-Mandeb Blockade and Red Sea Oil Route Crisis
The architecture of global energy trade was never designed to withstand the simultaneous failure of its two most critical chokepoints. The Bab el-Mandeb blockade and Red Sea oil route crisis has exposed a redundancy model being stress-tested in real time. For decades, the assumption built into shipping logistics, refinery supply chains, and strategic petroleum reserve planning was elegantly simple: if one corridor closes, the other absorbs. The results are now exposing structural fragilities that markets had long chosen to overlook.
When big ASX news breaks, our subscribers know first
The Strait That Cannot Be Replaced
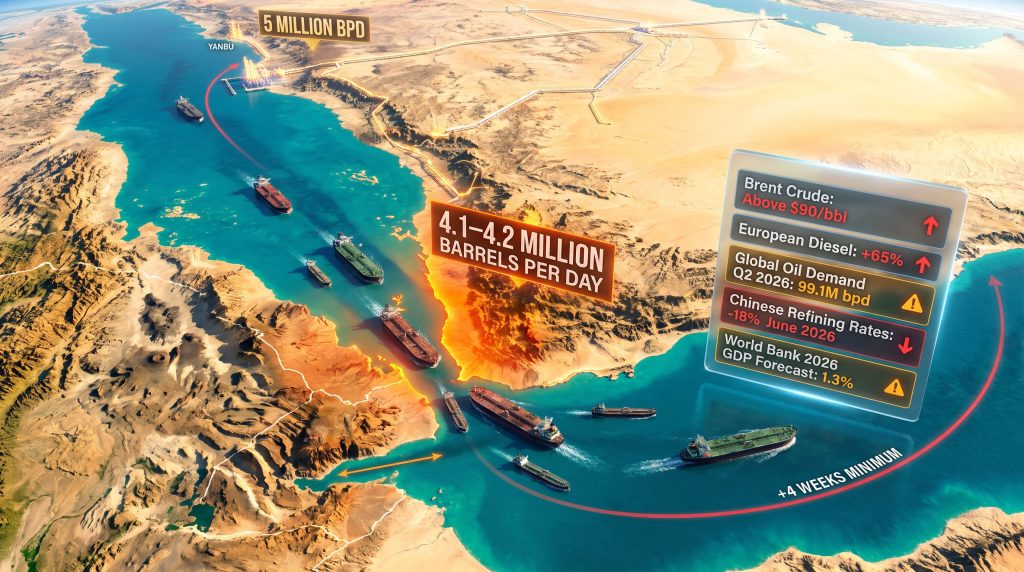
Positioned at the southern end of the Red Sea, the Bab el-Mandeb Strait functions as the maritime gateway connecting that body of water to the Gulf of Aden and the broader Indian Ocean basin. Under normal operating conditions, approximately 4.1 to 4.2 million barrels per day of oil and petroleum products move through this narrow passage, representing roughly 5% of total global seaborne oil trade. Beyond hydrocarbons, the strait facilitates an estimated 10 to 15% of all global maritime commerce, including container shipping, liquefied natural gas cargoes, and bulk commodities.
The distinction between Bab el-Mandeb and the more frequently discussed Strait of Hormuz is both geographic and functional. Hormuz controls entry into the Persian Gulf, governing access to the production heartland of the Middle East. Bab el-Mandeb, by contrast, controls the delivery pathway for crude that has already been extracted, processed, and loaded onto vessels. It is the exit valve of an entire regional supply system, not merely a transit lane.
Furthermore, as Forbes reports, ships have begun turning around in the Red Sea, raising comparisons to a Strait of Hormuz-style crisis that the oil price movements data is already beginning to reflect.
This distinction carries enormous strategic weight. Disrupting Hormuz restricts production flows at their source. Disrupting Bab el-Mandeb eliminates the delivery mechanism for oil that has already been rerouted around Hormuz, effectively severing both ends of the same supply chain simultaneously.
How the Red Sea Became the World's Primary Oil Corridor
From Emergency Workaround to Principal Export Route
Following the effective disruption of the Strait of Hormuz after conflict broke out on February 28, Saudi Arabia enacted a major logistical pivot. The kingdom redirected crude exports through its East-West Pipeline, funnelling production toward the Yanbu export hub on its Red Sea coastline. This infrastructure shift transformed Yanbu from a secondary export terminal into what became, effectively, the kingdom's primary crude outlet to global markets.
The volume surge was substantial. Saudi west coast exports climbed to approximately 5 million barrels per day following March, more than double the volumes recorded before the conflict began. Shipping analytics data from Kpler indicates that roughly four-fifths of those westward-moving barrels were transiting Bab el-Mandeb toward Asian markets, making the strait the linchpin of the entire rerouting strategy.
Asia remains Saudi Arabia's dominant export destination by a significant margin, and the physical geography of that trade relationship makes Bab el-Mandeb essentially non-negotiable. Consequently, there is no equivalent alternative corridor that can move Saudi Red Sea crude to East Asian refineries at comparable speed and cost. The crude oil market dynamics at play here are therefore compounding one another in ways that conventional supply models were never designed to accommodate.
The Infrastructure Pressures Behind Yanbu's Rapid Expansion
What market commentary often overlooks is the operational strain that Yanbu absorbed as a consequence of this pivot. Pipeline throughput capacity, loading berth availability, and tanker scheduling systems at the port were not originally engineered for the volumes now passing through them. The rapid scaling of west coast exports created logistical bottlenecks that quietly added friction to supply flows even before the Houthi blockade declaration escalated the situation further.
The Logistics of Avoidance: What Happens When Bab el-Mandeb Is Closed?
Route Alternatives and Their True Costs
When the Bab el-Mandeb blockade and Red Sea oil route disruption forces vessels to seek alternative paths, two options exist in practice. The first is transiting the Suez Canal northward into the Mediterranean. The second is circumnavigating the African continent via the Cape of Good Hope. However, Al Jazeera has raised the critical question of whether the Suez can realistically save Asian oil consumers in this scenario, and the analysis is sobering.
Neither option is straightforward. The Suez Canal imposes depth restrictions that prevent the largest crude carriers, known as Very Large Crude Carriers (VLCCs), from transiting fully laden. To navigate the canal, these vessels must first offload a portion of their cargo into a pipeline south of the waterway, then reload that crude near Alexandria before continuing northward. This partial-discharge workaround adds time, cost, and coordination complexity to an already strained logistics chain.
The Cape of Good Hope alternative avoids the canal entirely but imposes severe penalties of its own. A standard tanker voyage adds a minimum of four additional weeks to its journey under this routing, more than doubling typical sailing durations. The compounding effects on freight rates and war-risk insurance premiums are significant.
| Route Option | Additional Transit Time | Primary Constraint | Cost Impact |
|---|---|---|---|
| Bab el-Mandeb (direct) | Baseline | Houthi blockade risk | Baseline |
| Suez Canal (partial discharge) | +1 to 2 weeks | VLCC depth restrictions | Moderate increase |
| Cape of Good Hope | +4 weeks minimum | Distance, fuel, insurance | Severe increase |
The Insurance Mechanism: How Blockades Work Without Full Military Enforcement
A dimension of blockade dynamics that receives insufficient analytical attention is the role of commercial insurance markets in determining route viability. A declared blockade does not need to physically prevent transit to be economically effective. When major underwriters, including Lloyd's of London equivalents, classify a maritime corridor as a war-risk zone, the resulting premium structures make commercial operation through that route prohibitively expensive.
This creates a functional closure through market mechanisms rather than military ones. Shipping operators reroute not because the strait is physically impassable, but because the combined cost of war-risk premiums, hull and cargo insurance exclusions, and the potential for uninsured total loss makes transit economically irrational. The trade war impact on oil supply chains has demonstrated precisely this dynamic, reducing Red Sea container traffic substantially without achieving a literal physical seal of the waterway.
The practical power of a maritime blockade in the modern era lies as much in its effect on insurance actuaries as on naval commanders. A route classified as a war zone by commercial underwriters is, for all practical commercial purposes, a closed route.
The Refining Sector: Where the Crisis Hits Hardest
China's Processing Collapse and Its Global Implications
The downstream consequences of sustained supply disruption have concentrated with particular severity in Asia's refining sector. Chinese refiners reduced processing rates by approximately 18% in June 2026 compared to the same month in the prior year, pushing output to its lowest level since the early pandemic period of March 2020. In response, China sharply curtailed both crude imports and fuel exports, prioritising domestic supply security over its role as a regional refined product supplier.
This matters beyond China's borders because Chinese refinery output had been functioning as a partial pressure valve for Asian fuel markets. Its contraction simultaneously removes supply from regional markets and signals the depth of demand destruction occurring within the world's largest oil-importing economy.
The Crude-to-Fuel Price Divergence: A Structural Anomaly
One of the more technically significant developments in the current crisis is the degree to which refined fuel prices have outpaced crude oil price gains. Since the outbreak of conflict, Brent crude has appreciated approximately 30%, while European benchmark diesel prices and U.S. gasoline prices have risen roughly 65% over the same period. Diesel refining margins have surged to record levels.
This divergence reflects a structural imbalance in the energy system: crude oil is available in meaningful quantities, but the capacity to convert that crude into usable fuel products has been severely constrained. The disruption of Russian refinery output, driven by Ukraine's sustained drone campaign against energy infrastructure, compounds the problem significantly. Moreover, Moscow's imposition of diesel export bans in response to those attacks has removed a substantial source of refined product supply from global markets, eliminating a buffer that European buyers had come to rely upon.
Key Energy Market Metrics
| Indicator | Data Point | Reference Period |
|---|---|---|
| Global oil demand | 99.1 million bpd | Q2 2026 |
| Year-on-year demand change | -4.9% | Q2 2026 vs Q2 2025 |
| Chinese refining rate change | -18% | June 2026 vs June 2025 |
| Chinese diesel consumption | -10% year-on-year | May 2026 |
| Chinese gasoline demand | -5% year-on-year | May 2026 |
| Chinese petrochemical feedstock use | -17% year-on-year | May 2026 |
| European diesel consumption | 4.5 million bpd (-5.7% YoY) | May 2026 |
| Brent crude price | Above $90 per barrel | July 2026 |
| Brent crude price gain | +30% | Since conflict onset |
| European diesel and U.S. gasoline gain | +65% | Since conflict onset |
Demand Destruction and the Macroeconomic Transmission Mechanism
How Fuel Prices Become Economic Contraction
Energy price shocks transmit into broader economic activity through a well-understood but often underestimated mechanism. Rising fuel costs directly increase input costs for transportation, manufacturing, agriculture, and logistics. Those cost increases compress operating margins, reduce discretionary consumer spending, and trigger inventory drawdowns rather than new production cycles. The cumulative effect is a reduction in economic output that extends well beyond the energy sector itself.
The demand data from Q2 2026 reflects this transmission in action. Global oil consumption falling by nearly 5% year-on-year to 99.1 million barrels per day, based on IEA estimates, is not simply a market statistic. It represents a measurable contraction in global industrial and consumer activity of significant scale. The geopolitical market risks embedded in these figures extend far beyond the energy sector alone.
Regional Demand Destruction at a Glance
| Region | Fuel Category | Demand Change | Period |
|---|---|---|---|
| China | Diesel | -10% year-on-year | May 2026 |
| China | Gasoline | -5% year-on-year | May 2026 |
| China | Petrochemical feedstocks | -17% year-on-year | May 2026 |
| Europe | Diesel | -5.7% year-on-year | May 2026 |
The World Bank's Growth Warning
World Bank Chief Economist Indermit Gill has communicated publicly that the Iran conflict carries the potential to compress 2026 global GDP growth to as low as 1.3%, compared with 2.9% growth recorded in 2025. That projection, if realised, would represent a reduction of more than half of baseline global expansion, translating into trillions of dollars in foregone output across interconnected industrial, commercial, and consumer supply chains. Indeed, the global recession risk implicit in these figures is no longer a tail scenario but a central planning concern for policymakers.
A compression from 2.9% to 1.3% global growth is not a marginal adjustment. It is a structural inflection point driven by the compounding effects of energy cost transmission, industrial capacity constraints, and eroding consumer purchasing power across multiple major economies simultaneously.
The next major ASX story will hit our subscribers first
Remaining Workarounds and Their Limitations
India's Refining Arbitrage: A Short-Term Buffer
India has emerged as a partial mitigating factor, with refiners increasing throughput of Russian crude to capitalise on discounted pricing and partially compensate for tightening Middle Eastern supply. This represents a genuine, if modest, pressure-release mechanism. However, it is fundamentally an arbitrage strategy dependent on the continued availability of discounted Russian exports and on freight economics that could shift rapidly if sanctions enforcement or shipping constraints tighten further.
The Inventory Depletion Problem
Strategic petroleum reserves and commercial inventory buffers provided critical cushioning during the early months of supply disruption following the February conflict outbreak. The progressive drawdown of those reserves over subsequent months of sustained disruption has materially reduced the system's capacity to absorb additional shocks.
The strategic logic of petroleum reserves is precisely that they exist to bridge temporary supply gaps. Once drawn down significantly, rebuilding them requires a sustained period of supply surplus, which is precisely what the current disruption architecture makes impossible to achieve.
Scenario Outcomes Under Different Blockade Conditions
| Scenario | Probability Driver | Anticipated Market Impact |
|---|---|---|
| Partial blockade via insurance avoidance | Houthi harassment without full enforcement | Freight cost spike, moderate supply delays |
| Full functional closure | Escalated Houthi military enforcement | Severe disruption, Brent above $100 per barrel |
| Negotiated ceasefire and reopening | Diplomatic intervention | Rapid freight cost normalisation, price pullback |
| Prolonged disruption beyond three months | Sustained conflict, no diplomatic resolution | Structural demand destruction, global recession risk |
A System Built for Redundancy, Now Operating Without It
The Architecture Has Failed
The global oil trading system was explicitly designed around the assumption that alternative routes could absorb disrupted flows. Pipeline redundancies, strategic reserves, alternative shipping corridors, and diverse supplier bases were all built into the architecture precisely because individual chokepoints were known to carry geopolitical risk.
The concurrent disruption of both Hormuz and Bab el-Mandeb collapses that assumption entirely. No major alternative route exists at scale. The Cape of Good Hope detour is technically viable but economically and logistically unsustainable as a long-term substitute for the trillions of dollars in annual trade value that these two straits collectively facilitate. Furthermore, the oil price movements now visible in futures markets are already pricing in an extended period of structural disruption rather than a temporary spike.
The Geopolitical Feedback Dynamic
There is a deeper strategic dimension to the Bab el-Mandeb blockade and Red Sea oil route crisis that extends beyond the immediate market disruption. Each successful interdiction of a major maritime energy corridor validates the use of that strategy as a geopolitical pressure instrument. The demonstrated effectiveness of Houthi maritime harassment in altering global shipping patterns creates a precedent that other regional actors, operating near the Strait of Malacca, the Turkish Straits, or other critical maritime corridors, will not fail to observe.
The monitoring priorities for analysts and investors tracking this situation include:
- The intensity and enforcement capability of the Houthi blockade relative to international naval coalition responses
- Chinese refinery throughput recovery as a leading indicator of Asian demand stabilisation and market normalisation
- Strategic petroleum reserve release decisions from the United States, IEA member states, and Gulf producers
- The freight rate and war-risk insurance premium trajectory as real-time indicators of commercial route viability
- Diplomatic developments relating to any extension or formalisation of the U.S.-Iran ceasefire framework signed on June 17
The compounding disruption chain now running from Hormuz closure through Saudi Red Sea rerouting to Bab el-Mandeb blockade through Cape of Good Hope detour costs through refining capacity constraints through fuel price inflation to demand destruction and macroeconomic contraction represents something more significant than a sequence of individual crises. It represents the progressive exhaustion of every adaptive mechanism the global energy system possesses.
With inventory buffers drawn down, refinery capacity constrained, alternative routes carrying extreme cost penalties, and major economies already registering measurable demand destruction, the margin for further disruption is vanishingly thin. The Bab el-Mandeb blockade and Red Sea oil route crisis is not one problem added to many others. It is the removal of the last functional redundancy from a system that has already used up every other available buffer.
Frequently Asked Questions: Bab el-Mandeb Blockade and Red Sea Oil Route
How much oil transits Bab el-Mandeb under normal conditions?
Approximately 4.1 to 4.2 million barrels per day of oil and petroleum products move through the Bab el-Mandeb Strait during normal operations, accounting for roughly 5% of total global seaborne oil trade.
Why has Bab el-Mandeb become more strategically important since the conflict began?
The effective disruption of the Strait of Hormuz, which previously facilitated approximately 20% of global energy flows, forced Saudi Arabia to reroute crude exports through its Red Sea coastline. This elevated Bab el-Mandeb from a secondary transit corridor to the primary delivery pathway for Middle Eastern crude reaching Asian markets.
What are the alternatives when tankers avoid Bab el-Mandeb?
Vessels face two practical alternatives: transiting the Suez Canal with the constraint that VLCCs must partially discharge cargo due to depth restrictions, or circumnavigating Africa via the Cape of Good Hope, adding a minimum of four weeks to voyage times with substantial additional freight and insurance costs.
How have oil and fuel prices responded to the blockade?
Brent crude has risen above $90 per barrel, while European diesel and U.S. gasoline prices have increased approximately 65% since the conflict began, significantly outpacing the roughly 30% gain in crude itself, reflecting severe refining capacity constraints.
What is the difference between a declared blockade and a full physical closure?
A declared blockade operates primarily through commercial insurance markets. When underwriters classify a route as a war zone, prohibitive premium costs render transit economically unviable even if the strait remains physically passable. A full closure requires active military enforcement preventing physical transit.
How much has global oil demand declined?
According to IEA estimates, global oil demand fell by nearly 5% year-on-year in Q2 2026, declining to 99.1 million barrels per day, with the most severe demand destruction concentrated in Asia and Europe.
Want to Stay Ahead of Commodity Market Disruptions Like the Red Sea Crisis?
As geopolitical shocks reshape global energy flows and ripple across commodity markets, Discovery Alert's proprietary Discovery IQ model delivers real-time ASX mineral discovery alerts, instantly translating complex market signals into actionable investment opportunities for both short-term traders and long-term investors. Explore how historic discoveries have generated substantial returns by visiting Discovery Alert's dedicated discoveries page, and begin your 14-day free trial today to position yourself ahead of the next major market move.