August 8, 2026

The Productivity Revolution Quietly Reshaping American Drilling Economics
Few dynamics in the global energy complex are as misunderstood as the relationship between rig count and actual production output. A casual observer might assume that fewer rigs drilling today means less oil tomorrow, and that the reverse is equally true. In practice, the modern shale era has fundamentally broken this linear logic. As US oil production trends demonstrate, the United States now extracts more crude per active rig than at any point in its drilling history, which means that reading weekly rig data requires far more interpretive nuance than a simple count of active units.
Understanding this context is essential before examining what the latest Baker Hughes figures actually signal for American oil output, global supply balances, and the energy market landscape heading into the final months of 2026.
When big ASX news breaks, our subscribers know first
What the Baker Hughes Rig Count Actually Measures
Every Friday, Baker Hughes releases its weekly rig count, a dataset tracking the number of drilling rigs actively exploring for or developing oil and gas reserves across the United States. The report segments activity into three primary categories: oil-directed rigs, gas-directed rigs, and a miscellaneous category covering rigs not strictly targeting either commodity.
The data functions as a leading indicator rather than a real-time production measure. Because newly drilled wells typically take between three and nine months to reach first production, today's rig count provides a forward-looking signal about supply volumes six to eighteen months into the future. This is precisely why institutional investors, OPEC analysts, crude traders, and energy economists treat the Friday release as one of the most market-sensitive weekly data points in the commodity universe.
Breaking Down the Latest Weekly Figures
The most recent Baker Hughes report covering the week ending July 31, 2026, delivered a headline total rig count of 588 units, unchanged from the prior week but 49 rigs above the equivalent period in 2025.
| Rig Category | Current Count | Week-over-Week Change | Year-over-Year Change |
|---|---|---|---|
| Oil Rigs | 454 | +3 | +43 |
| Gas Rigs | 124 | -3 | +1 |
| Miscellaneous Rigs | 10 | 0 | N/A |
| Total U.S. Rig Count | 588 | Flat | +49 |
The flat headline obscures a meaningful divergence occurring beneath the surface. Oil-directed drilling activity expanded by 3 units, while gas-directed activity contracted by an equivalent amount. The net result appears neutral, but the underlying signal is directionally bullish for crude production and cautiously soft for natural gas output.
A year-over-year increase of 43 oil rigs confirms that the recovery in oil-directed drilling is sustained rather than episodic. With oil rigs now at 454, the trajectory for U.S. crude production in late 2026 and into 2027 is pointed modestly upward, barring significant price disruption or capital reallocation.
Why US Oil Drillers Add Rigs Despite Price Volatility
The decision by US oil drillers to add rigs even as crude oil price trends showed a meaningful weekly correction requires explanation. WTI crude was trading at approximately $78.21 per barrel at the time of the report, with Brent at $83.55 per barrel, representing gains on the day but a decline of roughly $6 per barrel compared to the prior week.
The key to understanding operator behaviour lies in breakeven economics rather than spot price movements.
Most operators in the Permian Basin maintain well-level breakeven costs in the range of $40 to $55 per barrel, according to widely cited industry estimates. At current WTI prices, this leaves a drilling margin of between $23 and $38 per barrel, which is sufficient to justify sustained capital deployment even in a softening price environment.
Several structural forces are supporting drilling activity at current price levels:
- Hedging programmes allow producers to lock in prices months in advance, insulating drilling budgets from short-term volatility
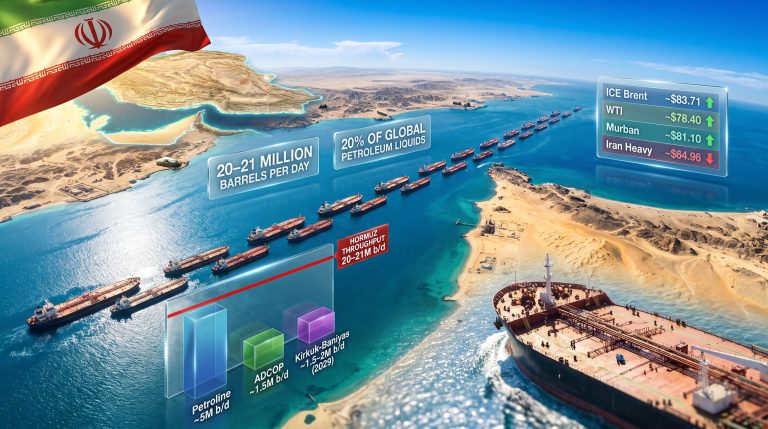
- Geopolitical risk premiums embedded in Brent pricing reflect escalating Middle East tensions, including Houthi attacks on commercial vessels and disruptions affecting tanker traffic through the Strait of Hormuz
- Long-term contract commitments with oilfield services companies make it economically inefficient to release rigs in response to temporary price dips
- Operator consolidation across major basins has created larger, lower-cost producers capable of sustaining activity at price levels that would have forced smaller operators to cut
The Strait of Hormuz situation deserves particular attention. Furthermore, ADNOC has reported multiple vessel attacks in the region, and tanker traffic through the strait has fallen to multi-month lows. This geopolitical backdrop, explored further in our oil geopolitics analysis, embeds a structural premium into oil prices that provides an indirect incentive for U.S. producers to expand domestic output.
Where the Rigs Are Going: A Basin-Level Breakdown
Permian Basin: Undisputed Epicenter of U.S. Oil Growth
The Permian Basin in West Texas and southeastern New Mexico continued to dominate U.S. drilling activity, with the active rig count rising by 3 during the reporting period to reach 263 rigs. This figure is 7 rigs above year-ago levels and represents approximately 45% of all U.S. oil-directed drilling activity.
What makes the Permian's continued expansion notable is that it is occurring in a fundamentally different operating environment than the basin's previous growth phases. Modern Permian wells are being drilled with lateral lengths frequently exceeding 15,000 feet, compared to the 5,000 to 7,000-foot laterals common during the 2014 shale boom.
Multi-well pad drilling has also compressed per-barrel costs significantly, allowing operators to extract more resource per surface location and per dollar of capital invested. Infrastructure improvements in water management, gas gathering, and takeaway capacity have further reduced the operational friction that constrained earlier growth phases.
Eagle Ford: A Steady Complementary Engine
The Eagle Ford Shale in South Texas held its rig count flat at 49 active rigs during the reporting period, representing no week-on-week change. However, the basin is running 11 rigs above the same point in 2025, reflecting a meaningful recovery from prior-year activity levels.
The Eagle Ford produces predominantly light sweet crude grades that are particularly valued by Gulf Coast refineries and export terminals. While the basin has lost some capital allocation to the Permian over the past several years, ongoing operator consolidation has improved drilling efficiency to the point where fewer rigs are needed to maintain comparable output.
Gas-Directed Basins Losing Ground
The 3-unit decline in gas rigs reflects ongoing softness in natural gas pricing, which has weighed on activity in gas-directed basins including the Haynesville in Louisiana and parts of the Anadarko Basin in Oklahoma. The DJ Basin and Bakken in North Dakota have also seen modest reductions in rig deployment relative to their post-COVID recovery peaks.
This gas-to-oil rotation within the total rig count is a recurring pattern during periods when oil prices hold above driller breakeven thresholds while gas prices remain subdued.
U.S. Crude Production: Translating Rigs Into Barrels
The most important validation of any rig count analysis is whether drilling activity is actually converting into production volumes. The latest Energy Information Administration data confirms that it is.
U.S. crude oil production averaged 13.804 million barrels per day in the week ending July 31, 2026, increasing from 13.796 million bpd the prior week. Year-over-year production growth stands at approximately 520,000 bpd, a volume increment large enough to move global supply-demand balances in a market where OPEC's market influence is measured in similar increments.
This output level positions the United States as the world's largest crude producer by a widening margin, maintaining a lead over Saudi Arabia and Russia that has expanded considerably since 2022.
The DUC Inventory Factor
One underappreciated element of U.S. production dynamics involves the inventory of Drilled but Uncompleted (DUC) wells. These are wellbores that have been drilled but not yet hydraulically fractured and connected to production infrastructure. DUC inventories function as a production buffer, allowing operators to accelerate output without deploying additional drilling rigs simply by completing wells already in the ground.
During periods of price strength, operators draw down DUC inventories to bring production online quickly. During price weakness, DUC inventories build as operators defer completions. This mechanism partially explains why the relationship between rig count and production output is non-linear in the modern shale era.
What the Frac Spread Count Adds to the Picture
Drilling activity and completion activity are distinct phases of the well lifecycle, and analysing both simultaneously provides a more complete picture of near-term production trends. The Baker Hughes rig count captures drilling activity, but the Primary Vision Frac Spread Count tracks the completion side of the equation.
For the week ending July 31, 2026, the frac spread count declined by 4 crews to reach 194 active completion crews, following a gain of 2 crews the prior week.
| Metric | Current Reading | Week-over-Week | Implication |
|---|---|---|---|
| Baker Hughes Oil Rigs | 454 | +3 | Drilling activity expanding |
| Baker Hughes Gas Rigs | 124 | -3 | Gas drilling softening |
| Total U.S. Rig Count | 588 | Flat | Sector rotation underway |
| Frac Spread Count | 194 crews | -4 | Completion pace easing |
| U.S. Crude Production | 13.804M bpd | +8,000 bpd | Output near record levels |
The combination of rising oil rigs alongside a declining frac spread count introduces a nuanced near-term signal. More wells are being drilled, but fewer are being completed per week. If this divergence persists, it could indicate a building DUC inventory that may translate into a production surge once completion activity reaccelerates.
The next major ASX story will hit our subscribers first
Capital Discipline: Why This Cycle Is Structurally Different
Perhaps the most important contextual factor for understanding why US oil drillers add rigs at a measured pace rather than aggressively is the capital discipline framework that now governs the industry. Following the 2020 pandemic collapse, investor pressure on public E&P companies shifted decisively toward prioritising free cash flow generation, dividend payments, and share buyback programmes over production growth for its own sake.
This represents a permanent structural shift from the 2011 to 2014 shale boom era, when operators deployed capital aggressively in pursuit of production volume regardless of returns. Today's publicly listed producers operate under analyst and institutional investor mandates that effectively cap drilling budgets at levels consistent with return-focused capital allocation.
Consequently, the US drilling activity decline from historical peaks now reflects disciplined strategy rather than distress, a distinction that fundamentally changes how market participants should interpret weekly rig count movements.
How Current Activity Compares to Historical Cycle Peaks
| Period | Peak U.S. Rig Count | Context |
|---|---|---|
| 2014 Pre-Crash Peak | ~1,900 rigs | Shale boom, growth-at-any-cost era |
| 2016 Cycle Trough | ~404 rigs | Post-crash recovery low |
| 2018-2019 Recovery Peak | ~1,050 rigs | Partial rebound, pre-COVID |
| 2020 COVID Trough | ~244 rigs | Pandemic demand collapse |
| 2022-2023 Post-COVID Recovery | ~780 rigs | Post-pandemic rebound |
| August 2026 Current | 588 rigs | Measured recovery, capital discipline era |
The current 588-rig environment producing 13.8 million bpd would have been mathematically impossible during the 2014 peak, when approximately 1,900 rigs were needed to sustain comparable volumes. This productivity improvement reflects the cumulative effect of longer laterals, improved completion designs, better reservoir targeting using 3D seismic and machine learning tools, and multi-well pad efficiencies.
Risk Factors That Could Reverse the Trend
No analysis of the U.S. rig count trajectory would be complete without acknowledging the downside scenarios that could interrupt current momentum. Three primary risk categories deserve attention:
-
Oil price deterioration: A sustained decline in WTI below approximately $65 to $70 per barrel would compress drilling margins across most U.S. shale basins to levels where rig releases become economically rational. OPEC+ production increases, particularly any accelerated unwinding of voluntary output cuts, represent the most credible mechanism for such a price decline.
-
Oilfield services constraints: High-specification drilling rigs and pressure pumping equipment remain in limited supply. Cost inflation in oilfield services, combined with skilled labour shortages in high-activity regions like the Permian Basin, creates a ceiling on how rapidly drilling activity can scale even if operators wanted to accelerate. As Reuters reports, this services bottleneck has been a recurring constraint throughout recent recovery cycles.
-
Demand-side weakness: Slowing Chinese crude imports, European economic deceleration, and broader global growth headwinds could suppress oil demand expectations and reduce the price support that currently underpins drilling economics.
This article contains forward-looking analysis and market projections based on publicly available data. Energy market forecasts are inherently uncertain and subject to revision based on geopolitical, macroeconomic, and commodity price developments. Nothing in this article constitutes investment advice.
Frequently Asked Questions
What is the Baker Hughes rig count and why does it matter?
The Baker Hughes rig count is a weekly survey of active drilling rigs operating across the United States, published every Friday. It functions as one of the most widely tracked leading indicators in energy markets because changes in drilling activity today predict changes in oil and gas production volumes six to eighteen months in the future. According to Energy Now, the report has consistently influenced short-term crude price movements upon release.
How many oil rigs are currently active in the United States?
As of the latest reporting period, 454 oil rigs were active across the United States, representing a gain of 3 units week-on-week and a year-over-year improvement of 43 units.
Which U.S. basin has the most active drilling rigs?
The Permian Basin leads with 263 active rigs, accounting for nearly 45% of all U.S. oil-directed drilling. The Eagle Ford holds second position with 49 rigs, operating well above year-ago levels.
What does a rising rig count mean for oil prices?
More rigs drilling today means more production supply entering the market six to eighteen months from now. All else equal, this exerts downward pressure on prices over the medium term. However, the time lag involved, the DUC inventory buffer, and the current capital discipline constraints on rig additions mean that the supply response from today's rig additions will be gradual rather than sudden.
How does U.S. production at 13.8 million bpd affect global markets?
At 13.804 million bpd, U.S. crude production exceeds the output of any single OPEC+ member. Year-over-year growth of 520,000 bpd represents a supply increment large enough to meaningfully offset production cuts by mid-tier OPEC producers. The United States has effectively become a swing producer capable of responding to price signals faster than conventional OPEC members due to the relatively short lead times involved in shale drilling and completion.
Want to Stay Ahead of the Next Major Mineral Discovery on the ASX?
While US drilling economics are reshaping global energy markets, significant mineral discoveries on the ASX can generate equally compelling opportunities — and timing is everything. Discovery Alert's proprietary Discovery IQ model delivers real-time alerts the moment a significant ASX mineral discovery is announced, turning complex geological data into actionable insights for traders and investors at every level; explore historic discovery returns to understand the potential, and begin a 14-day free trial at Discovery Alert to position yourself ahead of the broader market.