
June 27, 2026
The Transmission Chain Most Precious Metals Investors Never See
When global capital markets shift, the movement rarely originates where most investors are watching. The loudest signals tend to come from the Federal Reserve, but some of the most consequential forces shaping Bank of Japan rate hike and gold prices in 2025 and 2026 have been quietly assembling in Tokyo. Understanding why requires tracing a transmission chain that runs from Japanese government bond yields through US Treasury markets, into real yield calculations, and ultimately into the price of gold and silver.
This is not a simple story about one central bank raising rates. It is a story about interconnected capital flows, structural fiscal risk, and what history consistently tells us about gold during periods when central banks are trapped between inflation and financial stability. Furthermore, understanding gold-bond dynamics is essential to grasping how these pressures play out across precious metals.
When big ASX news breaks, our subscribers know first
Why Japanese Monetary Policy Moves Gold Without Anyone Noticing Until It Does
The Capital Flow Mechanism Behind the Headline
Japan holds the largest foreign position in US Treasury securities of any nation. That single fact transforms what might otherwise appear to be a domestic Japanese monetary policy decision into a global market event with direct implications for precious metals pricing.
The logic runs as follows: when yields on Japanese Government Bonds rise and begin to compete more meaningfully with returns available on US debt, Japanese institutional investors face an incentive to repatriate capital. That repatriation reduces demand for US Treasuries, which pushes Treasury prices lower and US yields higher. Rising US real yields then create a structural headwind for gold, which generates no income and therefore becomes comparatively less attractive as real rates on competing instruments climb.
This is the indirect transmission mechanism. It does not move gold through a single visible catalyst. It moves gold through a recalibration of global capital allocation that builds over weeks and months before the market reacts visibly. The relationship between gold and bond markets is, consequently, one of the most important dynamics for precious metals investors to monitor.
The Yen Carry Trade: A Mechanism Worth Understanding
The yen carry trade has been one of the most significant structural forces in global financial markets for decades. In its simplest form, investors borrow in Japanese yen at low interest rates and deploy that capital into higher-yielding assets elsewhere, including US Treasuries, equities, and commodities like gold.
When the Bank of Japan raises rates, two things happen simultaneously. The yen strengthens as rate differentials compress, and the cost of maintaining carry trade positions rises. Investors who have been borrowing cheaply in yen to fund long positions in other assets begin unwinding those positions. The unwinding process creates selling pressure across multiple asset classes, often rapidly.
The May 19th silver selloff, which saw silver drop approximately 5% in roughly 30 minutes during early trading, provided a live demonstration of how quickly precious metals can respond to yield-driven positioning shifts. Silver's smaller market capitalisation and dual role as both a monetary and industrial metal make it consistently more reactive than gold in both directions during these events.
What Current Bond Market Conditions Are Signalling
The Term Premium: Understanding the Real Driver of Long-Term Yields
The term premium is the additional return investors demand to hold a long-dated bond rather than continuously rolling over shorter-duration instruments. When fiscal uncertainty or inflation risk increases, this premium expands, and it currently accounts for more than half of where the US 10-year yield is positioned.
This distinction matters enormously for gold investors. Most commentary focuses on the headline yield number, but the composition of that yield tells a more nuanced story. A yield driven higher by a rising term premium is structurally different from one driven by aggressive central bank tightening.
A rising term premium reflects growing investor concern about long-term inflation and the sustainability of US fiscal deficits. That concern is, over a multi-year horizon, a structural tailwind for gold. Investors demanding a higher premium to lock their capital into 10 or 30-year US government bonds are implicitly acknowledging that they are not fully confident in long-term fiscal or monetary stability. That environment is historically one of gold's strongest.
In the short term, however, capital rotating into bond markets to capture rising real yields creates near-term selling pressure on gold. The bond market is simultaneously telling two stories: structural risk is building (bullish for gold over years), while capital is moving toward yield-bearing instruments (bearish for gold in the near term).
Key Yield Metrics at a Glance
| Metric | Current Level | Historical Context |
|---|---|---|
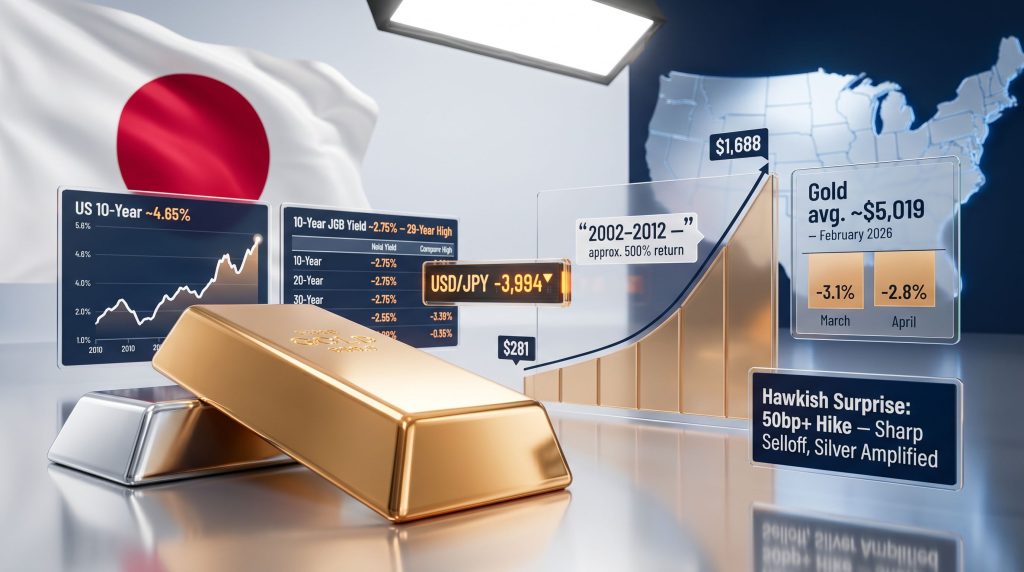
| 10-Year JGB Yield | ~2.75% | 29-year high |
| US 10-Year Treasury Yield | ~4.65% | Multi-year elevated range |
| US 30-Year Treasury Yield | At 18-year high | Structural fiscal premium building |
| BoJ Policy Rate (April 2026 hold) | 0.75% | Highest since September 1995 |
| Fed Funds Futures (Dec. hike probability) | ~50% | Driven by April CPI at 3.8% |
The 10-year JGB yield reaching approximately 2.75%, a level not seen in 29 years, marks a genuine structural inflection point. For decades, Japanese institutional investors operated in an environment where domestic yields were negligible, making foreign bond holdings, particularly US Treasuries, virtually the only path to meaningful fixed-income returns. That calculus is changing, and the ripple effects are only beginning to register across global asset prices.
The Bank of Japan's April 2026 vote to hold rates at 0.75% came in at a 6-3 split, with three members already advocating for a hike. That dissent is a meaningful signal. Divided votes at major central banks rarely remain divided for long before the minority position becomes the consensus.
A Scenario Framework for Gold Around Central Bank Meetings
Short-Term: The Bearish Pressure Points
Several reinforcing forces could create near-term gold headwinds around the June Bank of Japan meeting and the Federal Reserve's subsequent dot plot release:
- Rising JGB yields draw Japanese institutional capital back toward domestic bonds, reducing Treasury demand
- Lower Treasury prices push US yields higher, intensifying real yield competition with non-yielding gold
- A strengthening yen reduces gold's appeal in yen-denominated terms for Japanese investors
- Leveraged long positions built up over a 14-month period of nearly uninterrupted gold appreciation become vulnerable to rapid unwinding
- Silver, as the higher-beta precious metal, would be expected to move harder and faster in either direction
Medium-Term: Where the Story Becomes More Complex
Over a 6 to 18-month horizon, the analysis becomes considerably less straightforward. Not all rate hike environments are equally negative for gold. The key distinction lies in whether a hike reflects controlled monetary tightening or an acknowledgement of deeper financial stress.
Markets price expectations, not outcomes. If a Bank of Japan rate hike is fully anticipated, the gold price reaction is likely to be muted. The real risk lies in the magnitude of the surprise, whether a larger-than-expected hike or an unexpectedly hawkish Federal Reserve statement compounds downside pressure within a compressed 48-hour window.
Scenario Map: Gold Price Reactions Around the June BoJ Meeting
| Scenario | BoJ Action | Fed Signal | Likely Gold Reaction |
|---|---|---|---|
| Baseline | 25bp hike (priced in) | Neutral dot plot | Minimal movement |
| Hawkish Surprise | 50bp+ jumbo hike | Hawkish tilt | Sharp selloff, silver amplified |
| Dovish Hold | No hike | Rate cut signals | Gold rally |
| Mixed Signal | Hold with hawkish language | December hike more likely | Moderate downside |
| Risk-Off Shock | Any action + market stress | Uncertainty | Short dip, safe-haven recovery |
The Federal Reserve's dot plot release is scheduled two days after the June Bank of Japan meeting. That compressed timeline means markets could be absorbing two major central bank signals within 48 hours, amplifying volatility potential in both directions for gold and silver holders.
The Federal Reserve's No-Win Situation and What It Means for Gold
Supply-Side Inflation Cannot Be Fixed With Rate Hikes
April CPI came in at 3.8%, driven predominantly by rising oil costs. This is a critical distinction that tends to get lost in headline commentary. The Federal Reserve's policy toolkit was designed to address demand-side inflation, the classic scenario where excess money supply drives prices higher by pushing too much spending against too few goods. It was not designed to address supply shocks.
Oil price increases driven by geopolitical disruption or supply constraints are not responsive to interest rate changes. Raising rates does not produce more oil. It does, however, raise borrowing costs across the entire economy, including in sectors already facing structural stress.
The Refinancing Wall That Constrains Policy
A significant volume of private equity and commercial real estate debt, originally issued during the period of historically low interest rates, faces refinancing within approximately the next 18 months. Fund managers, banking executives, and prominent business leaders have publicly identified this refinancing cliff as a top systemic risk. A rate hike in the current environment would directly compound stress across these leveraged structures.
Variable-rate commercial debt structures create a refinancing cliff concentrated in the 2026 to 2027 window. The new Federal Reserve Chair, who assumed the role on May 13th, has publicly stated a preference for rate reductions over increases. While central bank independence means stated preferences do not guarantee policy outcomes, the institutional starting point has shifted in a way that modestly reduces the probability of aggressive tightening.
The Fed's Constrained Policy Menu
The Fed currently faces two paths, neither of which is politically or economically clean:
Option A: Hike rates. This demonstrates anti-inflation credibility but does nothing to address the underlying oil-driven price pressure, worsens the refinancing stress in commercial real estate and private credit markets, and risks triggering a credit event in leveraged sectors.
Option B: Hold rates. This avoids compounding the refinancing cliff but risks allowing inflation to persist long enough that expectations anchor at a higher level, undermining the Fed's credibility in a different way.
The least expensive near-term path, from a political and systemic risk perspective, is a combination of incremental signalling tools and forward guidance designed to appear active while buying time for the underlying supply shock to resolve. This kind of policy ambiguity, where neither path is clearly chosen, is historically one of gold's most supportive environments.
What History Tells Us About Gold in These Conditions
The 1970s Oil Shock: A Structural Parallel
The 1973 Arab oil embargo created a situation with striking parallels to today. A supply-side energy shock drove inflation higher while simultaneously constraining the Fed's ability to use its traditional demand-management tools without causing severe economic damage. The result was a decade in which gold moved from $35 per troy ounce to over $850, representing one of the most dramatic secular appreciation cycles in the metal's modern history.
The lesson from that period is not that gold always performs well when inflation rises. It is that gold performs especially well when central banks are structurally constrained, when the tools available are mismatched to the problem, and when investors cannot clearly identify a policy path that resolves the underlying tension.
The 2002 to 2012 Bull Market: Corrections Inside Secular Uptrends
Gold's behaviour during the last major bull cycle provides important context for investors assessing current conditions. Gold moved from approximately $281 per troy ounce in January 2002 to an average of $1,688 per troy ounce in 2012, representing a return of approximately 500% across 11 years.
What that statistic conceals is equally important. During that decade-long run, approximately 34% of monthly prints were negative, meaning prices were lower than the prior month on more than one in three occasions. Single-month drawdowns were sometimes severe:
| Period | Drawdown Magnitude | Context |
|---|---|---|
| June 2006 | -11.7% (single month) | Mid-cycle correction |
| August 2008 | -10.7% (single month) | Global liquidity crisis |
| 2008 full year | Extended multi-month selloff | Sold alongside all risk assets |
| Post-2008 recovery | +100% over approximately 3 years | Structural fundamentals reasserted |
Gold was sold off during the 2008 global liquidity crisis alongside virtually every other asset class. It then proceeded to double over the following three years as structural fundamentals reasserted themselves. The cycle did not end because of a sharp correction. The correction was part of the cycle.
Current Conditions in Historical Context
Gold averaged approximately $5,019 per troy ounce in February 2026. March's average was down 3.1% from that level, and April came in 2.8% below March. If June were to land somewhere in the low $4,000s, that would represent a 15 to 20% peak-to-trough correction from the February high, which is sharp but falls well within the range of corrections that occurred inside the 2002 to 2012 bull market without interrupting the broader trend.
Critically, gold recorded only a single negative monthly print across the 14-month period from January 2025 through February 2026, and that single negative print was less than half a percent. Extended unidirectional runs of that duration create a specific structural risk: they attract leveraged momentum positioning that can amplify selling when a reversal begins.
The next major ASX story will hit our subscribers first
The Structural Pillars That Have Not Changed
Why the Long-Term Case Remains Intact
Regardless of near-term volatility around central bank meetings, the macro conditions that drove gold's appreciation from 2023 through 2026 remain in place. Furthermore, the role of central banks and precious metals in driving structural demand continues to be a foundational element of the long-term bullish case:
- US sovereign debt continues to grow without meaningful fiscal consolidation
- Congressional spending patterns show no credible path toward deficit reduction
- Inflation is proving structurally persistent rather than transitory
- International central bank gold demand continues at robust levels as reserve diversification accelerates
- The term premium on long-dated US Treasuries continues to reflect growing concern about fiscal sustainability
A Bank of Japan rate hike and gold prices shock driven by a hawkish Federal Reserve signal could produce an uncomfortable June for gold holders. It would not, based on current evidence, represent a reversal of the secular conditions that have underpinned the multi-year appreciation cycle. In addition, a review of gold bull market catalysts reinforces why the structural case for gold remains compelling beyond near-term central bank volatility.
Frequently Asked Questions
Does a Bank of Japan rate hike always push gold prices lower?
Not automatically. The impact depends heavily on whether the hike was anticipated. A fully priced-in hike typically produces a muted gold reaction because the market has already adjusted. A surprise hike of greater-than-expected magnitude creates more significant downside pressure through the carry trade unwind and yield differential channels described above.
How does Japan's US Treasury position connect to gold prices?
Japan holds the largest foreign position in US Treasuries. When domestic Japanese yields rise and become more competitive with US debt returns, Japanese institutional investors face an incentive to repatriate capital. Reduced Treasury demand pushes US yields higher, which increases real yield competition with non-yielding gold. Consequently, monitoring gold-silver ratio analysis can also help investors gauge relative safe-haven demand during these periods.
What is the term premium and why should gold investors understand it?
The term premium is the additional return investors demand for holding long-dated bonds rather than rolling over short-term instruments. A rising term premium signals growing concern about long-term inflation or fiscal sustainability, which is a long-term structural tailwind for gold even while it creates short-term selling pressure as capital rotates toward yield-bearing assets.
Why does silver move more sharply than gold around central bank events?
Silver has a smaller market capitalisation than gold and functions simultaneously as a monetary metal and an industrial commodity. This combination produces higher sensitivity to risk sentiment shifts, yield movements, and liquidity conditions. In yield-driven selloffs, silver historically moves faster and further than gold in both directions.
Could gold still rise even if the Bank of Japan hikes rates?
Yes, particularly over a medium to longer time horizon. If the hike reflects broader monetary uncertainty or is accompanied by signals that the Fed faces constrained policy options, gold can absorb the initial yield shock and resume its longer-term trend as structural fundamentals reassert themselves. The Bank of Japan rate hike and gold prices relationship, as historical precedent from the 2002 to 2012 bull market strongly suggests, does not follow a simple inverse correlation over multi-year cycles.
This article is intended for informational and educational purposes only and does not constitute financial advice or a recommendation to buy or sell any security or commodity. All forecasts, projections, and historical comparisons involve inherent uncertainty. Past performance of gold, silver, or any asset class does not guarantee future results. Investors should conduct their own due diligence and consult a licensed financial adviser before making investment decisions.
Want to Identify ASX Mineral Discoveries Before the Broader Market Reacts?
While macroeconomic forces like Bank of Japan rate decisions and US Treasury yield movements shape the broader precious metals landscape, Discovery Alert's proprietary Discovery IQ model cuts through the complexity by delivering real-time alerts on significant ASX mineral discoveries — instantly translating over 30 commodities into a single, actionable gold-equivalent metric. Explore historic discovery returns on Discovery Alert's dedicated discoveries page and begin a 14-day free trial to position yourself ahead of the market.