May 15, 2026
The Quiet Mispricing at the Heart of the Critical Minerals Market
Across financial history, the most durable valuation gaps tend to emerge not from flawed fundamentals but from structural friction in how capital flows. Familiarity, mandate constraints, and narrative accessibility shape institutional allocation decisions far more than raw commodity performance data. Understanding this psychological and structural gap is the essential starting point for evaluating why battery metals royalties undervalued conditions have persisted even as critical minerals demand fundamentals strengthen considerably.
The royalty business model itself is neither new nor speculative. What is genuinely underappreciated is how powerfully that model transfers to battery and critical minerals exposure, and why the capital recognition of this transfer has been so slow to materialise.
When big ASX news breaks, our subscribers know first
The Royalty Mechanism: Passive Leverage Without Operational Exposure
How Net Smelter Return Royalties Generate Value Over Time
A net smelter return royalty entitles the holder to a fixed percentage of gross revenue generated by a mine's production, calculated after deducting smelting and refining costs. The royalty holder contributes upfront capital to the mining operator in exchange for this perpetual revenue entitlement, then receives passive cash flow for the life of the mine without bearing any share of ongoing operating costs, sustaining capital expenditure, or mine management obligations.
This structure creates an asymmetric return profile. If the underlying mine expands production, discovers additional resource, or benefits from commodity price appreciation, the royalty holder captures a proportional revenue uplift without deploying additional capital. Conversely, if operating costs escalate, the royalty holder is fully insulated because their entitlement is calculated before operational expenses are deducted.
Streaming Agreements Versus Royalties: An Important Distinction
While streaming and royalty agreements are frequently grouped together, they operate through distinct mechanics that investors should understand:
- Royalties: The mining operator retains physical production; the royalty holder receives a percentage of revenue post-processing deductions. No physical commodity changes hands between royalty holder and operator.
- Streaming agreements: The streaming company advances capital upfront; the operator delivers an agreed volume of physical metal (typically silver or gold) at a predetermined price, usually set well below prevailing spot rates, often in the range of 10–30% of spot value.
Both structures allow operators to raise capital without issuing equity or taking on conventional debt, preserving shareholder dilution capacity for later-stage needs. For the capital provider, both offer leveraged exposure to production growth at a fraction of the cost of building or acquiring mines outright.
Why Operators Use Royalties to Unlock Capital
Mining operators increasingly favour royalty financing for several structural reasons:
- Non-dilutive: Royalties do not require issuing new shares, preserving existing shareholders' equity positions.
- By-product monetisation: Operators can unlock capital from secondary commodities that represent only a minor fraction of total revenue, converting otherwise idle value into development funding.
- Balance sheet optimisation: Royalty proceeds can retire legacy debt at favourable terms, reducing interest burden and improving credit metrics.
- Development runway: Capital raised through royalties can fund exploration, feasibility studies, and construction without triggering equity market dilution.
Landmark Precious Metals Deals Reveal the Depth of Institutional Appetite
The $670 Million Silver Stream Transaction
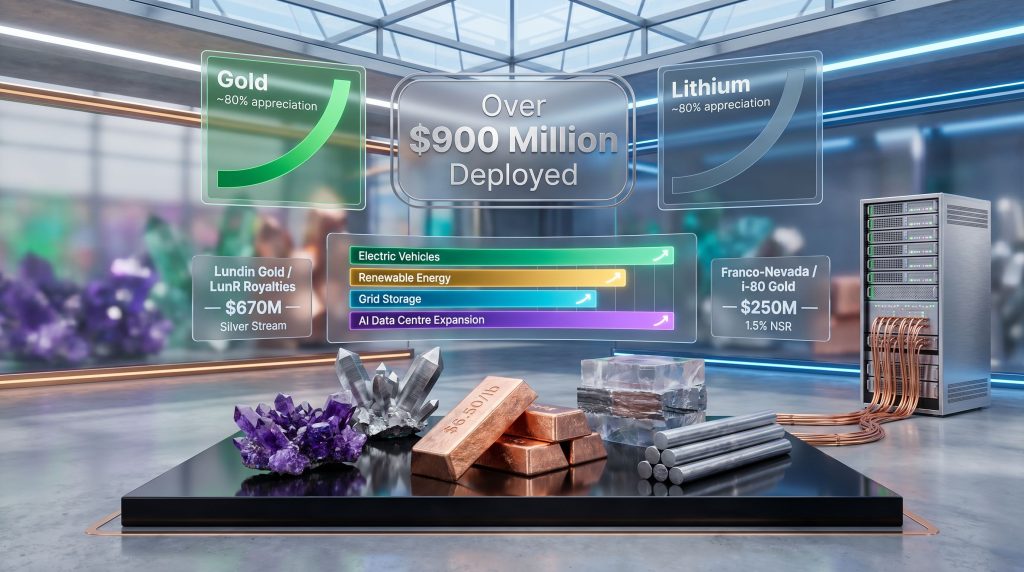
In February 2026, Lundin Gold announced a proposed transaction with LunR Royalties valued at $670 million, representing one of the most significant royalty and streaming deals in recent memory. The structure involves Lundin Gold selling a silver stream on its Fruta del Norte mine in Ecuador in exchange for newly issued LunR Royalties shares, which Lundin Gold intends to distribute to its own shareholders as a dividend-in-kind.
The transaction structure is layered:
- Tier 1: LunR receives 100% of payable silver from Fruta del Norte until 12.2 million ounces have been delivered
- Tier 2: Entitlement steps down to 50% until a further 7.8 million ounces are delivered
- Tier 3: Reduces to 7.5% of payable silver for the remaining mine life
Lundin Gold receives ongoing payments starting at 10% of the silver spot price, rising to 20% and then 30% as successive thresholds are met. What makes this transaction strategically insightful is the commodity being streamed: silver represents only 1–2% of Lundin Gold's total revenue. The company is effectively monetising a minor by-product at considerable scale, converting an asset that barely registers on its income statement into substantial financing capital, while preserving full gold exposure at Fruta del Norte.
Franco-Nevada's $250 Million NSR Agreement with i-80 Gold
In March 2026, i-80 Gold closed a $250 million royalty financing agreement with Franco-Nevada. Under the terms, Franco-Nevada received a 1.5% life-of-mine NSR royalty across all mineral properties in i-80 Gold's portfolio, with a step-up mechanism to 3.0% from January 1, 2031. The proceeds were applied to retire legacy debt obligations including secured convertible debentures and obligations held by Orion Mine Finance, with remaining capital directed toward Nevada development projects including Mineral Point and Archimedes.
| Deal | Announced/Closed | Value | Commodity | Structure |
|---|---|---|---|---|
| Lundin Gold / LunR Royalties | February 2026 (proposed) | $670M | Silver by-product | Stream-for-equity |
| i-80 Gold / Franco-Nevada | March 2026 (closed) | $250M | Gold (NSR) | Life-of-mine royalty, step-up |
These two transactions collectively represent over $900 million in precious metals royalty and streaming capital deployed within approximately a three-month window in early 2026. The scale and velocity of this deployment underscores how efficiently institutional capital can mobilise when the commodity narrative is gold or silver.
The royalty structure is not the problem. The mechanism works equally well whether the underlying commodity is gold, silver, copper, or graphite. What differs is the depth of institutional capital prepared to underwrite each commodity category.
Why Battery Metals Royalties Remain Starved of Capital Despite Commodity Strength
The Familiarity Gap: Narrative Versus Fundamentals
Gold has millennia of cultural and financial narrative behind it as a store of value, an inflation hedge, and a safe-haven asset. This narrative infrastructure translates directly into fund mandate eligibility. Funds oriented toward hard assets, inflation protection, or real asset exposure naturally accommodate gold and silver royalties without requiring extensive investor education.
Battery metals lack equivalent narrative scaffolding. Manganese, graphite, vanadium, and zinc remain opaque even to sophisticated investors who comfortably navigate gold and silver markets. The investment case requires understanding battery chemistry, supply chain dynamics, demand modelling for industrial applications, and project-level technical risk — all of which represent a higher cognitive and analytical barrier than the familiar gold thesis.
This familiarity gap persists even in a market where lithium prices have climbed approximately 80% over the past year, a performance trajectory matching gold over the same period, yet with a fraction of the corresponding capital flow into battery metals investment vehicles.
Historical Project Failures and Their Lasting Shadow
The early wave of battery metals project development left significant casualties that continue to shape risk perception. Several lithium development projects saw capital cost estimates roughly double during construction, with budgets escalating from initial estimates around $500 million toward $1 billion or beyond, leaving assets stranded in receivership despite backing from established private equity groups.
These failures were not random; they reflected genuine knowledge gaps about processing complexity, brine chemistry variability, supply chain immaturity, and the capex intensity of building greenfield hydrometallurgical plants. However, the important distinction is that these failures represented a learning curve, not a structural condemnation of the asset class.
Subsequent projects benefit from hard-won operational knowledge. Processing technologies are better understood; contractors have relevant experience; supply chains are more mature. The technical risk profile of battery metals projects in 2026 is meaningfully lower than it was in 2019 or 2020, yet capital markets have not fully recalibrated their risk pricing to reflect this improvement.
The Price Transparency Transformation
Five years ago, obtaining reliable, real-time spot pricing for many battery metals required specialist subscriptions to proprietary data providers, making transparent investment underwriting difficult for generalist institutional teams. Today, multiple platforms provide accessible, transparent pricing across critical minerals, substantially narrowing the information asymmetry that once deterred institutional participation.
This infrastructure improvement is not trivial. Price discovery is the foundation of investment underwriting. Without it, determining fair value for royalty cash flows is largely speculative. As pricing transparency has improved, one of the most significant structural barriers to institutional participation in battery metals royalties has progressively eroded.
Copper at Record Levels and Lithium Rising: Why Price Performance Alone Is Insufficient
The Decoupling of Fundamentals and Capital Flows
Copper has been trading near historically elevated levels, with prices in the range of approximately $6.50 per pound reflecting genuine supply tightness and surging demand across multiple industrial applications. Furthermore, the copper supply crunch has been compounded by lithium staging a meaningful recovery, with prices appreciating approximately 80% over the past year. These moves are not speculative; they are grounded in observable supply deficits, project delays, and growing consumption.
Yet capital flows into battery metals royalty companies have not tracked this commodity performance. The disconnect becomes starker when framed comparatively:
| Commodity | Recent Performance | Capital Flow to Royalties |
|---|---|---|
| Gold | Strong appreciation (~80% over 2024–2026) | Substantial; multiple large deals executed |
| Silver | Strong appreciation | Significant; major streaming transactions active |
| Lithium | ~80% appreciation (past year) | Minimal; sector remains capital-constrained |
| Copper | Near historically elevated highs ~$6.50/lb | Moderate; developers still capital-constrained |
The explanation lies in how institutional capital allocation actually works. Fund mandates, asset class definitions, familiarity thresholds, and risk perception frameworks all act as filters between commodity performance data and actual capital deployment decisions. Superior commodity fundamentals are a necessary but not sufficient condition for attracting institutional capital when those barriers remain in place.
Battery Chemistry Risk as a Hidden Investor Deterrent
A concern less frequently discussed in mainstream investment commentary is the technology substitution risk embedded in single-metal battery metals exposure. Battery chemistry has evolved rapidly: the shift from NMC (nickel-manganese-cobalt) cathode chemistries toward LFP (lithium iron phosphate) materially altered the demand profiles for cobalt and nickel relative to earlier projections.
The potential emergence of sodium-ion batteries raises questions about long-term lithium demand, while solid-state technology could reshape the entire battery materials landscape. This creates a legitimate concern for narrow, single-metal royalty exposure. Broad diversification across nine or more battery metals is therefore not merely a risk management preference; it is a structural hedge against the specific technological disruption risk that makes generalist investors hesitant about the sector.
Artificial Intelligence as a Structural Copper Demand Driver
A New Demand Category That Wasn't Modelled Five Years Ago
Among the structural arguments for battery metals royalties, the artificial intelligence infrastructure thesis stands out for its scale and novelty. The copper demand drivers tied to AI data centre construction are substantial, spanning power transmission infrastructure, cooling systems, server connectivity, and the broader electrical grid upgrades needed to support dramatically increased power consumption.
Industry projections suggest that AI-related infrastructure buildout could increase total global copper demand by approximately 50% over the next two decades. This is not a marginal demand increment; it represents a consumption category that did not exist in supply-demand models as recently as 2020 or 2021, and which continues to scale rapidly as AI adoption accelerates across enterprise and consumer applications.
Multiple Independent Demand Vectors Reinforce the Long-Term Case
Unlike gold, which derives demand primarily from jewellery, investment products, and central bank reserves, critical minerals face multiple independent industrial growth trajectories:
| Demand Driver | Primary Metals | Expected Timeline |
|---|---|---|
| Electric vehicle adoption | Lithium, copper, nickel, manganese, graphite | 2025–2040 |
| Renewable energy infrastructure | Copper, zinc, vanadium | 2025–2045 |
| Grid modernisation and battery storage | Lithium, vanadium, graphite | 2025–2040 |
| AI data centre infrastructure | Copper | 2025–2045 |
The compounding nature of these demand vectors is significant. A single EV requires roughly 2–3 times more copper than a conventional internal combustion vehicle. A grid-scale vanadium redox flow battery installation requires vanadium at volumes that would have represented meaningful proportions of annual global production just a decade ago. Each demand driver is independently capable of sustaining elevated commodity prices; their simultaneous activation represents a structural demand environment without modern historical precedent.
The next major ASX story will hit our subscribers first
Valuing Battery Metals Royalty Companies: Frameworks Investors Should Apply
NAV Multiples and What the Discount Implies
Established precious metals royalty companies, including Franco-Nevada, Wheaton Precious Metals, and Royal Gold, have historically traded at 1.5x to 3x net asset value, calculated using discounted cash flow models applied to their royalty portfolios. This premium to NAV reflects the quality and predictability of their cash flows, management track records, diversification across producing assets, and the deep institutional familiarity with their business models.
Battery metals royalty companies currently trade at multiples well below these benchmarks, in many cases near or below NAV itself. This discount reflects investor risk perception, not a structural inferiority in the underlying royalty mechanism. The practical question for investors is whether the discount represents genuine embedded risk, or whether it represents a mispricing driven by narrative and familiarity barriers that are in the process of eroding.
According to an analysis of overlooked royalty companies, this leveraged upside to the battery metals boom remains persistently underappreciated by mainstream institutional capital, further reinforcing the case that structural mispricing — rather than fundamental weakness — is the primary explanation.
Portfolio Impact Metrics: Measuring Embedded Value
One underutilised framework for evaluating battery metals royalty companies involves quantifying the portfolio's potential impact on the NAV and cash flow profiles of the underlying operators. A royalty portfolio with the demonstrated capacity to boost NAV by 12–15% for mid-tier mining companies with market capitalisations around $3 billion carries embedded value of $360–450 million based on impact contribution alone.
When a royalty company holding that portfolio trades at a market capitalisation below $20 million, the implied discount to embedded portfolio value is not a minor pricing anomaly. It represents a structural mispricing that either reflects deep fundamental concerns about portfolio realisation risk, or a profound failure of capital market recognition. Distinguishing between these two explanations requires careful project-level analysis of each royalty in the portfolio.
Key Valuation Metrics for Battery Metals Royalty Analysis
| Metric | What It Measures | Investor Relevance |
|---|---|---|
| Price-to-NAV multiple | Market cap vs. discounted royalty cash flows | Identifies discount or premium to intrinsic value |
| Royalty count and diversification | Number and breadth of active royalties | Reduces single-asset concentration risk |
| Commodity mix | Exposure across battery metals spectrum | Determines leverage to electrification themes |
| Cash flow timeline | Expected onset of royalty revenue | Critical for near-term vs. long-term investors |
| Operator financial strength | Underlying miner's ability to reach production | Determines royalty payment reliability and timing |
| Technology obsolescence exposure | Single-metal vs. multi-metal diversification | Hedges against battery chemistry substitution |
Building a Defensible Battery Metals Royalty Portfolio
Why Commodity Breadth Matters More Than in Precious Metals
A well-constructed battery metals royalty portfolio spans the full critical minerals spectrum, including copper, lithium, manganese, graphite, vanadium, zinc, nickel, tin, and iron ore. Diversification across nine or more distinct battery metals serves a function that has no direct equivalent in precious metals royalty construction: it hedges against the specific risk of chemistry-driven demand displacement.
If solid-state batteries reduce lithium intensity per unit of energy storage, a royalty portfolio with significant vanadium or graphite exposure provides natural compensation. Furthermore, advances in direct lithium extraction technology are progressively reducing the capex intensity and timeline risk associated with lithium royalty portfolios, which is another development that has not yet been fully priced into sector valuations.
Geographic diversification across multiple jurisdictions provides an additional layer of risk reduction, insulating royalty portfolios from sovereign risk concentrations, permitting delays, or regulatory changes in any single country.
Is the Battery Metals Royalty Sector Approaching an Inflection Point?
Three Structural Signals Worth Monitoring
Several converging developments suggest the sector may be approaching a maturation threshold that historically precedes capital recognition:
- Price discovery normalisation: Real-time, transparent pricing is now accessible across most critical minerals, substantially reducing the information asymmetry that previously made institutional underwriting difficult.
- Technology de-risking through operational experience: Battery chemistries, processing routes, and project execution are better understood following the early wave of project development, reducing the capex uncertainty that produced the high-profile failures of the 2018–2022 period.
- New investor migration patterns: The sustained gold and silver rally of 2024–2026 has attracted new retail investors, specialist funds, and generalist capital into the broader mining sector. Historical precedent suggests these cohorts typically begin with gold exposure before progressively seeking higher-risk, higher-reward commodity categories as sector understanding deepens.
The Migration Thesis: When New Gold Investors Discover Critical Minerals
The dynamics of new investor entry into mining are worth examining carefully. The gold rally has drawn a meaningfully different investor profile into the sector compared to the previous cycle, including participants who had no prior mining exposure, retail investors accessing the sector through ETFs, and generalist funds with hard asset mandates. These new entrants are currently concentrated in gold and silver.
As their familiarity with the mining sector deepens, and as critical minerals projects deliver operational milestones that convert projected royalty cash flows into actual revenue, the narrative accessibility of battery metals should improve. The historical pattern across multiple commodity cycles suggests this migration can be gradual, then sudden, as a catalytic event shifts the sector's risk perception among a critical mass of investors.
Catalysts That Could Accelerate a Re-Rating
| Catalyst | Mechanism | Estimated Timeline |
|---|---|---|
| Production ramps at major battery metals projects | Converts projected royalty cash flows to actual revenue | 2026–2028 |
| M&A consolidation in battery metals royalties | Establishes valuation benchmarks and sector visibility | 2026–2029 |
| Migration of new gold investors to critical minerals | Expands investor base and improves liquidity | 2026–2030 |
| AI-driven copper demand confirmation | Validates structural demand thesis with observable consumption data | 2027–2030 |
| Battery chemistry stabilisation | Reduces technology substitution risk perception | Ongoing |
Risks That Could Prevent the Valuation Gap From Closing
Technology Substitution and Prolonged Capital Concentration
The primary risks facing battery metals royalties are genuine and should not be dismissed in any serious investment analysis:
- Chemistry substitution risk: Rapid advancement in sodium-ion or solid-state battery technology could reduce demand for lithium, cobalt, or nickel faster than supply adjusts, undermining royalty cash flow projections at single-metal concentrated portfolios.
- Prolonged precious metals dominance: If gold and silver continue their strong performance trajectory, institutional capital may remain anchored in precious metals royalties for longer than fundamental arguments for battery metals would suggest is rational.
- Capex overrun risk at underlying projects: While royalty holders do not bear operational costs, they are fully exposed to production failure. If an underlying mine cannot reach commercial production due to cost overruns or technical challenges, the associated royalty generates no revenue regardless of commodity prices.
- Liquidity and market capitalisation constraints: Small-cap battery metals royalty companies face a structural challenge: their low market capitalisation deters institutional participation due to liquidity constraints, yet raising growth capital at deeply discounted valuations is dilutive, creating a feedback loop that suppresses the re-rating needed to attract institutional buyers.
Investors should treat battery metals royalty companies as high-conviction, longer-duration positions. The structural case is compelling, but the timeline to capital market recognition involves genuine uncertainty. Position sizing and portfolio construction should reflect this asymmetric but patient return profile. This is not financial advice; investors should conduct independent due diligence and consult a qualified financial adviser before making investment decisions.
Battery Metals Royalty Sector: A Comparative Overview
| Company | Exchange | Portfolio Scale | Market Cap (Approx.) | Primary Commodity Exposures |
|---|---|---|---|---|
| Electric Royalties | TSXV | 22 royalties across 9 metals | Under $20M | Lithium, copper, manganese, graphite, vanadium, zinc, tin, nickel, iron ore |
| Altius Minerals | TSX | Diversified including battery metals | Larger-cap | Lithium, potash, iron ore, copper |
| Vox Royalty Corp | Various | 60+ royalties, 8 jurisdictions | Small-cap | Diversified mining |
The contrast with precious metals royalty peers is stark. Franco-Nevada, Wheaton Precious Metals, and Royal Gold collectively command market capitalisations in the billions, trading at established NAV premiums that reflect their deep institutional ownership bases, high-quality producing asset portfolios, and decades of cash flow track records. Notably, Altius Minerals has seen lithium royalties reshape its revenue profile, offering a tangible early example of how battery metals royalties undervalued by the broader market can begin to generate meaningful, measurable cash flows. Battery metals royalty companies operating at sub-$20 million market capitalisations represent a different point on the maturity curve — earlier-stage, higher-risk, but potentially offering proportionally greater upside as the sector matures.
Frequently Asked Questions: Battery Metals Royalties Undervalued
Why do battery metals royalty companies trade at a discount to precious metals peers?
Battery metals royalty companies face structurally lower investor familiarity, higher perceived commodity and technology risk, and less established institutional mandate eligibility compared to gold and silver royalty companies. Despite comparable or superior commodity price performance in some cases, the capital allocation gap persists because narrative accessibility and mandate frameworks, not raw commodity fundamentals, drive institutional deployment decisions.
What is a net smelter return royalty and how does it function?
An NSR royalty entitles the holder to a fixed percentage of gross mine revenue after smelting and refining deductions. The royalty holder contributes upfront capital to the operator and subsequently receives passive income without bearing operational costs or capital expenditure, creating leveraged, low-cost exposure to commodity production over the mine's life.
How does AI infrastructure growth affect copper royalty valuations?
AI data centre construction requires substantial copper for power transmission, cooling systems, and connectivity infrastructure. Industry projections indicate AI-related demand alone could increase global copper consumption by approximately 50% over the next two decades, representing a consumption category entirely absent from supply-demand models as recently as 2020–2021 and a powerful structural tailwind for copper royalty holders.
What is the standard NAV multiple range for royalty companies?
Established precious metals royalty companies typically trade at 1.5x to 3x net asset value. Battery metals royalty companies currently trading near or below NAV represent a significant departure from sector norms, implying either elevated risk perception, genuine fundamental concerns, or meaningful undervaluation — a distinction requiring careful project-level analysis.
What are the primary risks of investing in battery metals royalty companies?
Key risks include technology substitution reducing demand for specific minerals; prolonged capital concentration in precious metals limiting re-rating timelines; capex overruns at underlying projects preventing production; and liquidity constraints at small-cap royalty companies creating structural barriers to institutional participation.
The Long-Term Convergence Case for Patient Capital
The structural argument for battery metals royalties does not rest on any single catalyst or short-term price movement. It rests on the convergence of several independently observable trends: improving price discovery infrastructure, technology de-risking through accumulated operational experience, multiple compounding industrial demand drivers that have no equivalent in precious metals, and the progressive migration of new mining investors toward higher-risk, higher-reward commodity categories.
The royalty mechanism itself is demonstrably sound. The $900 million-plus deployed into precious metals royalties and streams in the first quarter of 2026 alone confirms institutional appetite for the structure when the underlying commodity fits existing narratives. The gap between precious metals royalty valuations and battery metals royalty valuations is therefore not a structural condemnation of the model applied to critical minerals. It is a capital allocation lag driven by familiarity and mandate constraints that are, by their nature, temporary.
Whether that lag resolves over two years or ten depends on a combination of project execution, commodity price trajectories, investor education, and the catalytic force of M&A consolidation establishing credible valuation benchmarks. For patient investors prepared to hold through that uncertainty, the asymmetry of the current setup — deeply discounted valuations against strengthening structural demand — represents a rare combination in the battery metals royalties undervalued landscape.
This article is intended for informational purposes only and does not constitute financial advice. Investing in mining and royalty companies involves significant risks, including commodity price volatility, project execution uncertainty, and potential total loss of capital. Readers should conduct independent due diligence and seek professional financial advice before making any investment decisions.
Want to Identify the Next Major Battery Metals Discovery Before the Market Catches On?
Discovery Alert's proprietary Discovery IQ model delivers real-time alerts on significant ASX mineral discoveries — including critical and battery metals — instantly translating complex geological data into actionable insights for investors at every experience level. Explore historic examples of exceptional discovery returns and begin your 14-day free trial at Discovery Alert to position yourself ahead of the broader market.