August 6, 2026
BHP's financial performance during the first half reveals significant transformation within the broader context of mining industry evolution, particularly when assessing capital allocation frameworks during commodity super-cycles. The global mining industry operates through intricate geological, technological, and regulatory environments that create competitive advantages through resource quality, processing efficiency, and strategic positioning rather than traditional business model differentiation. Understanding these multifaceted dynamics requires analysing operational excellence initiatives, commodity portfolio optimisation, and long-term value creation strategies that sustain performance through volatile market conditions.
What Key Performance Indicators Define BHP's Current Market Leadership?
Revenue Growth and Operational Efficiency Metrics
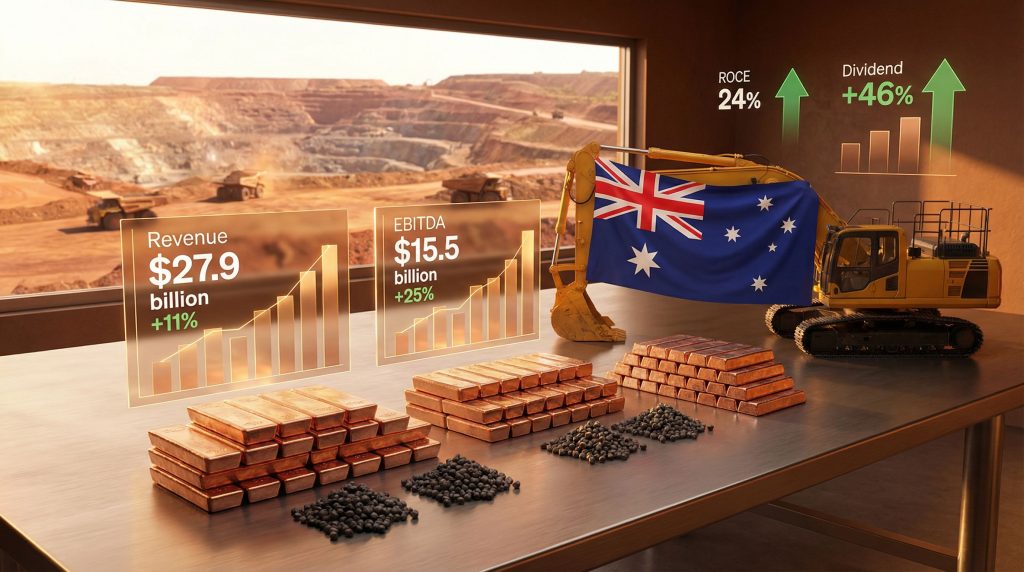
The latest BHP earnings report demonstrates substantial operational leverage through quantifiable performance improvements across multiple operational segments. The company achieved 11% revenue growth to $27.9 billion, supported by EBITDA expansion of 25% to $15.5 billion, yielding an impressive 58% EBITDA margin. This margin expansion reflects sophisticated operational management during inflationary pressure periods when many mining competitors experienced margin compression.
The underlying net profit increase of 22% to USD $6.2 billion for the first half suggests annualised earnings potential of approximately USD $12.4 billion, positioning BHP amongst the most profitable mining operators globally. These metrics demonstrate operational excellence extending beyond commodity price appreciation, indicating genuine productivity improvements and cost management sophistication.
Return on Capital Employed (ROCE) improvement to 24% represents a three-percentage-point increase, placing BHP in the top quartile of major mining operators globally. This ROCE expansion occurs during capital-intensive development phases, including potash project advancement and copper capacity optimisation, suggesting management effectiveness in deploying capital for productive returns.
Dividend Policy Framework and Shareholder Returns
The 46% interim dividend increase to USD $0.73 on a fully franked basis provides material tax efficiency for Australian resident shareholders benefiting from franking credits. This dividend enhancement reflects confidence in sustaining higher payout levels through commodity cycles, with the 60% payout ratio providing mathematical sustainability at current earnings levels.
However, dividend sustainability requires careful analysis beyond current period performance. The payout framework assumes EBITDA stability through potential copper price normalisation, which creates dependency between dividend capacity and commodity market dynamics. The fully franked structure delivers immediate tax benefits, but long-term dividend growth depends on operational cash flow generation rather than commodity price appreciation.
Furthermore, BHP's financial performance demonstrates strong capital allocation discipline across multiple operational segments. Consequently, this positions the company advantageously within current market conditions.
Key Performance Summary:
• Revenue Growth: 11% to $27.9 billion
• EBITDA Margin: 58% with 25% growth
• ROCE Enhancement: 24% (+3 percentage points)
• Dividend Yield: Fully franked at increased payout ratios
• Cash Generation: Strong operational cash flow supporting capital allocation
When big ASX news breaks, our subscribers know first
How Has Copper Positioning Transformed BHP's Business Portfolio?
Copper Division Performance Breakdown
Copper operations generated record $8 billion EBITDA contribution, representing 51% of underlying EBITDA, marking a remarkable strategic transformation for a company historically dependent on iron ore revenues. This concentration shift creates both opportunity and risk exposure, as copper pricing volatility now drives majority earnings performance.
The production capacity upgrade to 1.9-2.0 million tonnes represents substantial scale relative to global copper production of approximately 22 million tonnes annually. This positioning provides meaningful market influence while maintaining cost advantages through operational scale and technical expertise.
Escondida operation throughput optimisation demonstrates technical execution capability, with recent capital investments in leach pad and heap leach improvements enabling higher oxidised ore throughput despite declining sulphide ore grades. These improvements support production guidance increases without requiring major new resource acquisitions.
Strategic Commodity Diversification Impact
The shift from iron ore dominance to copper-centric portfolio allocation represents strategic repositioning toward energy transition commodity exposure. Copper demand benefits from renewable energy infrastructure, electric vehicle adoption, and grid modernisation requirements, providing structural growth tailwinds extending beyond traditional industrial demand cycles.
Moreover, copper investment insights suggest substantial opportunities in the current market environment. In addition, by-product revenue streams including gold, silver, uranium, and zinc contribute material value beyond primary copper economics. The Wheaton Precious Metals silver presale transaction valued at USD $4.3 billion demonstrates sophisticated risk management, effectively monetising 80% of silver entitlements over extended periods at favourable current pricing.
Portfolio Risk Assessment:
| Commodity Segment | EBITDA Contribution | Market Position | Risk Profile |
|---|---|---|---|
| Copper Operations | 51% | Top 3 Global | High Price Volatility |
| Iron Ore | ~35% | Lowest Cost Producer | Moderate Volatility |
| By-products (Ag, Au, U) | ~14% | Specialised Assets | Price Diversification |
However, this concentration creates commodity exposure risk. When copper cycles down, the 51% EBITDA dependence may not be offset by iron ore performance, particularly if global economic conditions simultaneously pressure both commodity segments.
What Operational Excellence Initiatives Drive Cost Competitiveness?
Cost Management and Productivity Improvements
BHP achieved group-wide unit cost reduction of 4.5% despite industry-wide inflationary pressures affecting labour costs, energy expenses, and supply chain normalisation. This negative unit cost growth in an inflationary environment indicates operational leverage and structural efficiency improvements exceeding wage-price pressures.
Escondida cost reduction of 16% positions the operation in the lowest-cost quartile globally, with all-in sustaining costs (AISC) estimated at approximately USD $1.51/lb, providing substantial margin protection during commodity price volatility periods.
South Australian copper operations achieved 53% cost improvement, reflecting operational stability improvements following the Prominent Hill mine restart and increased Olympic Dam processing throughput from recent optimisation projects. This magnitude of improvement suggests genuine operational execution rather than commodity price benefits.
Capital Expenditure Strategy and Asset Optimisation
The $11 billion capex guidance for FY26/FY27 allocation prioritises copper expansion, potash development completion, and operational efficiency enhancement. The Jansen potash project at 75% completion targeting mid-2027 first production provides diversification into agriculture-focused commodities with different demand cycles than energy-industrial metals.
Furthermore, asset portfolio optimization transactions valued at $10 billion demonstrate capital allocation discipline, divesting non-core assets to fund higher-return development projects. This optimisation approach concentrates resources on competitive advantage assets while maintaining financial flexibility for strategic opportunities.
Technology and automation in mining implementation includes autonomous haul truck deployment and mine-to-mill optimisation software, though specific productivity metrics were not disclosed. Industry evidence suggests these implementations provide 5-15% productivity improvements over multi-year deployment periods.
Operational Excellence Metrics:
• Cost Reduction: 4.5% group-wide despite inflation
• Escondida Efficiency: 16% cost improvement
• SA Copper Operations: 53% cost enhancement
• Capital Deployment: $11 billion strategic allocation
• Technology Integration: Automation and optimisation systems
How Do Market Dynamics Influence BHP's Strategic Positioning?
Global Economic Environment Assessment
Management outlook anticipates 3% global growth supporting commodity demand fundamentals, though this projection requires validation against potential economic deceleration risks. Inflation management strategies across operations demonstrate adaptive capability, but currency exposure management faces challenges from Australian dollar strength impact on USD-denominated revenue realisation.
Commodity price cycle positioning reveals dependency on sustained elevated copper pricing for current valuation sustainability. The 20% valuation premium to fair value estimates reflects market expectations for continued copper strength that may prove vulnerable to demand normalisation or supply expansion.
Competitive Landscape Analysis
BHP maintains lowest-cost major iron ore producer status through Pilbara operations integration, port infrastructure control, and operational scale advantages. Market share dynamics in copper segments benefit from Escondida's scale and Olympic Dam's polymetallic diversification, providing competitive positioning during industry consolidation phases.
Peer comparison analysis indicates operational efficiency metrics exceeding industry averages, with ROCE performance in top quartile ranges. Strategic advantages in key commodity markets derive from resource quality, infrastructure integration, and technical expertise rather than traditional competitive moats.
Market Position Strengths:
- Iron Ore Leadership: Lowest-cost production with infrastructure control
- Copper Scale: Top-tier global production capacity
- Technical Expertise: Advanced metallurgical processing capabilities
- Geographic Diversification: Operations across multiple stable jurisdictions
- By-product Optimisation: Sophisticated revenue stream management
What Financial Structure Supports Long-term Growth Strategy?
Balance Sheet Optimisation and Debt Management
Net debt position of $14.7 billion maintained within target ranges provides financial flexibility while supporting growth investment requirements. The debt-to-EBITDA ratio at 0.5x indicates conservative leverage utilisation, creating capacity for additional borrowing during strategic opportunity periods.
Cash generation capability supports growth investments without requiring external financing for routine capital expenditure. This financial independence provides strategic flexibility during commodity downturns when external capital markets may restrict access or impose unfavourable terms.
Credit rating implications benefit from diversified commodity exposure and conservative debt management, supporting financing cost optimisation through investment-grade rating maintenance. The balance sheet structure enables opportunistic capital deployment during industry distress periods.
Capital Allocation Framework
The 60% payout ratio sustainability framework requires careful evaluation across commodity cycles. Current dividend capacity depends on EBITDA maintenance, which faces uncertainty from copper price normalisation risks and operational cost pressures.
Growth investment priorities focus on copper expansion and potash development completion, with strategic acquisition capability maintained through debt capacity preservation. Share buyback considerations remain secondary to organic growth investments and dividend sustainability.
Financial Framework Assessment:
| Metric | Current Level | Target Range | Strategic Implication |
|---|---|---|---|
| Net Debt | $14.7 billion | Target maintained | Financial flexibility |
| Debt/EBITDA | 0.5x | Conservative range | Borrowing capacity available |
| Payout Ratio | 60% | Cycle sustainable | Dividend predictability |
| ROCE | 24% | Top quartile | Capital efficiency validated |
Which Growth Catalysts Will Drive Future Performance?
Production Expansion Pipeline
Copper production guidance upgrade to 1.9-2.0 million tonnes reflects technical optimisation achievements and capacity expansion completion. The Jansen potash project first production timeline (mid-2027) provides agricultural commodity diversification with different demand fundamentals than industrial metals.
Exploration and development project priorities concentrate on copper resource expansion and operational efficiency enhancement. Technology adoption initiatives target productivity improvements through automation, process optimisation, and predictive maintenance systems.
Production Growth Trajectory:
• Copper Output: 1.9-2.0 million tonnes (guided increase)
• Potash Development: Mid-2027 first production target
• Operational Optimisation: Ongoing efficiency improvements
• Technology Integration: Automation and digital systems
• Resource Expansion: Strategic exploration programmes
Market Opportunity Assessment
Energy transition commodity exposure provides structural demand growth from renewable energy infrastructure, electric vehicles, and grid modernisation requirements. Infrastructure demand projections support copper consumption growth exceeding traditional industrial applications.
Geographic expansion opportunities focus on resource acquisition in stable jurisdictions with favourable regulatory environments. Strategic partnership potential exists in technology development, processing optimisation, and market access enhancement.
Growth Opportunity Analysis:
- Energy Transition Demand: Renewable infrastructure copper requirements
- Infrastructure Investment: Global development spending on modernisation
- Technology Partnerships: Process optimisation and automation
- Resource Acquisition: Strategic asset expansion opportunities
- Market Access: Geographic and customer diversification
The next major ASX story will hit our subscribers first
How Should Investors Evaluate BHP's Current Valuation Metrics?
Financial Performance Benchmarking
P/E ratio analysis requires careful consideration of earnings sustainability through commodity cycles. Current valuation metrics reflect elevated copper pricing rather than structural business improvements, suggesting vulnerability to commodity price normalisation.
12-month share price performance (+23%) versus ASX 200 indicates market recognition of operational improvements and copper positioning benefits. However, this outperformance depends on sustained commodity market dynamics that may not persist long-term.
Fair value assessment methodologies must account for commodity price dependency, operational leverage sensitivity, and capital allocation sustainability. Traditional valuation approaches may underestimate volatility risks inherent in concentrated commodity exposure.
Risk Assessment and Mitigation Strategies
Commodity price volatility exposure represents the primary valuation risk, with copper price sensitivity driving majority earnings fluctuations. Operational risk factors include cost inflation, regulatory changes, and environmental compliance requirements.
ESG performance impact on valuation multiples increasingly influences institutional investor allocation decisions. Environmental compliance costs and social licence requirements affect operational flexibility and long-term cost structures.
Investment Risk Framework:
| Risk Category | Impact Level | Mitigation Strategy | Investor Consideration |
|---|---|---|---|
| Commodity Volatility | High | Portfolio diversification | Price cycle timing |
| Operational Costs | Medium | Technology efficiency | Margin sustainability |
| Regulatory Changes | Medium | Compliance investment | Jurisdiction stability |
| ESG Requirements | Medium | Proactive compliance | Stakeholder management |
What Strategic Implications Emerge from This Earnings Performance?
Industry Leadership Position Consolidation
Operational excellence demonstration across multiple commodity segments validates management capability and technical expertise. Market share protection strategies benefit from cost leadership sustainability and operational scale advantages.
Innovation and technology adoption provide competitive advantages through productivity enhancement and cost optimisation. However, industry leadership requires continuous investment in capability development and operational improvement.
In addition, data-driven operations are becoming increasingly critical for maintaining competitive positioning. Furthermore, detailed earnings analysis provides additional insights into the company's financial performance trajectory.
Strategic Position Assessment:
• Cost Leadership: Validated across iron ore and copper operations
• Technical Expertise: Advanced metallurgical and processing capabilities
• Scale Advantages: Meaningful market presence in key commodities
• Innovation Capacity: Technology adoption and operational optimisation
• Financial Strength: Conservative balance sheet with growth flexibility
Long-term Value Creation Framework
Dividend sustainability through commodity cycles requires operational cash flow stability rather than commodity price dependence. Growth investment returns optimisation focuses on copper expansion and operational efficiency rather than diversification into unfamiliar commodity segments.
Portfolio diversification benefits remain limited given copper concentration at 51% of EBITDA. Stakeholder value maximisation requires balancing shareholder returns with reinvestment for competitive position maintenance.
The BHP earnings report demonstrates operational excellence within favourable commodity market conditions. However, long-term value creation sustainability depends on maintaining cost leadership, optimising capital allocation, and managing commodity exposure risks through operational efficiency rather than market timing. Investors should evaluate the company's performance within the context of commodity cycle positioning whilst recognising the quality of underlying operational execution and strategic asset portfolio.
Investment Disclaimer: This analysis involves speculation about future commodity prices, operational performance, and market conditions. Mining sector investments carry inherent volatility risks, and past performance does not guarantee future results. Investors should conduct independent analysis and consider professional advice before making investment decisions.
Ready to Position Yourself in the Next Major Mining Discovery?
Discovery Alert instantly alerts investors to significant ASX mineral discoveries using its proprietary Discovery IQ model, turning complex mineral data into actionable insights that could mirror BHP's early discovery success. Understanding why historic discoveries can generate substantial returns by exploring Discovery Alert's dedicated discoveries page, showcasing exceptional outcomes that help investors identify transformative opportunities before they reach mainstream attention.