August 25, 2026
When a Mining Giant Outgrows Every Expert's Forecast
Commodity markets have a well-documented habit of humbling even the most rigorous analysts. Price cycles compress and expand in ways that defy short-term modelling, and the stocks tied to those cycles can surge far beyond what valuation frameworks predict. That tension sits at the very heart of what is unfolding with BHP Group Ltd (ASX: BHP) right now. The BHP share price hits new record high territory just days after its most profitable year in company history, and in doing so, it has moved beyond every single 12-month price target issued by the 11 analysts who covered the stock following the release of its FY26 results. That is not a minor footnote. It is a signal worth unpacking carefully.
When big ASX news breaks, our subscribers know first
The FY26 Numbers That Changed the Conversation
A Financial Result That Rewrote the Record Books
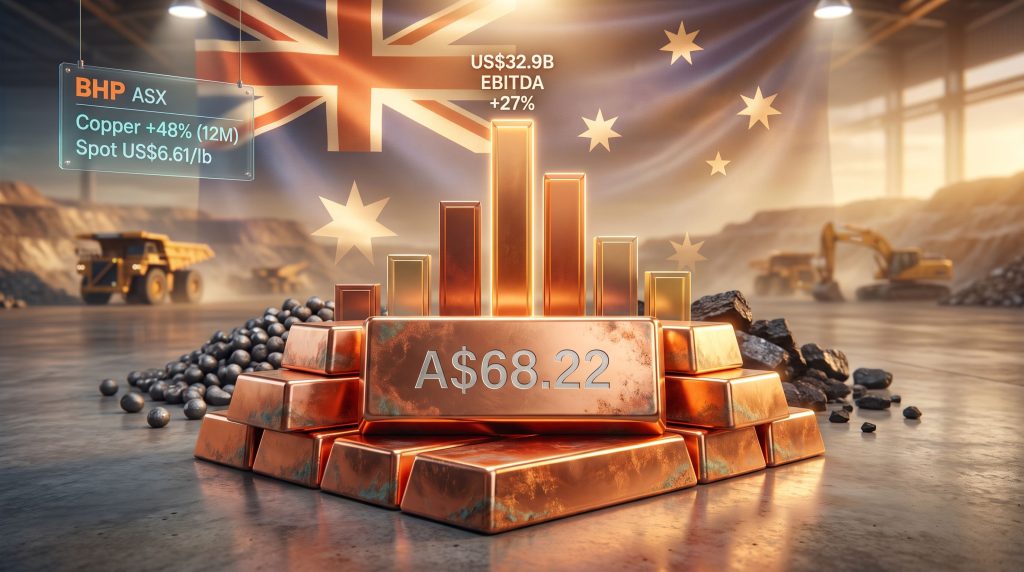
BHP's FY26 full-year results, released on 18 August 2026, delivered figures that genuinely surprised even optimistic observers. The headline metric was an underlying EBITDA of US$32.9 billion, representing a 27% increase compared to FY25 and the strongest earnings result in the company's 160-plus-year history.
| Financial Metric | FY26 Result | Year-on-Year Change |
|---|---|---|
| Underlying EBITDA | US$32.9 billion | +27% |
| Underlying Attributable Profit | US$13.2 billion | +30% |
| Net Operating Cash Flow | US$21.8 billion | +17% |
| Unit Cost Reduction (Major Assets) | ~6% | Improvement |
The profit surge was not driven by commodity prices alone. A 6% reduction in unit costs across BHP's major asset base demonstrated meaningful operational discipline, while production increases at both its coal and iron ore operations contributed additional volume-driven revenue. Net operating cash flow of US$21.8 billion, up 17% year-on-year, reinforced the quality of the earnings rather than making them appear as a one-cycle windfall.
How Copper Became the Engine Room of BHP's Earnings
Perhaps the most structurally significant element of the FY26 result was the confirmation that copper now accounts for 54% of BHP's underlying EBITDA. This figure represents a fundamental repositioning of the company's earnings profile compared to even five years ago, when iron ore was the unambiguous revenue anchor.
BHP's ascent to become the world's largest copper producer by output did not happen overnight. It involved a deliberate reallocation of capital toward assets like Escondida in Chile, the world's single largest copper mine, and OZ Minerals' Prominent Hill and Carrapateena deposits in South Australia, which BHP acquired in 2023 for approximately A$9.6 billion. The strategic logic was straightforward: the copper supply crunch tied to electrification infrastructure, EV manufacturing, and renewable energy generation is structurally growing, while the supply pipeline faces long lead times, complex orebody challenges, and declining average ore grades at many of the world's mature copper mines.
It is worth understanding why copper grade matters so profoundly in this context. Global average copper ore grades have declined from roughly 1.5% in the 1990s to below 0.6% at many large-scale operations today. Processing lower-grade ore requires more energy, more water, and more capital per tonne of refined copper produced. This structural headwind on the supply side reinforces the price outlook even when demand growth is modest.
BHP Share Price Milestones: The Anatomy of a Record-Breaking Rally
A Timeline of the 2026 Breakout
Understanding the speed and shape of BHP's share price movement helps contextualise why analysts are so cautious even as the market pushes higher.
- 24 June 2026: BHP reaches A$62.74 on the ASX, establishing what was then an all-time high watermark.
- 18 August 2026: FY26 results released, prompting a round of analyst target revisions across 11 brokers covering the stock.
- 24 August 2026: BHP surges to A$67.72, eclipsing every newly revised 12-month price target issued post-results.
- 25 August 2026: BHP reaches an intraday record of A$68.22, up 1.6% on the session.
- NYSE ADR: BHP's American Depositary Receipt recorded a 52-week high above US$93.70 to US$93.80 in mid-to-late August 2026.
The speed of the move from the June high to the August record matters. It compressed what analysts had modelled as 12-month upside into roughly two months of price action. This is precisely the dynamic that creates the current disconnect between institutional ratings and market behaviour. Furthermore, BHP shares hitting a record high has prompted fresh questions about the sustainability of the rally from commentators across the market.
What the ADR Price Action Reveals About Global Demand for BHP
When a stock listed on both the ASX and NYSE simultaneously approaches 52-week highs on both exchanges, it typically signals that institutional demand is not merely a domestic phenomenon. Global fund managers with mandates tied to copper exposure, critical minerals themes, or emerging market infrastructure beneficiaries are all natural buyers of BHP in the current environment. The NYSE ADR price action in August 2026 suggests this demand extends well beyond Australian retail and superannuation flows.
The Analyst Consensus Paradox: One Buy, Nine Holds, and a Sell
Why the Rating Distribution Deserves More Scrutiny Than the Headlines
Following BHP's record FY26 results, the analyst community's response was notably restrained.
| Analyst Rating | Number of Analysts | Notable Details |
|---|---|---|
| Buy | 1 (Morgan Stanley) | Target raised to A$67.50 post-results |
| Hold | 9 | Majority view across the broker community |
| Sell | 1 (Morgans) | Target of A$55.30, implying ~19% downside |
| Lowest Target | Deutsche Bank | A$51.43, implying ~24% downside |
Morgan Stanley's lone buy rating, with a revised 12-month target of A$67.50, was the most optimistic view in the entire coverage universe at the time of issuance. It has already been surpassed by the market. The nine hold ratings reflect a consensus view that BHP's fundamental quality is not in dispute, but valuation at current levels leaves limited margin of safety for new entrants.
The bear case from Morgans, carrying a target of A$55.30 and implying roughly 19% downside, is built primarily on iron ore price vulnerability and the risk that copper's extraordinary rally stalls. Deutsche Bank's even lower target of A$51.43 implies potential downside of approximately 24% from the record high, a figure that demands serious consideration from position-sizing and risk management perspectives. The Rio over BHP view held by Goldman Sachs earlier in 2025 further illustrates how broker opinions on relative value within the major miners can diverge substantially.
The Behavioural Finance Dimension
There is a well-established pattern in equity markets where stocks at all-time highs attract momentum-driven buyers precisely because price discovery is operating without the overhead supply that typically caps rallies at prior resistance levels. When BHP broke above A$62.74 in June 2026, it entered genuinely uncharted territory. Every subsequent buyer was purchasing at a price no prior BHP investor had ever paid.
This dynamic can sustain rallies longer than valuation-conscious investors expect. However, it also means that when sentiment shifts, there are no natural support levels formed by prior accumulation zones beneath current prices. Investors should weigh this asymmetry thoughtfully.
Copper's Supercycle Credentials: Separating Structural Demand From Cyclical Noise
The Price Data That Has Reshaped Mining Sector Valuations
Copper's role in BHP's re-rating cannot be overstated. The metal has been one of the most consequential commodity stories of 2025 and 2026, with copper price growth drivers increasingly cited by institutional investors as a core rationale for accumulating large-cap miners.
Copper Price Snapshot (as at 25 August 2026):
Spot price: US$6.61 per pound, up 0.3% on the day
All-time price record: US$6.71 per pound, reached 5 August 2026
12-month price gain: +48%
Calendar year-to-date gain: +16%
A 48% gain over 12 months in a commodity as heavily traded and liquid as copper is extraordinary. It reflects a genuine tightening in the physical market rather than speculative froth alone. The International Copper Study Group and various industry bodies have consistently highlighted that no major new copper mines of scale are expected to reach production within the next five years, while existing operations face grade decline and increasing geological complexity as they mine deeper.
BHP's Copper Portfolio vs. Peers
Compared to Rio Tinto, which derives a substantially smaller proportion of EBITDA from copper relative to its iron ore and aluminium segments, BHP's 54% copper EBITDA weighting makes it the purest large-cap copper proxy available to ASX investors. This differentiation is increasingly valued by thematic investors seeking green energy transition exposure through established, dividend-paying mining companies rather than smaller, higher-risk copper developers.
Iron Ore's Complicated Picture: The China Equation
Why the Metal Fell Below a Key Threshold and What It Means
Iron ore's slide below US$100 per tonne after approximately three years of sustained trading above that level has introduced a meaningful headwind to BHP's blended earnings outlook. At US$95.34 per tonne on 25 August 2026, the price reflects a genuine deterioration in Chinese steel sector economics. Understanding China iron ore demand dynamics is consequently central to any credible assessment of BHP's earnings trajectory from here.
The data points from July 2026 are sobering:
- China's steel output fell 3.6% year-on-year to 76.93 million tonnes in July 2026, the lowest monthly reading since 2017.
- Approximately only one-third of Chinese steelmakers were operating at a profit, reflecting severe margin compression.
- Residential property prices declined 3.2% year-on-year, suppressing the construction-linked demand that underpins a substantial portion of Chinese steel consumption.
- China's July iron ore imports dropped 4% month-on-month to 108.09 million tonnes, as mills curtailed purchasing amid margin pressure and conducted scheduled maintenance.
Stimulus Expectations and the September Peak Season
Counterbalancing these structural pressures are near-term catalysts. Chinese authorities have signalled intentions to implement fresh domestic demand-boosting measures, and the National Development and Reform Commission (NDRC) has directed local governments to accelerate major infrastructure project delivery. The broader challenges facing China steel and iron ore markets, however, suggest that policy support alone may not be sufficient to reverse the structural softness in construction-linked steel demand.
Whether these measures translate into a sustained iron ore recovery or merely a temporary stabilisation is the critical question for BHP's FY27 earnings trajectory.
The next major ASX story will hit our subscribers first
BHP as an Income Investment: Cash Flow, Dividends, and Capital Allocation
What Record Cash Flow Means for Shareholder Returns
Net operating cash flow of US$21.8 billion in FY26 provides BHP with exceptional flexibility. The company's capital allocation framework prioritises maintaining a strong balance sheet, funding sustaining and growth capital expenditure, and returning surplus cash to shareholders through dividends and buybacks. In a high-earnings environment, the margin above these commitments can be substantial.
BHP has historically maintained a minimum 50% payout ratio on underlying attributable profit, with additional returns deployed when the balance sheet metrics permit. With underlying attributable profit at US$13.2 billion, a 50% payout ratio alone would support a dividend approaching US$6.6 billion. This dividend capacity is a core pillar of BHP's investment thesis for income-oriented portfolios, particularly within Australian superannuation structures that benefit from franking credits attached to the Australian-domiciled BHP share.
Key Risks Every Investor Should Understand Before Forming a View
A Balanced Assessment of What Could Go Wrong
Key Risks to Monitor:
Iron ore demand deterioration accelerating beyond current stimulus expectations in China
Copper price volatility if green energy spending slows or EV adoption growth decelerates
AUD/USD currency movements that compress the Australian dollar value of US-dollar-denominated earnings
Potential for consensus analyst downgrades if commodity prices retreat from current levels
Valuation risk given the stock has exceeded every available 12-month price target
The valuation paradox is real. BHP has delivered record earnings, and the BHP share price hits new record high levels that have surpassed every professional analyst's target. For long-term investors, the relevant question is not whether BHP's businesses are excellent — they clearly are — but whether the current market price already captures that excellence and then some. In addition, BHP's ongoing rally has drawn considerable attention from market commentators assessing how much further the run can extend.
Frequently Asked Questions: BHP Share Price and Investment Considerations
What Is BHP's All-Time High Share Price?
BHP's all-time high on the ASX was recorded on 25 August 2026 at an intraday price of A$68.22. The NYSE ADR also recorded a 52-week high above US$93.70 to US$93.80 in the same period.
Why Did the BHP Share Price Hit a Record High in August 2026?
The record followed the release of BHP's FY26 full-year results on 18 August, which included record underlying EBITDA of US$32.9 billion, a 30% profit increase, and strong copper price tailwinds. Ongoing momentum in copper markets and incremental iron ore price support from Chinese stimulus expectations sustained buying pressure into late August.
What Percentage of BHP's Earnings Now Come From Copper?
Copper contributed 54% of BHP's underlying EBITDA in FY26, making it the company's largest single earnings source and cementing BHP's position as the world's largest copper producer by volume.
Is BHP a Buy, Hold, or Sell According to Analysts Right Now?
Of 11 analysts covering BHP following the FY26 results, 1 rated it a Buy (Morgan Stanley, target A$67.50), 9 rated it a Hold, and 1 rated it a Sell (Morgans, target A$55.30). The lowest target in the group was A$51.43 from Deutsche Bank. Every target has been exceeded by the market as at 25 August 2026.
How Does the Iron Ore Price Affect BHP's Share Price?
Iron ore remains a meaningful revenue contributor for BHP even though copper has overtaken it as the primary EBITDA driver. A sustained decline in iron ore prices, particularly below US$90 per tonne, would reduce BHP's cash generation and could pressure its dividend capacity and valuation multiples.
What Is BHP's Market Capitalisation and Why Does It Matter for ASX Investors?
BHP is the largest company by market capitalisation on the S&P/ASX 200 Index. This means that movements in BHP's share price have a disproportionate influence on the index itself. Australian superannuation funds and index-tracking ETFs with ASX 200 exposure hold BHP as their single largest or one of their largest positions by weight, meaning most Australian investors have indirect BHP exposure whether they realise it or not.
What the Record High Actually Tells Investors
The BHP share price hitting a new record high is simultaneously a validation of the company's strategic transformation toward copper, a reflection of extraordinary commodity market conditions, and a signal that warrants measured caution rather than uncritical enthusiasm.
The fact that professional analyst targets have been collectively eclipsed does not mean those targets are wrong on a 12-month basis. It means the market is currently pricing in a scenario more optimistic than the median expert view. Markets can sustain those conditions for extended periods, particularly when momentum is strong and institutional flows are persistent. They can also correct rapidly when the underlying commodity assumptions shift.
For investors building diversified ASX portfolios, BHP remains a genuinely exceptional business with world-class assets, improving cost structures, and a commodity exposure profile that aligns with some of the most durable structural trends of the next decade. Whether the current price represents an attractive entry point is a question each investor must answer in the context of their own time horizon, risk tolerance, and existing portfolio composition.
This article contains general information only and does not constitute personal financial advice. Past performance is not indicative of future results. Investors should consider seeking independent financial advice before making investment decisions. All price data and financial figures referenced are sourced from publicly available market data and company disclosures current as at 25 August 2026.
Want to Catch the Next Major ASX Mineral Discovery Before the Market Moves?
Discovery Alert's proprietary Discovery IQ model scans ASX announcements in real time, instantly identifying high-potential mineral discoveries across more than 30 commodities — from copper to iron ore — and delivering actionable alerts to subscribers before the broader market reacts. Explore how historic discoveries have generated extraordinary returns on Discovery Alert's dedicated discoveries page, and begin your 14-day free trial today to position yourself ahead of the next major market-moving announcement.