
June 23, 2026
The Commodity Supercycle Lens: Why Resource Giants Outperform When It Matters Most
Commodity supercycles are among the most powerful wealth-creation engines in financial markets, yet they remain deeply misunderstood by the majority of retail investors. These multi-year periods of sustained price expansion across raw materials are not random events. They are driven by structural imbalances between supply and demand, amplified by underinvestment in production capacity during downturns and accelerated by large-scale shifts in global infrastructure spending. When these cycles turn upward, the largest, lowest-cost producers tend to capture disproportionate gains relative to smaller peers.
The question of what $5,000 invested in BHP shares 12 months ago is worth today is more than a mathematical exercise. It is a window into how commodity cycles, capital allocation decisions, and long-term portfolio positioning intersect to create meaningful wealth outcomes for patient investors. Understanding a large-cap miner strategy during these conditions can help frame what follows.
When big ASX news breaks, our subscribers know first
Tracing the Recovery: From Multi-Year Low to All-Time High
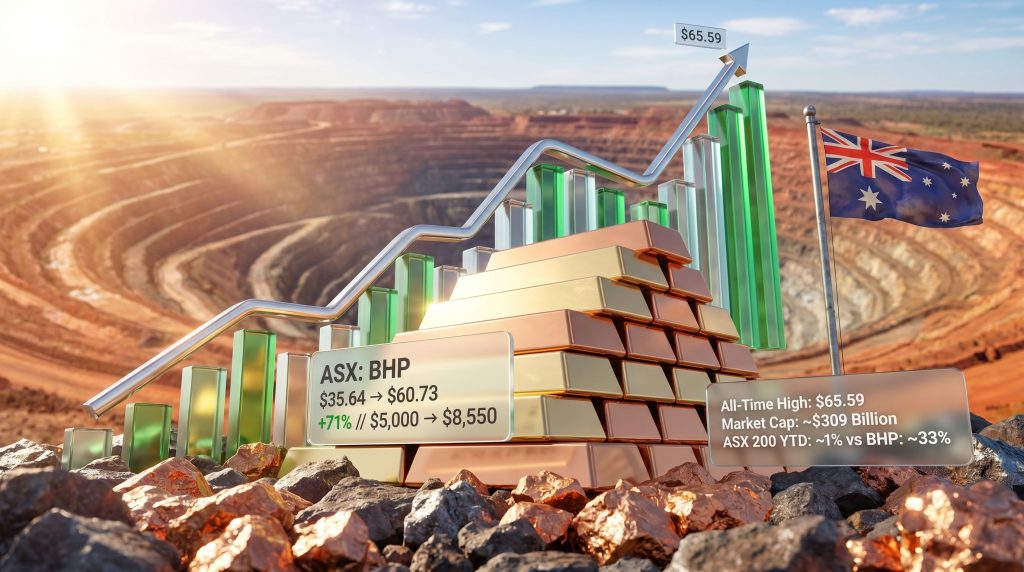
Approximately 12 months ago, BHP Group (ASX: BHP) shares were trading at around $35.64, a level that reflected deeply pessimistic sentiment across global commodity markets. At that point, iron ore prices had been under sustained pressure, and macroeconomic uncertainty around Chinese demand had weighed heavily on the entire resources sector.
What followed was a remarkable re-rating. By June 2026, BHP shares had surged to an all-time high of $65.59, before retracing approximately 7% from that peak. At the time of writing, the stock sits around $60.73, still representing a year-to-date gain of approximately 33% and a 12-month appreciation of roughly 71%.
For context, the ASX 200 benchmark returned approximately 1% year-to-date over the same period, meaning BHP's performance has dwarfed the broader market by a substantial margin.
Key Price Milestones: BHP's 2025–2026 Trajectory
| Metric | Value |
|---|---|
| BHP Share Price 12 Months Ago | ~$35.64 |
| Current BHP Share Price | ~$60.73 |
| All-Time High (June 2026) | $65.59 |
| 12-Month Price Appreciation | ~71% |
| Year-to-Date Gain (2026) | ~33% |
| June 2026 Trading Range | $60.08 to $65.59 |
The June 2026 trading range itself is instructive. The $5.51 spread between the monthly low of $60.08 and the all-time high of $65.59 within a single month illustrates the inherent volatility of large-cap mining stocks even during bull phases. This is not unusual behaviour for a cyclical stock with deep commodity exposure.
What $5,000 Invested in BHP Shares 12 Months Ago Is Worth Today
With BHP shares moving from approximately $35.64 to $60.73 over 12 months, the arithmetic is straightforward but the magnitude is striking. You can explore the numbers in detail using Stake's BHP share calculator to model different investment scenarios.
A $5,000 investment made 12 months ago at $35.64 would have purchased approximately 140.3 shares. At the current price of $60.73, that holding would be valued at approximately $8,520, representing a capital gain of roughly $3,520 before tax, brokerage, and franking credit adjustments.
Hypothetical Returns Across Multiple Investment Sizes
| Initial Investment | Entry Price | Current Value (~$60.73) | Approximate Gain |
|---|---|---|---|
| $1,000 | $35.64 | ~$1,704 | +$704 |
| $5,000 | $35.64 | ~$8,520 | +$3,520 |
| $10,000 | $35.64 | ~$17,040 | +$7,040 |
| $25,000 | $35.64 | ~$42,600 | +$17,600 |
Important Disclaimer: These calculations represent hypothetical past-performance scenarios only. Past returns are not indicative of future performance. All investment decisions should be made in consultation with a licensed financial adviser. These figures exclude brokerage, tax implications, and dividend income received during the period.
It is also worth considering the inverse scenario. An investor who purchased BHP shares at the all-time high of $65.59 just weeks ago would currently be sitting on a loss of approximately 7% at current prices, reinforcing the critical importance of entry timing and position sizing in cyclical stocks.
Dollar-Cost Averaging: A Lower-Risk Entry Strategy
For investors who find point-in-time entry decisions uncomfortable, dollar-cost averaging (DCA) offers a systematic alternative. Rather than deploying capital in a single transaction, DCA involves investing a fixed dollar amount at regular intervals regardless of the prevailing share price. This approach:
- Reduces the risk of buying entirely at cyclical peaks.
- Lowers the average cost per share over time by capturing both high and low price points.
- Removes the psychological burden of trying to time the market.
- Creates a disciplined savings and investment habit over the long term.
In the context of a volatile stock like BHP, where 12-month ranges can span tens of dollars per share, DCA can meaningfully improve an investor's average entry price compared to a single lump-sum commitment at an inopportune moment.
The Macroeconomic Forces Behind BHP's 71% Rally
Understanding why BHP shares recovered so dramatically from their 12-month lows requires examining the commodity market dynamics that underpin the company's earnings power.
Iron Ore and Copper: The Dual Pillars of BHP's Revenue Engine
BHP derives a significant proportion of its revenue from iron ore, the primary input for steelmaking, and copper, which is central to electrification infrastructure including power grids, electric vehicles, and renewable energy systems. Both commodities experienced meaningful price tailwinds during the recovery period. The broader iron ore demand outlook remains a key variable in assessing BHP's medium-term earnings trajectory.
Iron ore demand is structurally linked to Chinese construction and infrastructure activity, which, despite near-term softness, remains enormous in absolute terms. Meanwhile, the emerging copper supply crunch has positioned the metal as critical to the global energy transition, with the International Energy Agency estimating that demand for copper in clean energy applications could more than double by 2040 (IEA, The Role of Critical Minerals in Clean Energy Transitions, 2021).
This dual exposure positions BHP at the intersection of two long-duration demand stories, providing a more resilient earnings base than single-commodity miners.
Why Large-Cap Miners Outperform During Upcycles
Large, low-cost miners like BHP benefit disproportionately from commodity price increases because their operating leverage amplifies the earnings impact of rising prices. Once fixed costs are covered, incremental revenue flows almost directly to the bottom line. This means a 20% increase in iron ore prices can translate into a far larger percentage increase in operating profit for a miner with a low cost base.
This operational characteristic is one reason institutional investors tend to rotate aggressively into large-cap resource stocks when commodity cycle sentiment turns positive, often driving price appreciations that significantly exceed the underlying commodity price movement.
Analyst Consensus: Hold Ratings Dominate After the Surge
Following a 71% price appreciation, it is unsurprising that the analyst community has largely converged on a cautious stance.
Broker Ratings and Price Target Summary
| Scenario | Price Target | Implied Move from ~$60.73 |
|---|---|---|
| Average Target (TradingView) | $63.75 | +~5% upside |
| Average Target (Market Index) | $61.66 | +~1.5% upside |
| Bull Case Target | $92.99 | +~53% upside |
| Bear Case Target | $40.31 | ~34% downside |
Of 18 analysts currently covering BHP via TradingView data, 13 have assigned a hold rating and four rate the stock a strong buy. This skew toward hold ratings reflects a view that the recent price surge has largely priced in the positive commodity cycle narrative, leaving limited near-term upside at current levels.
The wide gap between the bull case target of $92.99 and the bear case of $40.31 is not an anomaly. It reflects genuine uncertainty about two variables that are notoriously difficult to forecast: Chinese economic trajectory and global commodity demand over a multi-year horizon.
The Jansen Potash Project: A $2.8 Billion Headwind
One factor weighing on near-term analyst sentiment is the cost blowout associated with BHP's Jansen potash project in Canada. The project has experienced a $2.8 billion increase in estimated costs, a development that rattled investors in June 2026 and contributed to a sharp pullback from the all-time high. Capital project overruns are a persistent risk in the mining industry, where geological complexity, labour shortages, and supply chain constraints can push development costs well beyond initial estimates.
For long-term investors, the key question is whether Jansen's eventual production profile justifies the expanded capital commitment. Potash, used extensively in agricultural fertilisers, represents a strategic diversification away from BHP's traditional iron ore and copper exposure, offering optionality on global food security themes.
BHP as a Passive Income Investment: Dividends After the Rally
Even for investors uncertain about further capital appreciation, BHP retains genuine appeal as a passive income vehicle due to its long dividend history and fully franked payout structure.
Dividend Forecast: FY26 and FY27
| Financial Year | Forecast Dividend Per Share | Forward Dividend Yield |
|---|---|---|
| FY2026 | $1.91 | ~3.1% |
| FY2027 | $1.80 | ~3.0% |
BHP paid a fully franked interim dividend of $1.0385 per share in March 2026, consistent with its track record of regular distributions dating back to approximately 2006.
Understanding Fully Franked Dividends
A fully franked dividend means BHP has already paid Australian corporate tax at the rate of 30% on the profits being distributed. Shareholders receive franking credits alongside the cash dividend, which can be used to offset their personal income tax liability.
Our franking benefits guide explores this mechanism in greater depth. However, the practical advantages are particularly compelling for:
- Self-managed super funds (SMSFs) in accumulation phase, where the tax rate is 15% and excess franking credits can reduce the fund's total tax bill.
- SMSFs in retirement phase, where the tax rate is 0% and franking credits become a direct cash refund from the Australian Taxation Office.
- Investors in lower income tax brackets, who may receive a partial cash refund of franking credits.
- Long-term income investors seeking tax-efficient yield from blue-chip Australian equities.
At a forward yield of approximately 3.1% for FY26, the headline number may appear modest compared to some ASX income stocks. However, when the value of franking credits is grossed up, the effective pre-tax yield for a superannuation fund can be materially higher, often adding 130 basis points or more to the headline figure.
The next major ASX story will hit our subscribers first
Risk Factors Investors Must Weigh at Current Price Levels
With BHP shares trading near historically elevated levels, a balanced assessment requires honest engagement with the primary downside risks.
Key Risk Factors for BHP Shareholders
- Cyclicality risk: BHP's earnings are directly tied to commodity prices, which are inherently volatile. A sustained decline in iron ore or copper prices would compress margins and likely trigger dividend reductions and share price weakness.
- China demand dependency: A significant portion of BHP's iron ore production is sold to Chinese steel mills. Any material slowdown in Chinese construction activity, property sector distress, or government infrastructure spending could reduce demand and pricing.
- Capital project overruns: As demonstrated by the Jansen potash situation, large mining projects carry substantial execution risk. Cost blowouts consume capital that might otherwise be returned to shareholders.
- Currency risk: BHP reports in US dollars but trades on the ASX in Australian dollars. Movements in the AUD/USD exchange rate affect the Australian dollar value of earnings. A stronger Australian dollar reduces the translated value of offshore revenues.
- Commodity cycle timing: Investors buying near cyclical peaks face the risk of capital loss if the cycle turns before they can exit. BHP's 7% retreat from its all-time high within weeks of reaching it is a timely reminder of this dynamic.
BHP's Blue-Chip Status: What It Actually Means for Investors
The term blue-chip is applied loosely across financial media, but it carries specific meaning in the context of portfolio construction. A blue-chip stock typically refers to shares in a company characterised by:
- Large market capitalisation with broad institutional ownership.
- Long operational history with demonstrated resilience through multiple economic cycles.
- Consistent dividend payment record over an extended period.
- Strong balance sheet with manageable debt relative to earnings capacity.
- Meaningful market position in its core industry.
BHP satisfies all five criteria. With a market capitalisation of approximately $309 billion, it holds the distinction of being the largest company listed on the Australian Securities Exchange. This scale provides liquidity, index inclusion benefits, and a degree of institutional support that smaller companies cannot replicate.
BHP vs ASX 200: Comparative Performance
| Benchmark | 12-Month Return | YTD Return (2026) |
|---|---|---|
| BHP Group (ASX: BHP) | ~71% | ~33% |
| S&P/ASX 200 Index (ASX: XJO) | Not specified | ~1% |
The performance divergence between BHP and the broader index over the past 12 months is a reminder that index-level returns can mask extraordinary individual stock performance. Investors who had the conviction to hold or accumulate BHP shares near multi-year lows have been rewarded with returns that dwarf passive index exposure by a wide margin. Furthermore, analysis from Motley Fool Australia highlights how BHP's long-term share count dynamics have shifted considerably for investors who entered at different price points over the years.
Frequently Asked Questions: BHP Shares and Investment Returns
What was BHP's share price 12 months ago?
BHP shares were trading at approximately $35.64 around 12 months before June 2026, representing a multi-year low driven by commodity market pessimism.
How much would $5,000 invested in BHP 12 months ago be worth today?
Based on the price movement from approximately $35.64 to $60.73, a $5,000 investment would be worth approximately $8,520 today, representing a gain of roughly $3,520 before tax and brokerage. Consequently, this outcome demonstrates just how significant timing can be when investing in cyclical resource stocks.
Does BHP pay fully franked dividends?
Yes. BHP has a strong history of paying fully franked dividends, with the most recent interim dividend of $1.0385 per share paid in March 2026. Analysts forecast annual dividends of $1.91 per share in FY26 and $1.80 per share in FY27.
What is the current analyst consensus on BHP shares?
The majority of analysts covering BHP hold a hold rating, with an average price target of approximately $63.75 (TradingView) implying modest near-term upside from current levels.
What commodity markets does BHP have the most exposure to?
BHP's primary commodity exposures are iron ore and copper, with additional exposure to coal and, prospectively, potash through the Jansen project in Canada.
Is BHP considered a good long-term investment for passive income?
BHP offers a combination of franked dividend income, commodity diversification, and blue-chip market position that makes it a credible passive income holding for long-term investors. However, its cyclical nature means dividend payments can vary with commodity prices, and investors should maintain realistic expectations about earnings volatility.
Want to Identify the Next Major ASX Resource Discovery Before the Market Does?
While BHP's 71% rally demonstrates the wealth-creation power of commodity cycles, the most transformative returns in the resources sector often emerge from significant new mineral discoveries — and Discovery Alert's proprietary Discovery IQ model delivers real-time alerts the moment these discoveries are announced on the ASX. Explore historic discovery returns that highlight just how substantial these opportunities can be, and begin your 14-day free trial today to position yourself ahead of the broader market.