
June 23, 2026
The Energy Chokepoint That Moves Markets Before Breakfast
Few mechanisms in global finance operate with the speed and brutality of an energy supply shock. When a physical constraint threatens the flow of hydrocarbons that power entire economies, markets do not wait for analyst reports or earnings revisions. Prices reprice instantly, portfolio managers rotate within hours, and the Strait of Hormuz closure and ASX energy shares can swing sharply based on events unfolding in the Persian Gulf overnight. Understanding why this happens requires looking beneath the headlines to the underlying plumbing of global energy trade.
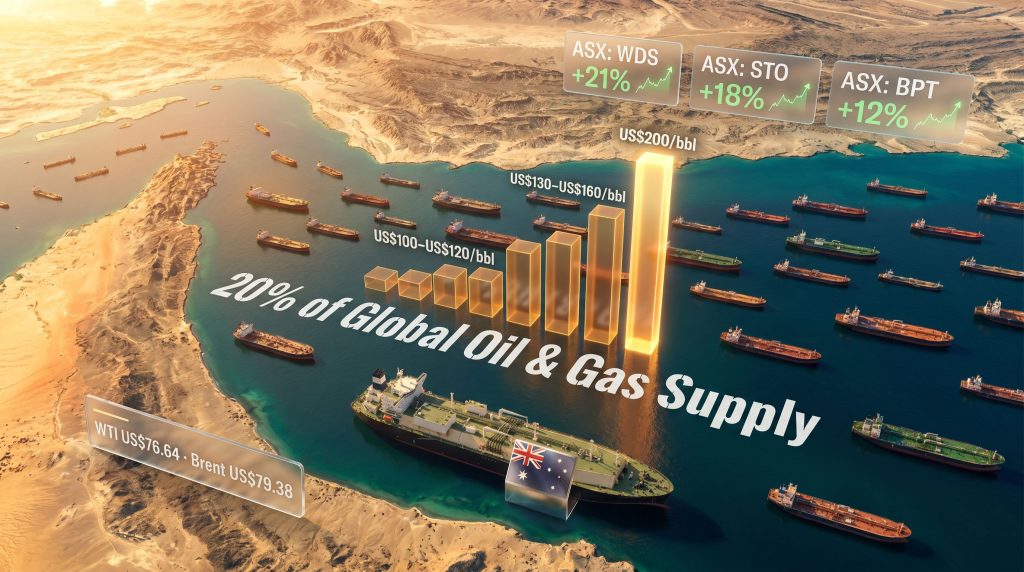
The Strait of Hormuz sits at the intersection of geography and geopolitics in a way no other maritime corridor does. Measuring roughly 33 kilometres at its narrowest navigable point, it connects the Persian Gulf to the Gulf of Oman and ultimately to global shipping lanes. What makes it extraordinary is not its width but its concentration: approximately 20 million barrels of oil and LNG per day pass through this single passage, representing more than 20% of total global oil and gas supply. There is no large-scale alternative route capable of absorbing this volume. The infrastructure simply does not exist elsewhere.
When big ASX news breaks, our subscribers know first
Why Asian Demand Amplifies Every Hormuz Disruption
The geographic asymmetry of who depends on Hormuz is often underappreciated. More than 80% of all shipments transiting the strait are destined for Asian economies, principally China, Japan, South Korea, and India. These nations have built their energy security models around Gulf supply, and any disruption immediately creates a scramble for replacement cargoes from alternative origins.
This dynamic positions Australia in a structurally advantageous place. Australian LNG exports do not transit the Strait of Hormuz. They flow directly into the Asia-Pacific market from terminals along the northwest coast. When Middle Eastern supply becomes uncertain, Asian buyers face a straightforward calculation: secure more volume from producers whose supply chains carry no Persian Gulf risk. That calculation redirects commercial attention toward Woodside and Santos with meaningful speed. Furthermore, LNG supply dynamics in 2025 offer useful context for understanding how Australian producers are positioned heading into this period of heightened uncertainty.
The secondary effect involves European markets bidding more aggressively for diverted LNG cargoes from other origins, tightening the global LNG market further and supporting price floors across all production basins, including Australia's.
Scenario Modelling: What Different Durations of Closure Actually Mean
Not all disruptions carry equal weight. The duration of a Hormuz restriction is arguably more important than its initial severity, because the global energy system has buffers that can absorb short-term shocks but erode rapidly under sustained pressure.
| Scenario | Duration | Brent Crude Projection | Estimated Global GDP Impact |
|---|---|---|---|
| Brief Disruption | Under 2 weeks | US$100 to US$120/bbl | Negligible |
| Moderate Disruption | 1 to 3 months | US$130 to US$160/bbl | -0.1% to -0.2% |
| Extended Disruption | Through end of 2026 | Up to US$200/bbl | -0.4% contraction |
Wood Mackenzie's extended disruption modelling projects Brent crude reaching US$200 per barrel under the most severe scenario where the strait remains effectively closed through the final months of 2026. A 0.4% global GDP contraction under this pathway would represent a demand destruction event comparable to what analysts have characterised as the third global recession of the current century.
An often-overlooked compounding factor involves onshore storage infrastructure. As tanker traffic stalls at the mouth of the Gulf, storage tanks at producing facilities fill progressively. Once storage capacity reaches operational limits, producers face the unpalatable choice of curtailing output entirely, removing supply from the global market in a way that becomes self-reinforcing even after the strait reopens.
The 2026 Whipsaw: How Geopolitics Compressed Months of Repricing Into Single Sessions
The conflict timeline that began on 28 February 2026 introduced a pattern of price behaviour rarely seen in modern energy markets. Rather than the gradual repricing that typically follows supply uncertainty, each diplomatic development has triggered same-day price movements of a magnitude that would normally unfold across weeks. Consequently, understanding oil price movements during trade war periods provides valuable historical context for interpreting current volatility patterns.
The market has now whipsawed in both directions multiple times since the conflict began. Each reversal has produced an immediate and material share price reaction across the major ASX energy names.
WTI settled at US$76.64 per barrel and Brent at US$79.38 per barrel following the initial interim agreement between the US and Iran and the brief reopening of the strait. That pricing reflected a significant risk premium being removed from the market within a compressed timeframe. Days later, the strait was re-closed, and the premium began reasserting itself.
For ASX investors, this volatility pattern has a specific implication: the information content of any single price point is unusually low. A stock price today may reflect assumptions about Hormuz status that are reversed before the next trading session opens. Analysts following ASX stocks amid the Iran oil shock have noted similar caution around reading too much into any single day's pricing.
How the Transmission Mechanism Works: From Hormuz to ASX Share Prices
Understanding exactly how a geopolitical event in the Persian Gulf translates into a Santos share price move in Sydney requires mapping the transmission chain clearly.
Step 1: A Hormuz disruption event reduces expected global oil and LNG supply availability.
Step 2: Global benchmark prices rise to ration available supply and incentivise alternative production.
Step 3: ASX-listed producers who price their output against Brent or JKM (the Japan-Korea Marker for LNG) see immediate improvements in their realised revenue forecasts.
Step 4: Equity markets reprice producer shares to reflect higher earnings expectations, typically within the same trading session.
Step 5: Simultaneously, a risk-off rotation occurs across the broader ASX, with capital flowing out of rate-sensitive and consumer-facing sectors and into commodity producers and gold names.
The reverse chain operates with equal speed when diplomatic progress is announced, which explains the 8% single-session decline Santos experienced when the initial interim peace agreement was announced. In addition, OPEC's influence on global oil markets adds another layer of complexity to how supply-side decisions interact with these geopolitical disruption events.
Woodside Energy (ASX: WDS): Project Milestone as a Secondary Catalyst
Is Woodside Still a Buy in a Volatile Energy Environment?
Woodside has risen approximately 21% year to date in 2026, making it one of the strongest performers across the entire ASX energy sector. While elevated oil prices have provided the primary tailwind, Woodside carries a structural earnings catalyst that operates independently of where Brent settles in any given week.
The Scarborough LNG project has reached 94% completion, with first cargo targeted for Q4 2026. This milestone matters for a specific reason: once Scarborough begins production, Woodside transitions from a company whose earnings are almost entirely dependent on existing production rates to one with a meaningful volume growth profile. LNG sold under long-term contracts provides revenue visibility that smooths the impact of spot price volatility.
Peak Asset Management holds a hold rating on Woodside, noting that the company has continued to execute strongly at the operational level. Quarterly production fell 8% due to seasonal weather disruptions, but the average realised oil price increased 11% in Q1 2026, partially offsetting the volume reduction. The hold stance reflects constructive views on operations tempered by the genuine difficulty of forecasting near-term share price direction while Hormuz uncertainty persists.
Woodside Key Metrics at a Glance:
- YTD performance: approximately +21%
- Scarborough LNG: 94% complete, first cargo targeted Q4 2026
- Q1 2026 realised oil price: up 11% despite weather-related volume decline
- Broker stance: Hold (Peak Asset Management)
The next major ASX story will hit our subscribers first
Santos (ASX: STO): Higher Sensitivity, Partial Insulation
Santos has gained approximately 18% year to date in 2026 and presents a subtly different risk profile to Woodside. The company's Barossa LNG project is producing at 75% of its planned 2026 rates, providing a base level of contracted revenue that offers some earnings insulation against oil price swings.
However, the 8% single-session decline Santos recorded when the initial peace agreement was announced demonstrates that the market prices Middle East risk into this stock with considerable aggression. Investors holding Santos are, in effect, holding a partial proxy for Hormuz uncertainty in addition to their LNG project exposure.
The key differentiator between Woodside and Santos in this environment comes down to project stage maturity. Woodside's Scarborough is approaching completion and will shift the company's earnings profile materially. Santos's Barossa ramp is already contributing but has not yet reached full planned capacity, meaning the upside from operational progress is less immediate.
Beach Energy (ASX: BPT): Commodity Leverage With an Internal Headwind
Beach Energy occupies the highest-leverage position among the three major ASX energy producers relative to oil price movements. As the smallest by market capitalisation, a given percentage change in the oil price translates into a proportionally larger earnings impact than it would for Woodside or Santos.
In theory, this makes Beach Energy the most responsive beneficiary of a prolonged Hormuz disruption and sustained elevated oil prices. In practice, 2026 has demonstrated a complicating factor: a production guidance downgrade issued earlier in FY2026 has created a company-specific drag that limits the stock's ability to fully capture commodity price upside.
Investors must distinguish between commodity price leverage and earnings leverage. They are not the same thing when company-specific operational challenges are present.
Beach Energy's underperformance relative to its peers during periods of rising oil prices illustrates this distinction clearly. The stock may outperform if oil prices surge dramatically, but investors are taking on execution risk layered on top of commodity risk, which requires a different sizing and risk management approach than holding WDS or STO.
Comparative Summary: WDS, STO, and BPT
| Metric | Woodside (WDS) | Santos (STO) | Beach Energy (BPT) |
|---|---|---|---|
| YTD Performance (2026) | ~+21% | ~+18% | Underperforming peers |
| Key Project Status | Scarborough 94% complete | Barossa at 75% of planned rates | Guidance downgrade weight |
| Oil Price Sensitivity | Moderate-High | High | Highest |
| Single-Session Reaction (Peace Deal) | Significant decline | -8% | Muted relative to oil price |
| Broker View | Hold | Divided | Cautious |
The Cape of Good Hope Rerouting Effect: An Underappreciated LNG Demand Driver
When the Hormuz corridor closes or becomes operationally risky, tanker operators redirect traffic around the Cape of Good Hope, adding approximately 10 to 15 sailing days per voyage. This additional transit time has three cascading effects that are rarely discussed in mainstream coverage of the crisis.
First, effective supply availability tightens even if physical production volumes are unchanged, because more vessels are tied up in transit at any given time. Second, freight costs escalate, adding a further cost layer to Middle Eastern supply that makes it less competitive versus geographically closer alternatives. Third, Asian buyers facing supply uncertainty under longer lead times increase their interest in long-term supply agreements with producers who offer reliable, short-transit delivery, which describes Australian LNG exporters precisely.
Historical precedent from previous Persian Gulf disruption events suggests that sustained uncertainty accelerates long-term contracting activity from Japanese, South Korean, and Chinese buyers. This represents a potential structural benefit for Woodside and Santos that extends beyond the immediate oil price uplift and could influence their contracted revenue positions for years following the resolution of the current conflict. Furthermore, broader global energy market impacts on ASX stocks in 2026 underscore why this structural shift deserves serious attention from long-term investors.
Portfolio Construction During Sustained Energy Volatility
The frequency and magnitude of single-session moves in ASX energy stocks during Hormuz events creates specific challenges for portfolio construction that differ from managing exposure during normal commodity cycles. The Strait of Hormuz closure and ASX energy shares relationship is particularly important to understand when building resilient portfolios in this environment.
Three scenario pathways and their implications:
- Escalation continues or strait remains closed: Oil prices move toward the US$130 to US$200 per barrel range. ASX energy names likely outperform. Risk-off rotation pressures banks, technology, and retail sectors.
- Full diplomatic resolution and Hormuz reopening: Oil prices retrace sharply toward pre-conflict levels. ASX energy stocks give back risk premiums rapidly. Broader market sentiment improves.
- Prolonged partial disruption (most probable): Prices remain elevated but volatile, oscillating with each diplomatic headline. LNG producers with contracted revenue streams demonstrate relative earnings resilience.
For investors building positions in this environment, several considerations apply:
- Diversification across project stages reduces the sensitivity of portfolio earnings to any single operational event.
- Position sizing discipline is essential given the documented 5 to 8% single-session swings across WDS and STO.
- Time horizon alignment matters critically. Short-term traders and long-term investors face fundamentally different risk-reward equations in this environment, and conflating the two can lead to poorly timed entries and exits.
- Company-specific risk assessment must accompany commodity price analysis. Beach Energy's experience in 2026 illustrates how internal operational challenges can prevent a stock from capturing the upside that macro conditions theoretically provide.
Frequently Asked Questions
How quickly do ASX energy stocks react to Hormuz news?
Market evidence from 2026 shows that major ASX energy stocks have repriced by 5 to 8% within a single trading session following both escalation and de-escalation announcements. The reaction speed reflects the direct link between oil price benchmarks and producer revenue forecasts.
Do Australian LNG exports transit the Strait of Hormuz?
No. Australian LNG exports do not pass through the Strait of Hormuz. However, Australian producers benefit indirectly through higher global LNG prices and increased demand from Asian buyers seeking supply diversification away from Middle Eastern sources during disruption events. Understanding oil futures and global energy benchmarks helps clarify how these pricing dynamics flow through to Australian producers.
Which ASX energy stock carries the most oil price sensitivity?
Beach Energy carries the highest proportional leverage to oil price changes among the three major ASX energy producers. However, company-specific headwinds from a production guidance downgrade in FY2026 may limit its ability to fully capture upside relative to Woodside and Santos in the near term.
How does the Strait of Hormuz closure affect broader ASX investor confidence?
Beyond direct energy producers, the Strait of Hormuz closure and ASX energy shares dynamic creates ripple effects across the broader market. Navigating geopolitical risk on the ASX requires investors to understand how energy supply shocks flow through to inflation expectations, interest rate sentiment, and sector rotation patterns. The trade war's broader impact on oil markets also compounds these effects, adding further uncertainty to an already complex environment.
What oil price has recently been observed following interim agreement announcements?
Following the initial interim peace agreement and brief Hormuz reopening, WTI settled near US$76.64 per barrel and Brent near US$79.38 per barrel. The subsequent re-closure of the strait suggests these levels did not capture the full geopolitical risk premium that had been embedded in energy prices.
This article contains general information only and does not constitute financial advice. Past performance is not indicative of future returns. Investors should consider their own circumstances and consult a licensed financial adviser before making investment decisions. Forecasts and scenario projections referenced in this article involve assumptions that may not materialise.
Want to Stay Ahead of the Next Major ASX Resource Discovery?
While geopolitical volatility reshapes energy markets overnight, Discovery Alert's proprietary Discovery IQ model scans ASX announcements in real time, delivering instant alerts on significant mineral discoveries so subscribers can act before the broader market catches on — explore historic discoveries and their returns, then begin a 14-day free trial at Discovery Alert to secure a genuine market-leading edge.