August 26, 2026
The Quiet Wealth Engine Hidden Inside Blue-Chip Mining Stocks
Most investors dramatically underestimate how much of their long-term returns from large-cap resource stocks come not from share price movement, but from the steady accumulation of dividend income. In the resources sector, where commodity cycles can compress and expand capital values by 40% or more within a single year, this distinction is not just academic. It determines whether an investor walks away from a five-year holding period with a modest gain or a genuinely transformative outcome.
BHP Group Ltd (ASX: BHP) sits at the centre of this dynamic better than almost any other stock on the Australian Securities Exchange. Understanding the actual return profile of BHP shares return over 5 years reveals something most casual observers miss entirely: the gap between what the share price alone tells you and what total shareholder return actually delivers is enormous.
When big ASX news breaks, our subscribers know first
Why BHP's Return Story Begins With How You Measure It
Before examining the raw numbers, it is worth establishing why measurement methodology matters so profoundly for a stock like BHP. Unlike a pure growth company that reinvests all earnings, BHP operates as a dual-engine wealth generator. One engine is capital appreciation driven by commodity prices, global demand cycles, and operational efficiency. The other is a high-yield dividend stream that, for Australian investors, carries the added benefit of franking credits.
When analysts refer to price return, they are measuring only the movement in the share price itself. When they refer to total shareholder return (TSR), they are capturing everything: capital gains, dividend income, and the compounding effect of reinvesting those dividends into additional shares. For a stock with BHP's dividend history, the difference between these two numbers is not marginal. It is the difference between a satisfying result and an exceptional one.
Furthermore, the BHP strategic pivot toward copper and away from certain legacy assets has added an additional dimension to how analysts frame the company's long-term value proposition.
Measuring BHP's performance using price-only return is like judging the productivity of a farm by counting only the size of the property, ignoring entirely what it actually grows and harvests each season.
BHP Shares Return Over 5 Years: Breaking Down the Journey
The Starting Point: Late 2020
At the close of 2020, BHP shares were trading at approximately $36.63. This was not an obviously cheap entry point at the time. The world was navigating pandemic-related uncertainty, global supply chains were disrupted, and the iron ore demand outlook was anything but clear. Investors who entered at this level were taking on meaningful cyclical risk.
The initial phase of the holding period was characterised by sharp volatility. Shares briefly retreated into the low $30s before commodity markets began responding to a powerful combination of fiscal stimulus, infrastructure spending, and a faster-than-expected Chinese economic rebound.
Phase Two: The Commodity Supercycle (2021 to 2022)
By 2021, iron ore prices had surged dramatically, with benchmark 62% Fe iron ore contracts reaching historic levels above US$200 per tonne at their peak in mid-2021. BHP's earnings reflected this windfall. The company's iron ore division, centred on its Pilbara operations in Western Australia, generates the bulk of the company's underlying EBITDA, and the price surge translated almost directly into record profitability and correspondingly large dividends.
During this phase, BHP shares climbed above $50 and the company distributed extraordinary dividend payouts to shareholders, including special dividends layered on top of its regular interim and final distributions. This period alone accounted for a disproportionate share of the cumulative ~$19 per share in total dividends paid across the five-year holding window.
Phase Three: The China Property Correction (2022 to 2024)
The commodity cycle turned decisively when China's property sector entered a prolonged contraction. Developers like Evergrande and Country Garden became emblematic of a structural crisis in Chinese real estate, which had historically consumed roughly 50 to 55% of China's total steel output. The challenges facing China steel and iron ore markets during this period were significant and far-reaching, as construction activity slowed, iron ore demand weakened and prices fell sharply from their supercycle highs.
BHP shares retreated toward the high $30s during this correction phase, frustrating investors who had entered near cycle peaks. This is one of the most important and frequently underappreciated risks of holding resource stocks: entry timing within a commodity cycle has an outsized effect on interim returns, even when the long-term outcome remains positive.
Phase Four: Recovery and Record Highs in 2026
By mid-2026, BHP shares had not merely recovered. They had climbed to a new all-time record of $68.22, reflecting a year-to-date gain of approximately 48% and a 12-month return of approximately 58%. The recovery was driven by a combination of improved sentiment around Chinese stimulus measures, resilient copper demand tied to global electrification trends, and BHP's own operational improvements across its portfolio.
What a $25,000 Investment Would Actually Be Worth Today
The Capital Gain Component
An investor who allocated $24,987 to BHP shares at $36.63 per share in late 2020 would have acquired approximately 682 shares. With BHP trading near $67 per share by mid-2026, the capital value of that holding (excluding any dividend reinvestment) would be approximately $45,694, representing a capital gain of roughly $20,707.
That is a respectable outcome on its own. However, it tells less than half the story.
Adding the Dividend Income Stream
Over the same five-year period, BHP distributed approximately $19 per share in total dividends across its regular half-yearly payments and, in certain periods, additional special dividends. Applied across 682 shares, this translates to approximately $12,958 in cumulative dividend income.
| Metric | Value |
|---|---|
| Initial Investment | ~$24,987 |
| Entry Price (End of 2020) | $36.63 per share |
| Shares Purchased | 682 |
| Share Price (Mid-2026) | ~$67.00 |
| Capital Value (Dividends Taken as Cash) | ~$45,694 |
| Estimated Total Dividends Received | ~$12,958 |
| Total Cash Value (Dividends as Income) | ~$58,650 |
| Total Gain Without Reinvestment | ~$33,663 |
Adding capital value and accumulated dividend income together produces a total return position of approximately $58,650, more than doubling the original capital outlay without any dividend reinvestment. You can view current BHP pricing and historical data directly on the ASX company page to track how these figures evolve over time.
The DRP Advantage: What Reinvesting Dividends Actually Delivers
How BHP's Dividend Reinvestment Plan Works
BHP operates a dividend reinvestment plan that allows shareholders to elect, at no brokerage cost, to have their cash dividends automatically applied to the purchase of additional BHP shares. Historically, the DRP has offered shares at a small discount to the prevailing market price, adding a marginal but meaningful advantage to the reinvestment price.
The mechanics are straightforward: instead of receiving a cash payment, the shareholder receives additional shares calculated by dividing the dividend entitlement by the DRP offer price. Over multiple dividend cycles, this compounds the share count progressively.
From 682 Shares to Approximately 806 Shares
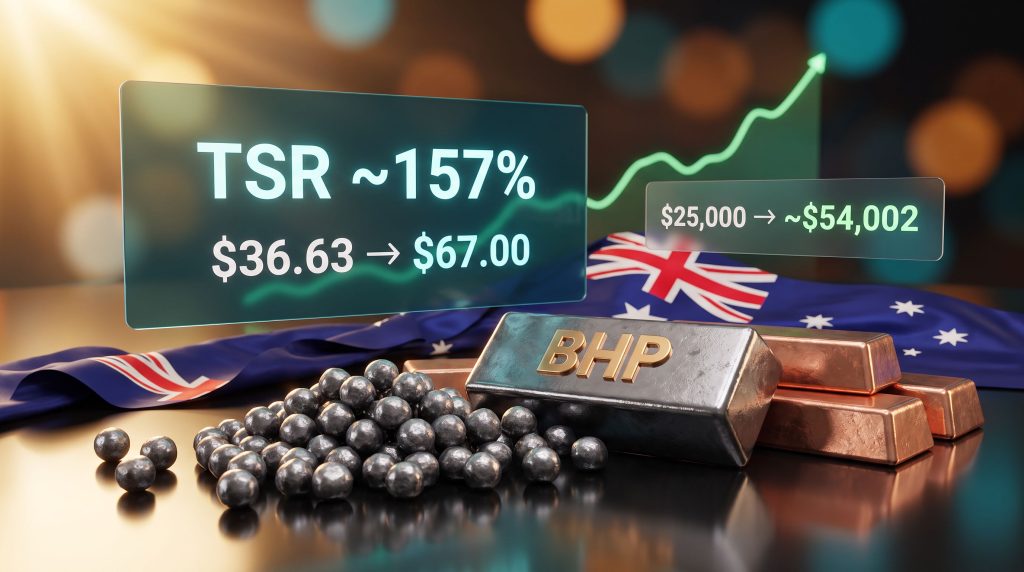
Assuming dividends were reinvested across the five-year period at an average price of approximately $51 per share, the original holding of 682 BHP shares would have grown to roughly 806 shares. At a current price of approximately $67, that accumulated holding would be worth approximately $54,002.
Compared against the original $24,987 outlay, the DRP investor's gain exceeds $29,000, representing a total return of more than 116% on original capital.
The DRP mechanism effectively converted BHP's cyclical price weakness into a structural accumulation advantage. Every time shares traded in the $30s and $40s during the China-driven correction, reinvested dividends acquired more shares at lower prices. When the cycle recovered, those additional shares amplified the capital rebound.
Why Volatility Becomes an Asset Under DRP Investing
This is one of the least appreciated dynamics in long-term resource stock investing. Conventional investor psychology treats price volatility as a threat to wealth. Under a systematic DRP framework, however, volatility during a period of ongoing dividend payments actually serves the investor by lowering the average cost base of the accumulated position. The lower the reinvestment price during down cycles, the greater the share count built up ahead of the eventual recovery.
Return Comparison: Price Alone vs. Total Shareholder Return
| Return Metric | Approximate 5-Year Outcome |
|---|---|
| Share Price Return Only (AUD) | ~83%–86% |
| Total Shareholder Return with DRP | ~116%+ |
| Total Shareholder Return (Dividends as Cash) | ~135%+ |
| Broader TSR Estimates (AUD, various sources) | ~157%–161% |
| U.S.-Listed BHP ADR (USD, currency-adjusted) | ~128% |
| ASX 200 Total Return Index (Estimated) | ~50%–65% |
The table above illustrates why standardising return methodology is so important before drawing any conclusions. A price-only comparison between BHP and the ASX 200 benchmark understates BHP's outperformance significantly. The true comparison must include dividends on both sides of the ledger.
The next major ASX story will hit our subscribers first
Is BHP a Dividend Stock, a Growth Stock, or a Hybrid?
Understanding BHP's Dual Return Architecture
BHP is best understood not as a traditional growth stock or a simple income vehicle, but as a commodity-linked total return machine. Its capital appreciation is inherently cyclical, driven by the price of iron ore, copper, and to a lesser extent coal. Its dividend yield, while variable, has historically been generous relative to global peers, particularly during boom phases when the company pursues a policy of returning surplus cash to shareholders.
For Australian investors specifically, the franking credit component of BHP's dividends adds meaningful after-tax value that does not appear in headline yield figures. Fully or partially franked dividends effectively reduce the tax liability on dividend income, boosting the after-tax return relative to an equivalent unfranked yield.
How BHP Stacks Up Against ASX Peers
BHP's five-year TSR of approximately 157% to 161% in AUD terms places it significantly ahead of the ASX 200's estimated total return of roughly 50% to 65% over the same period. While direct comparisons with Rio Tinto (ASX: RIO) and South32 (ASX: S32) depend heavily on specific methodology and reference periods, BHP's scale, portfolio diversification across iron ore, copper, and potash, and its consistent dividend discipline have historically supported superior through-cycle returns relative to many smaller domestic resource peers. Furthermore, detailed long-term return data is available via Macrotrends, which tracks BHP's full stock price history across multiple market cycles.
Key Risks Every BHP Long-Term Investor Must Understand
BHP's return profile does not come without meaningful risk. Investors considering a long-term position should weigh the following factors carefully:
-
Iron ore concentration risk: A substantial portion of BHP's earnings originates from its Pilbara iron ore operations. Iron ore prices are notoriously sensitive to Chinese steel demand, which itself is tied to property construction and infrastructure investment cycles.
-
China demand dependency: China consumes approximately half of the world's steel production and is therefore the single most important demand driver for BHP's most profitable commodity. A structural deceleration in Chinese fixed asset investment could weigh on returns over an extended period.
-
Commodity price cyclicality: As the 2022 to 2024 correction demonstrated, investors who enter near cycle peaks can experience extended drawdown periods before recovery materialises. Timing of entry within the commodity cycle meaningfully affects interim performance even when long-term outcomes are positive.
-
Currency exposure: BHP's revenues are predominantly denominated in US dollars, while the company is listed in Australian dollars. For international shareholders or those using USD-denominated benchmarks, currency fluctuations can either amplify or erode returns relative to the AUD-denominated picture.
-
Geopolitical and regulatory risk: BHP operates across multiple jurisdictions including Australia, Chile, Canada, and historically South Africa. Changes in royalty regimes, environmental regulations, or political conditions in any of these regions represent ongoing tail risks.
Investors who entered BHP shares near the cycle highs of 2021 and 2022 experienced extended periods of paper losses before the 2026 recovery materialised. This underscores why position sizing, entry discipline, and a willingness to hold through volatility are as important as stock selection itself.
How to Calculate Your Own BHP Return Scenario
Investors who want to assess their own BHP return position can follow this structured approach:
-
Identify your specific entry price and the exact number of shares purchased at the time of investment.
-
Source the complete dividend history for BHP across your holding period, available through the ASX or BHP's investor relations website.
-
Determine whether you elected the DRP or took dividends as cash, as this fundamentally changes the share count and total return calculation.
-
If using DRP, estimate the average reinvestment price across dividend cycles to calculate the number of additional shares acquired.
-
Apply the current share price to your total share count (original plus reinvested) to determine current capital value.
-
Add any cash dividends received (if not reinvested) to arrive at total return in dollar terms.
-
For Australian resident investors, factor in the franking credit component of dividends received, as this affects the after-tax return calculation and can add several percentage points to the effective yield.
-
Benchmark the result against the ASX 200 Total Return Index over the same period to assess whether the investment outperformed or underperformed the broader market.
Key Takeaways for Long-Term Investors in BHP
-
The BHP shares return over 5 years tells a fundamentally different story depending on whether dividends are included, reinvested, or ignored entirely.
-
A $24,987 investment made at end-2020 prices would be worth approximately $54,002 by mid-2026 under a dividend reinvestment strategy, representing a gain exceeding $29,000.
-
The DRP mechanism is not merely a convenience feature. It is an active wealth-compounding tool that systematically converts cyclical price weakness into long-term share count growth.
-
BHP's five-year TSR of approximately 157% to 161% in AUD terms substantially outpaced the ASX 200 total return index over the same period.
-
The China property sector correction between 2022 and 2024 was a genuine test of investor conviction, and those who maintained their positions and continued reinvesting through that trough were disproportionately rewarded when the recovery arrived.
-
For Australian resident investors, franking credits represent a silent but material enhancement to after-tax dividend returns that should always be factored into any genuine total return calculation.
This article is intended for general informational and educational purposes only and does not constitute personal financial advice. Past performance is not indicative of future results. All return figures are estimates based on available data and may vary depending on methodology, timing, and individual circumstances. Investors should consult a licensed financial adviser before making investment decisions.
Readers interested in broader perspectives on long-term ASX investing and blue-chip return analysis may find value in educational content published by Motley Fool Australia at fool.com.au, which regularly covers BHP Group and wider ASX 200 investment themes.
Want to Discover the Next Major ASX Resource Opportunity Before the Broader Market?
While blue-chip miners like BHP offer steady long-term compounding, Discovery Alert's proprietary Discovery IQ model scans ASX announcements in real time, instantly alerting subscribers to significant mineral discoveries with the potential for transformative returns — explore historic discovery outcomes to understand what early positioning can deliver, then begin a 14-day free trial at Discovery Alert to gain an immediate market-leading edge.