June 20, 2026
When a Handful of Holes in the Ground Move Global Markets
Few industrial sectors illustrate the concept of concentrated risk as vividly as large-scale copper mining. Across almost every major economy, copper sits at the intersection of electrification, construction, defence manufacturing, and digital infrastructure. Yet the physical supply of this irreplaceable metal flows predominantly from a remarkably small number of massive operations scattered across five countries.
Understanding which operations sit at the top of that hierarchy, and why their performance matters far beyond their immediate geography, has never been more analytically important than it is heading into the second half of the 2020s.
The world's top 10 biggest copper mines are not simply large industrial facilities. They are, collectively, the structural backbone of global copper supply, responsible for more than one-fifth of all copper metal mined globally in 2025. That figure, approximately 4.9 million tonnes combined output, represents a degree of supply concentration that creates systemic sensitivity to geological events, community relations breakdowns, and sovereign policy shifts at any single site.
When big ASX news breaks, our subscribers know first
The Supply Crisis Reshaping Copper Markets in 2026
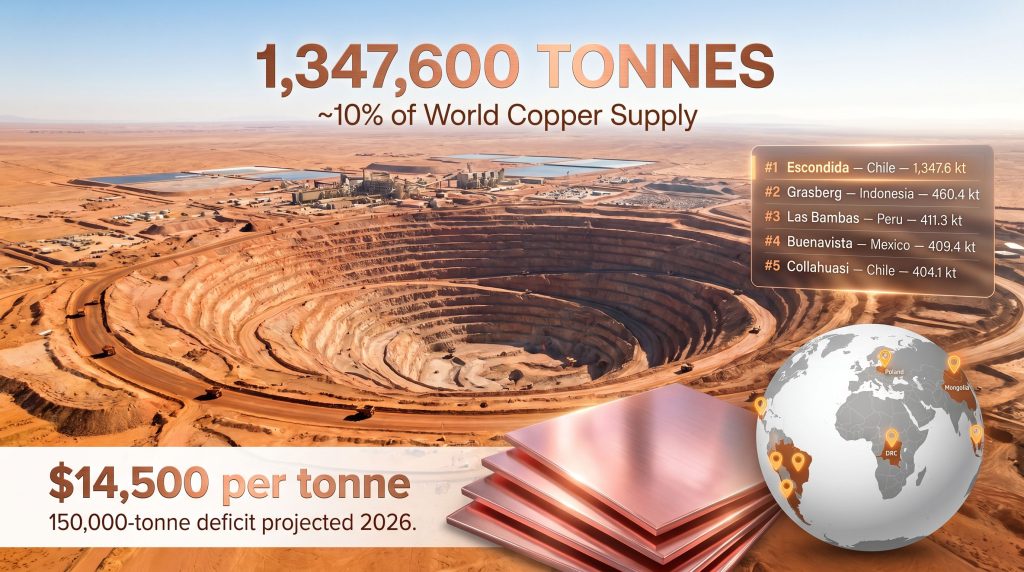
Copper entered 2026 under conditions that commodity analysts rarely encounter in a single cycle. Benchmark prices surged 40% across 2025, driven by a convergence of geopolitical trade pressures, critical mineral classification, and a series of major operational disruptions at several of the world's largest producing complexes. By January 2026, copper reached a record $14,500 per tonne, with prices approaching another record high as of mid-May 2026.
The International Copper Study Group reversed its prior surplus forecast entirely, now projecting a 150,000-tonne deficit for 2026 — a dramatic reassessment reflecting the severity of structural supply-side constraints now embedded in the market.
What makes this pricing environment particularly significant is the nature of the forces driving it. Unlike demand-side surges, which tend to be cyclical, the current copper supply crunch constraints are geological and infrastructural in character. Rising energy costs are compressing production economics at high-cost operations, while a growing shortage of sulfuric acid — a chemical essential to approximately one-fifth of all global copper production via the SX/EW leach process — is being identified as a potential next-wave price catalyst.
Major financial institutions including Goldman Sachs have publicly signalled further optimism for copper prices, citing persistent supply-side disruption as a structural foundation rather than a temporary condition. Consequently, understanding the copper price drivers at play has become essential for investors and analysts alike.
The 2024–2025 period demonstrated just how fragile large-mine supply can be. Seismic events, landslide disasters, and sustained community blockades struck multiple top-tier operations simultaneously, removing hundreds of thousands of tonnes from global supply at precisely the moment demand trajectories were strengthening on expectations of AI infrastructure buildout and accelerating electrification investment.
Understanding the Metrics: Why Capacity Means Little Without Context
Before examining the world's top 10 biggest copper mines by 2025 output, it is worth establishing the analytical framework that determines how mines are ranked and compared.
| Metric | Definition | Best Applied For |
|---|---|---|
| Nameplate Capacity | Maximum theoretical annual output under ideal operating conditions | Long-term investment sizing and project-level comparisons |
| Actual Production | Copper metal physically extracted and processed during a calendar year | Operational benchmarking and near-term market impact analysis |
| Attributable Production | Output allocated to each equity owner based on their ownership stake | Corporate-level portfolio comparisons across mining majors |
This ranking is ordered by verified 2025 actual copper metal production, the most operationally relevant measure available. Nameplate capacity figures are referenced where meaningful gaps exist, as these divergences often reveal critical strategic insights about ramp-up trajectories, infrastructure constraints, or recovery timelines following disruptions.
A striking illustration of this principle: Collahuasi in Chile operates with a nameplate capacity of approximately 610,000 tonnes per year, yet produced just over 404,000 tonnes in 2025 — a utilisation gap of roughly 206,000 tonnes annually. That gap reflects genuine infrastructure constraints (specifically freshwater scarcity at over 4,400 metres elevation) that no amount of mining productivity can overcome without targeted capital solutions.
Similarly, Kamoa-Kakula targets 600,000-plus tonnes at Phase 3 completion, yet produced under 386,000 tonnes in 2025 following a seismic disruption that flooded underground workings. These gaps are not inefficiencies to be dismissed; they are strategic signals pointing toward future production trajectories.
Geographic Distribution: Where Copper Supply Actually Comes From
The geographic footprint of large-scale copper production is dramatically skewed toward the Americas, with the Andes mountain range functioning as the geological backbone of global copper supply. Furthermore, understanding the largest copper mines and their regional spread reveals just how concentrated this critical supply chain truly is.
| Region | Top 10 Mines | 2025 Combined Output (approx.) | Share of Top 10 |
|---|---|---|---|
| South America (Chile & Peru) | 5 | ~2.93 million tonnes | 59% |
| Asia-Pacific (Indonesia & Mongolia) | 2 | ~805,500 tonnes | 16% |
| Central America (Mexico) | 1 | ~409,400 tonnes | 8% |
| Europe (Poland) | 1 | ~401,100 tonnes | 8% |
| Africa (DRC) | 1 | ~385,800 tonnes | 8% |
Chile's geological endowment — anchored by the porphyry copper deposits of the Atacama and Antofagasta regions — remains the world's largest known copper reserve base. Porphyry deposits are large, low-to-medium grade copper systems formed by hydrothermal fluids associated with ancient volcanic systems. They are ideally suited to high-volume, low-cost bulk mining methods, which is precisely why the Andes corridor hosts such a disproportionate share of global supply.
Why Chile's Dominance Matters
The Chile copper supply gap and its outsized role in global copper markets underscores a critical structural vulnerability. One structural surprise in the 2025 rankings: Codelco, Chile's state-owned copper giant and historically the world's dominant copper producer, does not have a single operation qualifying for the top 10 by production output — even after BHP recently overtook it as the world's number one copper producer on an attributable basis.
This reflects both Codelco's portfolio structure (multiple medium-to-large operations rather than a single dominant site) and the extraordinary scale that the top 10 threshold now demands.
Africa's emergence as a tier-one copper jurisdiction, anchored by the DRC's Kamoa-Kakula complex, represents the most strategically significant new development in the geographic distribution of global copper supply. Its high-grade underground deposits and accelerated ramp-up trajectory have fundamentally altered expectations for African supply contributions, even as 2025 operational setbacks temporarily reduced its rankings position.
Ranked: The World's Top 10 Biggest Copper Mines (2025 Production)
Consolidated Rankings at a Glance
| Rank | Mine | Country | 2025 Production (kt) | Nameplate Capacity (kt/yr) | Primary Operator |
|---|---|---|---|---|---|
| 1 | Escondida | Chile | 1,347.6 | ~1,400 | BHP |
| 2 | Grasberg | Indonesia | 460.4 | ~400–600 | Freeport-McMoRan |
| 3 | Las Bambas | Peru | 411.3 | ~430 | MMG |
| 4 | Buenavista del Cobre | Mexico | 409.4 | ~525 | Southern Copper |
| 5 | Collahuasi | Chile | 404.1 | ~610 | Glencore / Anglo American |
| 6 | KGHM Polska Miedz | Poland | 401.1 | ~450 | KGHM Polska Miedz S.A. |
| 7 | Cerro Verde | Peru | 391.5 | ~500 | Freeport-McMoRan |
| 8 | Kamoa-Kakula | DRC | 385.8 | ~600+ | Ivanhoe Mines |
| 9 | Antamina | Peru | 368.0 | ~450 | BHP / Glencore / Teck |
| 10 | Oyu Tolgoi | Mongolia | 345.1 | ~500 | Rio Tinto |
According to Visual Capitalist's analysis of copper mine capacity, these rankings reflect both the scale and the growing complexity of operating at a global tier-one level. For further independent context on production rankings, Mining Technology's overview of the ten largest copper mines provides useful corroborating data.
#10 — Oyu Tolgoi | Mongolia | 345,100 Tonnes
Operator: Rio Tinto (majority operator) | Government Partner: Erdenes Mongol LLC (34% stake)
Oyu Tolgoi occupies a uniquely complex position among the world's top copper operations. Situated in the South Gobi Desert, it hosts one of the largest undeveloped copper-gold deposits ever brought into large-scale production, with an $18 billion underground expansion program progressively lifting output toward its 500,000-tonne nameplate capacity.
The strategic complication in 2026 is sovereign in nature. Mongolia's government has reopened commercial negotiations, pressing for accelerated profit distributions and a larger revenue share from the project — a dynamic that introduces political risk considerations investors are watching carefully. This kind of renegotiation pressure is not unique to Oyu Tolgoi; it reflects a broader global trend of resource-rich governments reasserting commercial terms as commodity prices escalate.
- Mine type: Open pit + underground Hugo North block cave expansion
- Key commodities: Copper, gold, and silver
- 2026 risk factor: Sovereign commercial renegotiation underway
#9 — Antamina | Peru | 368,000 Tonnes
Operator: BHP, Glencore, Teck Resources, Mitsubishi (joint venture)
Operating at approximately 4,300 metres above sea level in the Peruvian Andes, Antamina is one of the world's largest polymetallic mining operations, extracting copper alongside zinc, molybdenum, and silver from a single orebody. Its four-owner joint venture structure — spanning BHP, Glencore, Teck, and Mitsubishi — reflects both the enormous capital requirements of operating at this scale and altitude, and the strategic value that multiple mining majors assign to its output.
The forward-looking picture for Antamina is particularly compelling: operators publicly forecast a near-20% uplift in copper production for 2026, positioning it as one of the sector's most significant near-term output growth contributors among established large-scale operations.
- Elevation: ~4,300 metres above sea level
- Key by-products: Zinc, molybdenum, silver
- 2026 production growth target: Approximately 20% output increase
#8 — Kamoa-Kakula | Democratic Republic of Congo | 385,800 Tonnes
Operator: Ivanhoe Mines, Zijin Mining, Crystal River Global, DRC Government (joint venture)
Kamoa-Kakula's trajectory is one of the most dramatic narratives in recent mining history. It entered the global top 10 as one of the fastest-ramping copper operations ever developed, reaching third place in global production rankings before a series of severe operational setbacks in 2025 pulled output considerably lower, dropping it to eighth place in the current rankings.
A significant seismic event in 2025 caused severe underground flooding at the Kakula mine, forcing a three-week operational suspension. By April 2026, management had materially reduced near-term production guidance, citing underground rehabilitation and access development work expected to constrain ore delivery for 18 to 24 months.
What distinguishes Kamoa-Kakula from most operations in this ranking is its grade profile. The deposit hosts some of the highest copper grades among any large-scale operation globally — a geological attribute that translates directly into lower processing costs per tonne of metal recovered and stronger margins at any given copper price. Once rehabilitation work is complete and Phase 3 expansion targets are achieved, the complex is positioned to potentially claim one of the top two positions in global rankings.
- Grade advantage: Among the highest-grade large copper deposits anywhere on Earth
- Phase 3 target: 600,000-plus tonnes per year
- Near-term constraint: 18–24 month rehabilitation and development window before full ramp-up
#7 — Cerro Verde | Peru | 391,500 Tonnes
Operator: Freeport-McMoRan (majority), Sumitomo, Buenaventura (joint venture)
Cerro Verde carries a distinction that extends well beyond its production ranking: it occupies a historically significant position in the evolution of copper processing technology. Peru's government first developed the site's oxide ore deposits in 1972, constructing one of the world's earliest commercial solvent extraction and electrowinning (SX/EW) facilities. This hydrometallurgical process, which recovers copper from leached solutions rather than through conventional smelting, has since become foundational to global copper production.
Today, Cerro Verde operates as a large-scale sulphide concentrator complex following a major expansion that more than doubled its throughput capacity from its original processing configuration.
- Historical significance: Pioneer commercial SX/EW facility established 1972
- Processing method: Large-scale sulphide concentrator (primary), SX/EW (legacy oxide treatment)
- Key ownership: Freeport-McMoRan holds the largest equity position
#6 — KGHM Polska Miedz | Poland | 401,100 Tonnes
Operator: KGHM Polska Miedz S.A. (100% state-linked ownership)
KGHM represents one of the most strategically unusual large-scale copper producers among the world's top 10 biggest copper mines. A vertically integrated, state-linked enterprise, it extracts copper from underground operations in the Legnica-Głogów Copper Belt of southwestern Poland — one of the very few significant copper deposits anywhere in continental Europe.
Unlike the porphyry systems that dominate South American and Asian production, Poland's copper is hosted in sediment-hosted stratiform deposits — a fundamentally different geological setting that produces ore with a distinctive multi-metal profile. This is why KGHM simultaneously ranks among the world's largest silver producers, generating significant by-product revenue that meaningfully differentiates its economic profile from pure-play copper peers.
The company's 2026 strategic direction signals an understanding of its core vulnerability: heavy reliance on a single regional ore source. KGHM has publicly indicated its intention to acquire additional mining assets in both Europe and Morocco in order to secure ore supply closer to its Polish smelting infrastructure and reduce logistical exposure.
- Location: Legnica-Głogów Copper Belt, southwestern Poland
- Geology: Sediment-hosted stratiform copper (not porphyry)
- By-product distinction: Major global silver producer
- Strategic direction: Asset acquisition across Europe and North Africa
#5 — Collahuasi | Chile | 404,100 Tonnes
Operator: Glencore, Anglo American, Mitsui (joint venture)
Collahuasi's 206,000-tonne gap between nameplate capacity (approximately 610,000 tonnes) and 2025 actual production (404,100 tonnes) tells a story that is geological, infrastructural, and logistical all at once. The Ujina deposit sits at more than 4,400 metres above sea level in northern Chile's Tarapacá region, creating extraordinary challenges for water sourcing — a resource as critical to copper processing as the ore itself.
In April 2026, contractors completed construction of a dedicated seawater pumping and conveyance infrastructure system, transporting desalinated water from the coastal town of Punta Patache up to the high-altitude mine site as part of a $1 billion infrastructure improvement program. This project addresses what has arguably been the primary operational constraint limiting Collahuasi's ability to close the gap between its design capacity and achieved throughput.
The completion of this water supply system represents a structural step-change in the mine's operational capability. If throughput rates respond as engineering projections suggest, Collahuasi has the potential to meaningfully climb the global production rankings over the next three to five years.
- Altitude: Ujina deposit at 4,400-plus metres above sea level
- Infrastructure milestone: $1 billion seawater conveyance system completed April 2026
- Capacity gap: Approximately 206,000 tonnes of annual upside between current output and nameplate
#4 — Buenavista del Cobre | Mexico | 409,400 Tonnes
Operator: Southern Copper Corporation (Grupo México subsidiary)
Buenavista del Cobre sits in a category almost entirely its own when measured by longevity. Located approximately 35 kilometres south of the US-Mexico border in Sonora state, copper extraction at this site dates continuously to 1899 — placing it among the longest-running large-scale copper operations on Earth. The fact that a mine with operations stretching across more than 120 years still ranks fourth globally by production volume in 2025 is a testament to both the depth of the mineral system and the ongoing capital investment that has modernised its processing infrastructure through successive generations.
Its proximity to the United States border gives Buenavista particular relevance in the context of North American critical mineral supply chain discussions, especially as trade policy debates around mineral sourcing sovereignty have intensified considerably throughout 2025 and into 2026.
- Operating history: Continuous production since 1899
- Location: Sonora, Mexico, approximately 35 km from the US border
- Parent company: Grupo México via Southern Copper Corporation
#3 — Las Bambas | Peru | 411,300 Tonnes
Operator: MMG Limited, CITIC Metal, Pagoda Tree Investment Company (Chinese state-linked consortium)
Las Bambas is among the most geopolitically layered operations in global copper mining. Situated in the remote highlands of Apurímac, southern Peru, the mine has faced sustained community relations challenges that periodically escalated into physical road blockades on key Peruvian transport corridors during 2024. An agreement to lift the blockade was reached in early 2025, with full operational normalisation achieved by April 2025.
Las Bambas is majority-controlled by Chinese state-linked entities, making it a strategically important node in China's approach to securing global copper supply — and a point of considerable sensitivity in broader critical minerals geopolitics between major economies.
The mine's Chinese ownership structure places it at the intersection of two powerful forces shaping 2026 copper markets: tightening global supply and intensifying competition between the United States, Europe, and China for reliable access to copper resources. For commodity analysts tracking geopolitical risk premiums in copper pricing, Las Bambas is a constant reference point.
- Ownership: Chinese state-linked consortium (MMG, CITIC, Pagoda Tree)
- Community risk: Sustained road blockades disrupted 2024 operations
- 2025 recovery: Full operational normalisation from April 2025
#2 — Grasberg | Indonesia | 460,400 Tonnes
Operator: Freeport-McMoRan (operator), PT Indonesia Asahan Aluminium — Inalum (state partner)
Grasberg is one of the most remarkable mineral deposits ever identified anywhere on Earth. A porphyry copper-gold system of extraordinary scale located in the highlands of Central Papua province, it has produced prodigious quantities of both copper and gold across decades of open-pit operations. The ongoing transition from open-pit to underground block cave mining is among the most technically complex operational transformations in the history of the mining industry.
The 2025 year was defined by catastrophe at Grasberg. A landslide released approximately 800,000 tonnes of material, causing fatalities and forcing a significant operational suspension. Recovery efforts are progressing, but Freeport has confirmed that a return to full production capacity is not anticipated until early 2028 — a multi-year timeline that removes meaningful copper supply from global markets precisely when deficits are emerging.
- Geology: World-class porphyry copper-gold system, Central Papua highlands
- Transition: Ongoing shift from open-pit to underground block cave extraction
- 2025 landslide: Approximately 800,000 tonnes of material released; operations significantly disrupted
- Full capacity return: Expected early 2028 at the earliest
- By-product: Among the world's largest single-site gold producers
#1 — Escondida | Chile | 1,347,600 Tonnes
Operator: BHP (majority), Rio Tinto, Mitsubishi Corporation, JX Advanced Metals (joint venture)
No analysis of the world's top 10 biggest copper mines is complete without grappling with the sheer scale of Escondida's dominance. Located in the Atacama Desert of Chile's Antofagasta Region, Escondida produced 1,347,600 tonnes of copper metal in 2025 — nearly three times the output of its nearest competitor and approximately 10% of total global copper mine production from a single operation.
BHP's operational review for the nine months to March 2026 confirmed record material mined and record concentrator throughput at Escondida — a performance milestone that carries particular weight given the mine has been in large-scale production for over three decades. Mature, large-tonnage operations at this scale typically face declining ore grades and rising strip ratios over time, making sustained throughput records genuinely exceptional achievements.
Escondida processes ore through two distinct pathways: a high-capacity flotation concentrator circuit for sulphide ores, and SX/EW leach pads for oxide ore treatment. This dual-processing configuration maximises metal recovery across the full range of ore types encountered across the deposit.
Escondida alone accounts for approximately 10% of world copper mine supply. No other single operation in any major industrial metal market commands a comparable share of global output — a concentration that makes Escondida's operational performance a near-real-time indicator of global copper supply conditions.
- 2025 production: 1,347,600 tonnes — approximately 3x the output of second-ranked Grasberg
- Global market share: Approximately 10% of world copper mine supply from one site
- 2025–2026 status: Record material mined and concentrator throughput confirmed
- Processing: Dual-circuit: flotation concentrator (sulphides) and SX/EW leach pads (oxides)
The next major ASX story will hit our subscribers first
Beyond the Top 10: Operations That Define the Next Tier
Three additional operations produced between 295,000 and 315,000 tonnes in 2025, sitting just outside the top 10 but representing globally significant supply contributors in their own right:
- Morenci (Arizona, USA) — 313,100 tonnes: Freeport-McMoRan's flagship North American operation and one of the largest copper mines in the United States, with particular strategic relevance for domestic US copper supply security
- Quellaveco (Peru) — 309,900 tonnes: Anglo American's flagship copper asset, representing one of the most significant recent additions to Peruvian copper production capacity
- Los Pelambres (Chile) — 295,400 tonnes: Antofagasta Minerals' primary copper operation in the Coquimbo region of Chile, feeding into the company's broader copper-focused portfolio strategy
These three operations collectively produced approximately 918,000 additional tonnes in 2025 — output that would comfortably surpass any single nation's mining production outside the very top tier of copper-producing countries. In addition, understanding the future of copper mining and how these next-tier operations evolve will be critical to assessing whether the industry can close the structural supply deficit now projected across 2026 and beyond.
Disclaimer: This article is intended for informational purposes only and does not constitute financial or investment advice. Production figures, price data, and forward-looking operational guidance referenced herein are sourced from operator disclosures and industry reporting as of May 2026. Commodity prices, production trajectories, and operational timelines are subject to change. Readers should conduct their own due diligence before making any investment decisions.
Want to Know Which ASX Stocks Could Benefit From the Copper Supply Crunch?
Discovery Alert's proprietary Discovery IQ model delivers real-time alerts the moment significant mineral discoveries — including copper — are announced on the ASX, turning complex geological data into clear, actionable investment opportunities for both short-term traders and long-term investors. Explore why historic mineral discoveries have generated extraordinary returns and begin your 14-day free trial today to position yourself ahead of the broader market.