May 20, 2026
When the Safety Net Becomes the Risk: Understanding the New Monetary Regime
For most of modern financial history, sovereign bonds were the bedrock of institutional portfolios. They paid a reliable yield, moved inversely to equities during stress, and anchored the "risk-free" rate that priced every other asset on the planet. That architecture is now cracking. Understanding why it is cracking, and what it means for the bond bear market and gold and silver, is arguably the most important macroeconomic question facing investors today.
The bond bear market is not simply a period of rising yields. It represents a fundamental regime shift in how markets price sovereign credit risk, monetary credibility, and the long-term trajectory of purchasing power. When that shift is underway, the traditional rules for valuing gold and silver stop working. Consequently, investors who cling to outdated frameworks risk making systematically wrong decisions at precisely the wrong time.
When big ASX news breaks, our subscribers know first
The Relationship Between Bond Yields and Gold Has Fundamentally Changed
Why the Old Model Made Sense
The conventional logic connecting bond yields and gold was never arbitrary. A rising yield on a 10-year Treasury note increases the relative attractiveness of holding sovereign debt versus a non-yielding asset like gold. In a world where government bonds were genuinely "risk-free," higher yields created a real opportunity cost for gold ownership, and capital would naturally migrate toward the higher-yielding, capital-preserving alternative.
This framework operated reasonably well across several decades, particularly in the low-debt, stable-monetary environments that characterised much of the post-war period through to the late 2010s. Most investment models were calibrated against this relationship, and for a long time, the data broadly supported it.
Why That Framework Has Now Inverted
The critical variable that has changed is not the level of yields. It is the credibility of the assets generating those yields. When sovereign bonds lose their status as genuinely risk-free instruments, the inverse relationship between yields and gold breaks down entirely, because both assets are then responding to the same underlying signal: eroding confidence in the sustainability of government finances. Understanding gold and bond dynamics has therefore become essential for investors navigating this shift.
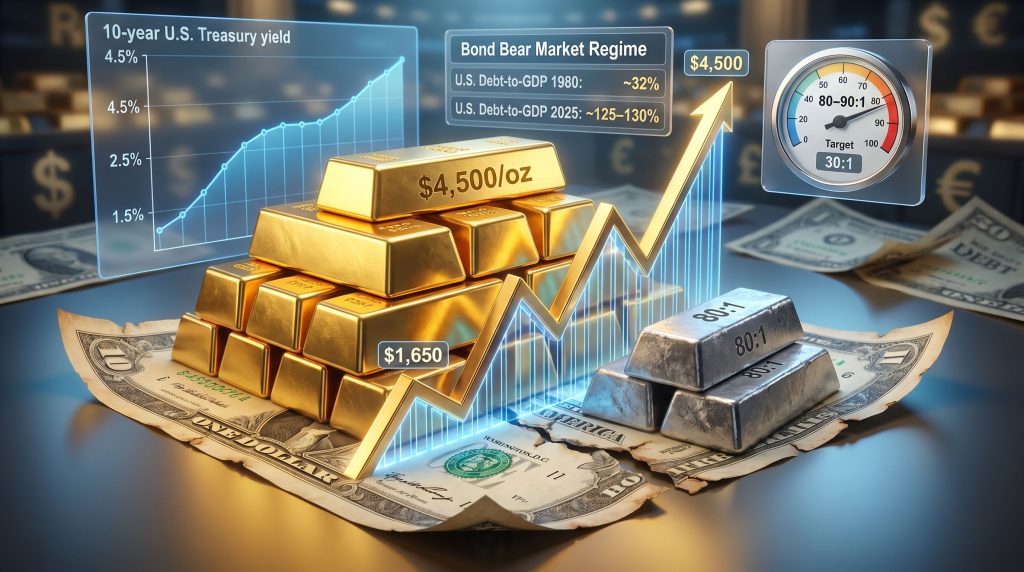
The empirical evidence for this breakdown is striking. Gold bottomed at approximately $1,650 per ounce in 2022, at which point the 10-year U.S. Treasury yield was rising through the 1.5% level. By mid-2025, the same 10-year yield had climbed to approximately 4.5%, while gold had surged to above $4,500 per ounce. These two variables moved in the same direction simultaneously, over a three-year period, across multiple market cycles.
This co-movement of rising yields and rising gold is the defining fingerprint of a bond bear market regime. It is not noise. It is the market communicating that the traditional anchor of portfolio construction is no longer performing its assigned role.
What Defines a Structural Bond Bear Market
Cyclical Correction vs. Structural Shift
Not every period of rising bond yields qualifies as a structural bear market. A cyclical correction in bonds can occur when economic growth is strong, when central banks are credibly tightening policy to contain inflation, or when a temporary supply imbalance pushes yields higher. In each of these scenarios, the yield rise is self-correcting: growth slows, policy normalises, and bonds recover.
A structural bond bear market is categorically different. It is characterised by:
- Persistent fiscal deficits that require ever-increasing sovereign debt issuance regardless of the economic cycle
- Central bank credibility erosion, where the market no longer fully trusts that inflation will be returned to target
- Inflation that is structurally embedded rather than transitory, driven by monetary expansion rather than supply disruptions
- Declining foreign appetite for government securities, including active selling of existing holdings by major sovereign creditors
The Technical Signal Visible Across Major Markets
Bond yield charts across the United States, Japan, Germany, and the United Kingdom share a common technical feature: yields have broken decisively upward from the long-term downtrend that began in the early 1980s. This multi-decade trendline, which represented the longest bond bull market in modern history, appears to have been definitively broken. Furthermore, analysts tracking this development describe it not as a temporary anomaly but as confirmation of a regime change in the direction of sovereign borrowing costs.
The 1970s as the Relevant Historical Template
The closest historical parallel for the current environment is the bond bear market of the 1970s and early 1980s. During that period, gold sustained a multi-year bull market through a rising interest rate environment, reaching approximately $850 per ounce by 1980 even as the 10-year Treasury yield climbed toward 15-16% by 1981.
| Period | 10-Year U.S. Treasury Yield | Gold Price |
|---|---|---|
| Early 1970s | ~4-5% | Beginning of major bull run |
| 1981 (yield peak) | ~15-16% | Gold peaked near $850/oz |
| 2022 (recent low) | ~1.5% | Gold near $1,650/oz |
| Mid-2025 | ~4.5% | Gold above $4,500/oz |
The structural similarities between the 1970s and today are significant: elevated and growing debt loads, persistent inflation running above stated policy targets, and central banks that are operationally constrained in their ability to raise rates to genuinely inflation-suppressing levels.
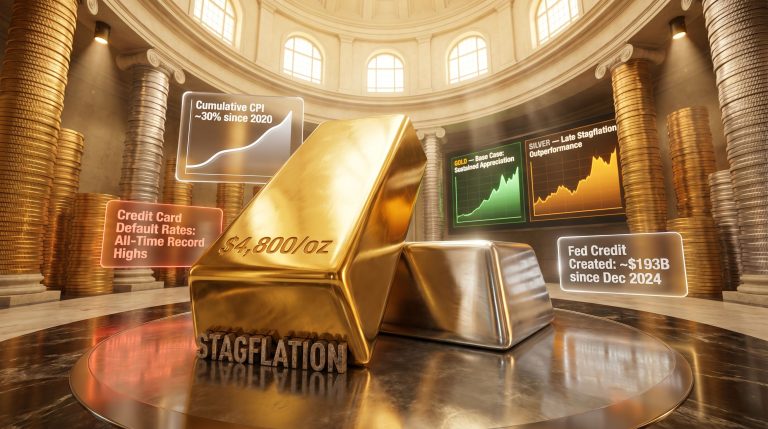
Why Inflation Is Not Going Away: The Monetary Supply Argument
CPI Is a Rearview Mirror
Consumer price index data and producer price index readings are backward-looking indicators. They measure what has already happened in the monetary system, typically with a lag of several months to over a year. Relying exclusively on CPI to assess inflationary pressure is analogous to navigating a vehicle by looking exclusively through the rear window.
The more forward-looking signal is M2 money supply growth. Following the extraordinary monetary expansion of 2020–2021, M2 contracted modestly as quantitative tightening took effect in 2022. However, M2 has since resumed an upward trajectory, suggesting that the inflationary impulse embedded in the monetary system has not been fully resolved. The observation that core CPI continues to surprise to the upside reinforces the view that inflation in the current cycle is demand-side and monetary in origin.
The Structural Rate Ceiling: Why Central Banks Cannot Fight Back Effectively
Perhaps the most consequential difference between the current environment and previous inflation-fighting episodes is the level of sovereign indebtedness. When Paul Volcker raised the Federal funds rate above 20% in the early 1980s to break the inflationary cycle, U.S. debt-to-GDP stood at approximately 32%. The government's balance sheet could absorb dramatically higher borrowing costs without threatening fiscal sustainability.
The same policy today would be existentially damaging. With U.S. debt-to-GDP at approximately 125–130%, an interest rate of 7% on the Federal funds rate would generate debt servicing costs that would rapidly become unsustainable. The mathematics of compound interest on a $35+ trillion debt load at that rate create a fiscal spiral that would almost certainly require monetisation, triggering precisely the inflationary outcome the rate rise was intended to prevent.
The higher the debt load, the lower the effective ceiling for real interest rates. This is not a political observation. It is an arithmetic constraint. And it is the core structural reason why persistent inflation, rather than price stability, is the probable base case for the medium term.
The Wealth Effect Feedback Loop
An additional dynamic reinforcing loose monetary conditions is the outsized role of financial asset prices in driving consumer spending. The wealthiest 10% of U.S. households account for a disproportionately large share of total consumer expenditure. Equity market performance transmits directly to this cohort through the wealth effect.
Central banks are therefore in an invidious position: tighten aggressively enough to genuinely suppress inflation, and risk triggering an equity market correction that rapidly feeds through to reduced consumer spending and GDP contraction. This incentive structure strongly favours maintaining accommodative financial conditions, which in turn sustains the inflationary pressure that makes gold and silver attractive. The gold and bond volatility generated by this environment reinforces the case for holding hard assets.
New Fed Leadership and What It Actually Changes
The Structural Trap Facing Any Fed Chair
The appointment of new Federal Reserve leadership in 2025 generated significant market commentary about potential policy pivots. However, the structural constraints facing any Fed chair at current debt levels are essentially immovable regardless of stated intentions or ideological disposition.
Rhetoric about balance sheet reduction and restraint on quantitative easing must be evaluated against a simple reality: at a debt-to-GDP ratio approaching 130%, the government's ability to absorb sustained high borrowing costs is severely limited. The practical analogy is instructive: a policymaker who speaks loudly about tightening while the underlying fiscal arithmetic makes genuine tightening impossible is not meaningfully different from their predecessors.
Why QE Restarts May No Longer Work as Intended
In previous quantitative easing cycles, particularly post-2008 and post-2020, central bank asset purchases reliably drove bond yields lower and prices higher. Investors treated QE announcements as buying signals for fixed income.
However, the structural shift underway suggests a fundamentally different market response is likely if QE is restarted in the current environment. Investors who have already reconsidered bonds as a safe asset class may use QE announcements as selling opportunities rather than buying signals, essentially accelerating the bond bear market. This represents a complete breakdown of the traditional QE transmission mechanism, and has significant implications for gold and silver: each new round of monetary expansion could function as a bullish catalyst for precious metals.
Gold's Price Behaviour in a Structural Bear Market for Bonds
Short-Term Volatility Is the Toll, Not the Destination
Day-to-day and week-to-week gold price movements in the current environment are increasingly driven by geopolitical headlines, policy announcements, and sentiment shifts rather than changes in underlying fundamental valuation. This creates the appearance of instability that deters participation, particularly among investors without a clearly articulated long-term thesis.
Recent drivers of short-term volatility have included:
- U.S.-China diplomatic meetings and progress or regression in tariff negotiations
- Federal Reserve leadership transitions and associated policy signals
- Shifts in inflation data expectations relative to consensus forecasts
- Geopolitical flashpoints including Taiwan-related commentary
None of these represent structural changes to the bond bear market framework that underpins the multi-year bull case for gold. A correction from $4,600 to $4,500 in a single session is within the normal range of volatility for any secular bull market. In addition, the equivalent event occurred in late 2024, when gold corrected from approximately $2,700 to $2,500 per ounce, a move that was subsequently fully reversed and exceeded within months.
Why Volatility Structurally Limits Participation
One of the more counterintuitive features of precious metals bull markets is that the same volatility that creates buying opportunities simultaneously drives retail investors out of the market. Large intraday price swings generate fear responses that prompt selling at precisely the wrong time.
Investors with a clear understanding of why the bond bear market and gold and silver are structurally linked are significantly better positioned to hold through volatility without panic selling. The framework itself is the tool that makes patience possible.
The next major ASX story will hit our subscribers first
Silver's Distinct Dynamics Within the Same Macro Environment
Different Profile, Same Fundamental Driver
Silver shares gold's monetary characteristics but adds an industrial demand dimension that creates a meaningfully different return profile. In the early stages of precious metals bull markets, gold typically leads. Silver tends to lag initially but then accelerates and historically outperforms significantly in later phases.
The combination of monetary demand and growing industrial applications in solar energy, electric vehicles, and advanced electronics means silver can respond to both the monetary stress driving gold higher and the industrial expansion running parallel to it. For instance, when both demand streams are simultaneously strong, silver's percentage gains can substantially exceed gold's.
The Gold-Silver Ratio as a Forward Indicator
The gold-silver ratio analysis currently points to an elevated reading by long-run historical standards, making it a significant relative value signal for investors.
| Historical Period | Gold-Silver Ratio | Context |
|---|---|---|
| Ancient Rome | ~12:1 | Historical monetary baseline |
| 1980 (precious metals peak) | ~15-16:1 | Silver dramatically outperformed gold |
| Recent period | ~80-90:1 | Silver historically cheap relative to gold |
| Technical analyst target | ~30:1 or lower | Implies substantial silver outperformance |
A compression of the ratio from current elevated levels toward the historical range of 30:1, 15:1, or lower would imply substantial silver outperformance relative to gold on a percentage basis. The technical setup of the ratio is being interpreted by a number of market practitioners as pointing toward continued silver strength once near-term corrections resolve.
For investors considering how to allocate within precious metals, the current gold-silver ratio represents an historically significant relative value signal. It does not guarantee timing, but it does quantify the structural asymmetry that exists between the two metals at present levels.
Geopolitics, De-Dollarisation, and the Structural Demand Floor
The Power Transition Framework and Its Market Consequences
The concept of an established global power and a rising challenger navigating a period of contested supremacy has documented historical precedents. When major economies reduce their holdings of each other's sovereign debt, the consequences are not abstract: direct selling pressure on bond markets intensifies, and the structural bear market in bonds deepens.
China's active reduction of U.S. Treasury positions represents exactly this dynamic in practice. The logic is straightforward: nations facing sanctions or trade restrictions have reduced rational motivation to hold the sanctioning nation's sovereign debt as a reserve asset. Each escalation in trade or technology restrictions correspondingly reduces the incentive to support U.S. bond markets. The broader global monetary shift underway is accelerating these structural reallocations across sovereign balance sheets.
Central Bank Gold Accumulation as a Multi-Year Signal
The trend of central bank gold demand from emerging market economies represents a multi-year structural reallocation driven by de-dollarisation dynamics, sanctions risk, and a deliberate diversification away from concentrated exposure to any single sovereign's debt.
This demand provides a persistent and largely price-insensitive floor for gold that operates entirely independently of retail investor sentiment. Even during periods of significant retail selling pressure, institutional and sovereign demand has repeatedly absorbed supply and supported prices.
Geopolitical Uncertainty Premium
Unresolved flashpoints, including the Taiwan question, ongoing tariff disputes, and technology sector decoupling, maintain an elevated uncertainty premium in markets that is structurally supportive of hard assets. The geopolitical environment is not a short-term catalyst for gold; it is a medium-to-long-term source of demand that reinforces the monetary and fiscal drivers already in play.
A Framework for Positioning in a Bond Bear Market Environment
Four-Step Decision Process for Precious Metals Investors
-
Identify the yield driver. Rising yields driven by strong growth and controlled inflation suggest a standard tightening cycle where gold faces headwinds. Rising yields driven by fiscal stress, debt monetisation risk, or loss of confidence indicate a bond bear market regime where gold and silver are likely beneficiaries.
-
Assess central bank credibility and operational constraints. Are rate hikes credible and sustainable at current debt-to-GDP levels? If not, the inflation fight is likely structurally incomplete. Is QE restart being discussed? In a bond bear market, this is a gold-bullish signal rather than a bond-stabilising one.
-
Monitor the gold-silver ratio. A ratio above 80 indicates silver is historically cheap relative to gold and has potential for meaningful outperformance. A ratio compressing toward 30–40 signals a silver bull market in progress.
-
Separate short-term noise from structural trend. Single-session or single-week corrections in precious metals are not trend signals. Year-over-year performance relative to sovereign bond total returns is the more meaningful metric.
Asset Class Comparison in a Bond Bear Market
| Asset Class | Bond Bear Market Risk | Inflation Hedge Quality | Liquidity | Volatility |
|---|---|---|---|---|
| Long-duration government bonds | High | Poor | High | Moderate |
| Gold | Low | Strong | High | Moderate |
| Silver | Low | Strong | Moderate | High |
| Cash / short-duration bonds | Low-moderate | Poor | Very High | Low |
| Broad equities | Moderate | Partial | High | High |
Frequently Asked Questions
Does a rising 10-year Treasury yield always push gold prices lower?
No. The yield-gold relationship is not fixed and depends entirely on what is driving the yield movement. In a standard tightening cycle driven by economic growth, rising yields increase the opportunity cost of holding gold and can suppress prices. However, in a structural bond bear market and gold and silver environment driven by fiscal stress, gold and yields can rise simultaneously. The 2022–2025 period provides clear evidence: gold climbed from approximately $1,650 to above $4,500 while the 10-year yield rose from below 1.5% to approximately 4.5%.
What is the gold-silver ratio and why does it matter for investment positioning?
The gold-silver ratio expresses how many ounces of silver are equivalent in value to one ounce of gold. Historically, this ratio has ranged from 12:1 in ancient monetary systems to 15–16:1 at the 1980 precious metals peak. At current elevated levels around 80–90:1, silver is historically cheap relative to gold. A compression of this ratio toward historical norms implies substantial silver outperformance on a percentage basis, making it a useful relative value indicator for investors deciding how to allocate within precious metals.
Why can the Federal Reserve not simply raise rates aggressively to control inflation?
The fundamental constraint is the current level of U.S. sovereign debt. With debt-to-GDP at approximately 125–130%, an interest rate sufficient to genuinely suppress inflation would generate unsustainable government interest expense. This is structurally different from the early 1980s, when debt-to-GDP was approximately 32% and the government's balance sheet could absorb rates above 20%. Today's debt load creates an effective ceiling on real interest rates that makes a Volcker-style response arithmetically impossible without triggering a sovereign debt crisis.
How does de-dollarisation affect gold and silver prices?
De-dollarisation accelerates demand for gold in several ways: central banks diversifying away from concentrated dollar-denominated reserve holdings increase gold purchases; nations facing sanctions reduce their motivation to hold the sanctioning country's debt, creating Treasury selling pressure that deepens the bond bear market; and geopolitical uncertainty raises the demand for hard assets as portfolio insurance. This dynamic provides structural demand support for gold that operates independently of short-term investor sentiment.
Key Takeaways for the Bond Bear Market Investment Thesis
- The traditional inverse relationship between bond yields and gold no longer reliably holds when the yield rise is driven by fiscal stress rather than healthy economic growth
- The 2022–2025 period, during which gold climbed from ~$1,650 to above $4,500 while the 10-year yield rose from ~1.5% to ~4.5%, is the clearest empirical evidence of this regime change
- U.S. debt-to-GDP at approximately 125–130% creates a structural ceiling on real interest rates and makes persistent inflation the base case for the medium term
- Short-term gold and silver price corrections are a normal feature of secular bull markets and do not invalidate the long-term structural thesis
- The current gold-silver ratio of approximately 80–90:1 represents a historically significant relative value signal pointing toward potential silver outperformance in later bull market phases
- Geopolitical dynamics including de-dollarisation, active central bank gold accumulation, and sovereign debt market stress provide structural demand support for precious metals that is independent of short-term sentiment shifts
- If QE is restarted in the current environment, the market response may be fundamentally different from previous cycles, with bond selling rather than buying, further reinforcing the gold bull case
Disclaimer: This article is intended for informational and educational purposes only and does not constitute financial advice. All references to price forecasts, ratio targets, and interest rate projections involve inherent uncertainty. Past performance of any asset class is not indicative of future results. Investors should conduct their own research and consult a qualified financial adviser before making investment decisions.
Want To Identify The Next Major Mineral Discovery Before The Market Does?
While the bond bear market reshapes traditional portfolio frameworks and drives investors toward hard assets like gold and silver, Discovery Alert's proprietary Discovery IQ model scans ASX announcements in real time, instantly identifying significant mineral discoveries and delivering actionable alerts directly to subscribers. Explore how historic mineral discoveries have generated extraordinary returns on Discovery Alert's dedicated discoveries page, and begin your 14-day free trial today to position yourself ahead of the broader market.