May 20, 2026
The Macro Regime That Changes Everything for Precious Metal Investors
Most investment cycles end with a single, identifiable shock. A rate hike cycle goes too far. A credit bubble bursts. A currency collapses. But stagflation is different. It does not arrive as a single event. It accumulates through a series of structural contradictions that compound quietly until they become impossible to ignore. The Michael Pento stagflation and gold silver outlook helps frame how that process unfolds and where it currently stands, making it arguably the most important analytical task for any investor navigating 2025 and 2026.
The macro thesis building around stagflation is not simply a recycled version of the 1970s narrative. The underlying mechanics share similarities, but the current cycle has its own structural architecture, shaped by post-pandemic monetary excess, geopolitical fragmentation, and a consumer base that has been quietly hollowed out while headline GDP figures maintained a surface appearance of health.
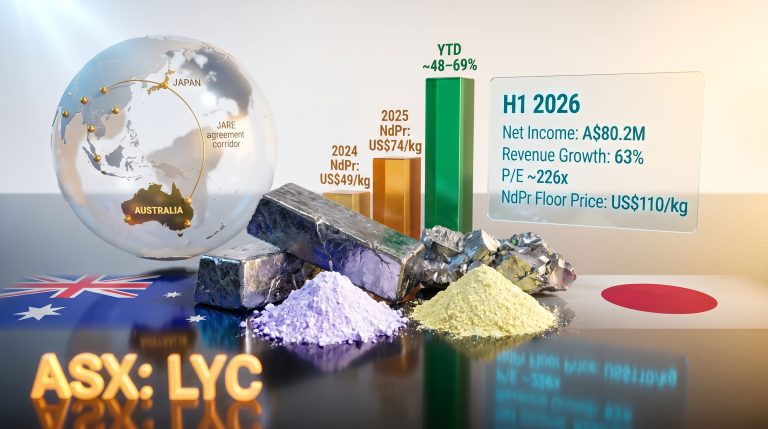
When big ASX news breaks, our subscribers know first
The Stagflation Thesis: Understanding the Macro Framework Driving Precious Metals
What Is Stagflation and Why Is It Relevant Again in 2025?
Stagflation describes an economic environment in which inflation remains elevated while economic growth stagnates or contracts simultaneously. This combination is particularly destructive because the conventional policy tools available to central banks are rendered ineffective. Raising interest rates to suppress inflation risks accelerating the economic slowdown, while cutting rates to stimulate growth risks reigniting inflationary pressures further.
For precious metal investors, stagflation represents one of the most structurally supportive macro regimes for hard asset ownership. However, understanding which phase of the stagflationary cycle is in play determines whether gold and silver are accelerating or consolidating. Furthermore, the gold safe-haven appeal becomes increasingly relevant as these structural pressures intensify.
How the Current Economic Cycle Differs From the 1970s Stagflationary Period
The 1970s stagflationary episode was primarily driven by external oil supply shocks combined with wage-price spiral dynamics and fiscal excess following the breakdown of Bretton Woods. Today's environment has important differences. The inflation component has been driven substantially by an unprecedented monetary expansion during and after the COVID-19 pandemic, compounded by supply chain disruption and geopolitical energy disruption.
The stagnation component is emerging more gradually, partially masked by concentrated spending among high-income households and AI-driven capital expenditure that is increasingly funded through debt rather than organic cash flow.
The Three Structural Forces Converging to Create a Stagflationary Regime
Three distinct forces are converging to create the conditions for a sustained stagflationary regime:
- Persistent monetary base expansion continuing even as consumer price inflation remains elevated above target levels
- Consumer financial deterioration concentrated in the lower income quintiles, where default rates on credit cards and auto loans have reached all-time highs, signalling demand destruction across a broad segment of the economy
- Debt-funded speculative investment in AI infrastructure, which has become increasingly sensitive to rising interest rates and dependent on revenue forecasts that have not yet been validated
Stagflation is not a single event. It is a regime transition. The critical distinction for investors is identifying when the economic stagnation component catches up to already-entrenched inflation. Portfolio positioning must anticipate this shift well before it becomes statistically undeniable.
Is the U.S. Economy Already in a Stagflationary Transition?
Reading the Consumer Stress Signals: Auto Loans, Credit Cards, and Default Rates at Record Highs
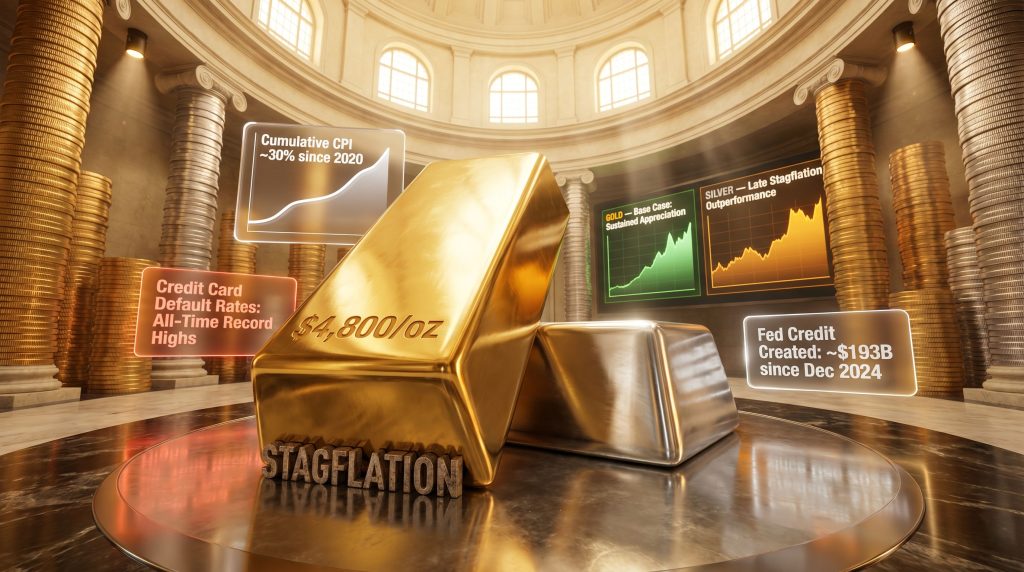
One of the clearest leading indicators of genuine economic deterioration is the condition of consumer credit. Auto loan delinquencies and credit card default rates have reached all-time record highs in the current cycle. This is not a signal of minor stress. It reflects a consumer base, particularly in the bottom 40% of earners, that has been systematically eroded by cumulative inflation running approximately 30% since 2020.
The implication is stark: the average American household is not experiencing economic prosperity. They are managing a sustained reduction in real purchasing power while servicing debt obligations at elevated interest rates. This is the foundation of the "stag" component in the stagflation equation.
The Wealth Divide Hiding Inside GDP: Why Top-Quintile Spending Is Masking Broad Economic Deterioration
GDP data presents an aggregate picture that can be deeply misleading in a highly stratified economy. Much of the spending activity sustaining positive headline GDP growth in the United States is concentrated in the top income quintile. This cohort has benefited from elevated asset prices, stable home valuations, and income that has broadly kept pace with or exceeded inflation.
For the remaining four quintiles, and particularly the bottom two, the picture is materially different. These households face deteriorating real wages, rising debt service costs, and an inability to access housing at current prices. As one active money manager described it publicly, the economy is being held together by top-quintile consumption and AI-driven earnings narratives, with significant structural rot underneath.
| Economic Indicator | Current Signal | Stagflationary Implication |
|---|---|---|
| Consumer credit card default rates | All-time record highs | Demand destruction in bottom 60% of earners |
| Auto loan delinquencies | All-time record highs | Household balance sheet stress accelerating |
| AI infrastructure capex funding | Increasingly debt-financed | Rate-sensitive bubble risk emerging |
| Cumulative CPI since 2020 | ~30% aggregate inflation | Real income erosion across lower quintiles |
| Federal Reserve balance sheet (since Dec 2024) | ~$193B in new credit created | Effective QE of ~$40B/month continuing |
The AI Investment Bubble: Debt-Funded Capital Expenditure and the Interest Rate Vulnerability
The AI sector has become the single most important driver of earnings growth narratives sustaining equity market valuations. However, the funding model underpinning AI infrastructure buildout has shifted from cash flow-backed investment toward debt-financed capital expenditure. This creates a direct sensitivity to rising interest rates that was not present in the earlier phases of the AI boom.
Historical parallels are instructive here. The electrical appliance sector in 1929 and internet infrastructure in 2000 both represented genuinely transformative technologies. In both cases, however, the pace of capital deployment dramatically outpaced monetisation timelines, and the leverage used to fund that deployment created catastrophic downside when rate conditions changed or revenue projections failed to materialise.
What Does the Federal Reserve's Hidden QE Programme Mean for Inflation?
The $193 Billion the Fed Quietly Created Since December 2024
One of the least widely discussed monetary policy developments of the current cycle is the scale of Federal Reserve credit creation since December 2024. Approximately $193 billion in high-powered base money has been added to the system, representing an effective quantitative easing programme running at approximately $40 billion per month. This has taken place while the consumer price index remains elevated and household purchasing power continues to erode.
The cessation of the formal quantitative tightening programme in December 2024, combined with this ongoing credit expansion, represents a fundamental contradiction in monetary policy. Tightening was abandoned before inflation had returned to target, and base money expansion has continued in an environment where lower-income households are already experiencing record default rates.
The Implications of Continued Base Money Expansion in an Inflationary Environment
The simultaneous presence of record consumer default rates and ongoing monetary base expansion is a textbook stagflationary signal. When central bank stimulus continues despite persistent inflation, the purchasing power of ordinary households erodes at an accelerating rate, not a decelerating one.
The monetary policy dilemma facing the Federal Reserve is significant. Cutting rates aggressively to relieve consumer financial stress risks reigniting inflationary pressures that remain above target. Maintaining or raising rates to suppress inflation risks accelerating economic deterioration for the bottom quintiles that are already at breaking point. Consequently, understanding gold and bond dynamics becomes essential for investors seeking to navigate these constraints effectively.
What a New Fed Chair Could and Could Not Realistically Change
Market speculation around potential Federal Reserve leadership changes has introduced an additional variable into the policy outlook. A more hawkish incoming chair might credibly commit to halting ongoing credit expansion and pursuing a mild tightening posture, potentially stabilising the inflation trajectory.
However, any realistic analysis acknowledges that even a materially different policy stance cannot quickly reverse the structural damage already accumulated in household balance sheets, nor can it easily deflate an AI-driven equity bubble without triggering broader market dislocation.
Gold Price Outlook 2025 to 2026: What Drives the Next Major Move?
The Real Interest Rate Mechanism: Why Gold Responds to Rates Differently Than Most Assets
Gold's relationship with interest rates is frequently misunderstood, even by experienced investors. The relevant variable is not the nominal interest rate or the inflation rate in isolation. It is the real interest rate, which is the nominal rate adjusted for inflation. Gold tends to appreciate when real rates are falling, and to face headwinds when real rates are rising.
The current environment involves rising nominal rates, which creates a headwind for gold unless inflation accelerates faster than those yields rise. This is the nuanced phase the market is currently navigating. The setup is not yet at maximum potency for gold appreciation, but the structural forces building beneath the surface are historically consistent with a major upside move when conditions fully align.
The Geopolitical Wildcard: How Energy Price Shocks Feed Back Into Precious Metals
Geopolitical developments in the Middle East, particularly as they relate to energy supply disruption, introduce a short-term negative feedback loop for precious metals. Oil price spikes driven by conflict escalation increase input costs across the economy, which temporarily suppresses mining sector margins and puts nominal rate pressure upward, creating a difficult short-term environment for both gold and silver.
However, any genuine resolution of Middle East tensions resulting in a sustainable reduction in energy prices could paradoxically be extremely bullish for precious metals. A peace resolution scenario would likely require an unprecedented monetary policy response, potentially triggering the kind of base money expansion that drives the most powerful gold bull markets. In addition, the broader interplay of gold, bonds and volatility in such a scenario warrants careful attention from portfolio managers.
Gold Price Scenarios: From Base Case to Upside Breakout
| Scenario | Key Conditions | Gold Price Range (Outlook) |
|---|---|---|
| Base Case | Stagflation deepens, real rates stay negative | Sustained appreciation, outpacing CPI |
| Upside Case | Geopolitical resolution plus massive monetary response | Aggressive breakout, targets near $4,800/oz cited by analysts |
| Downside Risk | Energy spike suppresses miners, nominal rates rise faster than inflation | Consolidation and short-term pressure |
| Tail Risk | Credit crisis triggers deflationary shock first | Short-term pullback before policy-driven surge |
Silver Outlook 2025 to 2026: Higher Beta, Higher Risk, Higher Reward?
How Silver Behaves Differently From Gold in a Stagflationary Cycle
Silver shares gold's monetary characteristics but carries significant industrial demand exposure that creates a different performance profile across different phases of the economic cycle. In the early stages of stagflation, when the inflationary component dominates and economic activity has not yet visibly contracted, silver can lag gold due to concerns about industrial demand softening.
In the later, more acute phases when monetary policy responses accelerate, silver's higher beta nature historically produces outperformance relative to gold. Furthermore, gold-silver ratio analysis provides a valuable tool for timing shifts between the two metals as the stagflationary cycle matures.
Platinum vs. Silver: Which Precious Metal Offers Better Risk-Adjusted Exposure?
| Attribute | Silver | Platinum |
|---|---|---|
| Volatility | High | Moderate |
| Industrial demand exposure | Significant | Significant |
| Precious metal monetary premium | Yes | Yes |
| Typical portfolio role | Tactical and higher-beta | Defensive and lower-beta |
| Performance in early stagflation | Can lag gold | More stable |
| Performance in late stagflation | Can outperform significantly | Moderate upside |
Silver is best understood as a tactical holding within a broader commodity and precious metals allocation, sized according to risk tolerance and the specific phase of the stagflationary cycle in progress. However, as analysts have noted, silver's stagflation trap presents unique challenges when the Fed remains paralysed and supply conditions tighten simultaneously. An allocation range of 7% to 20% across total precious metals exposure reflects the variability appropriate to differing macro conditions.
The next major ASX story will hit our subscribers first
How Should Investors Position a Portfolio for Stagflation?
Why the Traditional 60/40 Portfolio Is Structurally Dangerous in a Rising-Yield Environment
The 60/40 portfolio model divides capital between equities and fixed income, built on the assumption that bonds provide a counterbalancing hedge when equities sell off. This assumption holds in disinflationary or deflationary environments. It breaks down comprehensively when both asset classes face simultaneous headwinds from rising yields, as demonstrated clearly during 2022, when both bonds and equities declined together for the first time in decades.
A stagflationary environment creates the conditions for a repeat of this dynamic, potentially at greater magnitude. Investors who continue to hold duration-heavy bond portfolios alongside rate-sensitive equities in this environment are carrying compounding structural risk.
What a Stagflation-Oriented Portfolio Actually Looks Like
Core Allocation Themes for a Stagflationary Regime:
- Commodities (broad): Energy including fossil fuels and alternatives, agriculture, and uranium, representing hard assets with intrinsic inflation pass-through characteristics
- Precious metals: Gold and silver as monetary debasement hedges, with a 7% to 20% allocation range depending on macro conditions and the phase of the stagflationary cycle
- Aerospace and defence: Geopolitically resilient sector with revenue streams that remain intact during periods of global instability
- Short-duration fixed income only: Treasury bills preferred, with zero long-duration bond exposure maintained across the portfolio
- Sectors to avoid: Rate-sensitive areas including real estate and consumer discretionary, which face compounding headwinds from both elevated rates and weakening consumer demand
- Tactical short opportunities when stagnation deepens: Interest rate-sensitive sectors only, not commodity, energy, or base metals sectors
Positioning gold as a strategic investment within this framework reflects the broader thesis that the Michael Pento stagflation and gold silver outlook has been articulating for some time. Indeed, gold as a strategic investment has become an increasingly prominent consideration for institutional and retail investors alike.
When to Shift From Bullish to Defensive: The Stagflation Inflection Signal
The critical transition point is when economic stagnation becomes statistically undeniable, not just anecdotally visible. Until a formal credit crisis or confirmed recessionary data emerges, maintaining commodity and energy exposure with no short equity positions is the more disciplined approach. Premature shorting in an inflationary environment carries significant risk of being caught in a melt-up.
Sector precision in any shorting strategy is essential. Broad index bets against a market that still has inflationary momentum are high-risk. Targeted short exposure to the most rate-sensitive economic sectors, where both earnings and asset valuations face simultaneous compression, offers a far more defensible risk-reward profile when the time comes.
The AI Bubble Risk: Could Debt-Funded Technology Investment Be the Catalyst for the Next Downturn?
Historical Parallels: Why Transformative Technology Does Not Prevent Overvaluation
Each major technology bubble in modern financial history has been built around a technology that was, in fact, genuinely transformative. The electrical appliance boom of the late 1920s, the internet infrastructure bubble of the late 1990s, and the automotive expansion of the early twentieth century all represented real and lasting shifts in how economies functioned. None of this prevented catastrophic investment losses when capital deployment outpaced monetisation and leverage became the primary funding mechanism.
History consistently demonstrates that genuinely transformative technologies can still generate catastrophic investment losses when capital deployment outpaces monetisation timelines. The AI cycle shares structural characteristics with prior technology bubbles: debt-funded expansion, speculative valuation multiples, and revenue projections that assume frictionless adoption curves.
The AI cycle's vulnerability is not the technology itself. It is the financial architecture surrounding it. Hundreds of billions of dollars in data centre and AI infrastructure investment is now being funded through debt rather than operating cash flow, at precisely the moment when interest rates are elevated and revenue forecasts remain highly speculative.
Frequently Asked Questions: Stagflation, Gold, and Silver in 2025
What is the difference between inflation and stagflation for gold investors?
Inflation alone does not guarantee gold outperformance. What matters is whether real interest rates are falling. In a standard inflationary environment, central banks raise nominal rates, which can keep real rates positive and create headwinds for gold. Stagflation is different because economic weakness limits the central bank's ability to raise rates aggressively, allowing inflation to erode real rates and create a sustained tailwind for gold.
Does gold always go up during stagflation?
Not uniformly throughout every phase. Short-term pressures from rising nominal rates or energy price spikes can temporarily suppress gold. The strongest performance typically occurs when the stagflationary dynamic is fully established and monetary policy responses accelerate. Patience and phase-awareness are critical.
Is silver a better investment than gold in a stagflationary environment?
Silver offers higher potential returns in the most acute phase of a stagflationary cycle, but it also carries higher volatility and greater sensitivity to industrial demand conditions. For most investors, gold provides the more reliable core holding, with silver as a tactical complement sized appropriately to risk tolerance.
What happens to the stock market during stagflation?
Equities face significant headwinds, particularly rate-sensitive sectors. However, commodities, energy, and materials companies can perform well because their revenues benefit from elevated input prices. Broad index exposure becomes increasingly dangerous as the stagflationary cycle matures.
Should I sell my bonds if stagflation is coming?
Long-duration bonds are particularly vulnerable in a stagflationary environment. When both inflation and economic deterioration are present, bond prices fall as yields rise, eliminating the traditional hedging benefit. Transitioning to short-duration instruments such as Treasury bills preserves capital without the duration risk.
What sectors perform best during stagflation?
Energy, agriculture, commodities broadly, precious metals, and aerospace and defence have historically shown resilience or appreciation during stagflationary regimes. These sectors benefit from either the inflationary component directly or from geopolitical spending that persists regardless of economic conditions.
How much of a portfolio should be allocated to precious metals in a stagflationary cycle?
Allocation ranges of 7% to 20% are cited by active managers as appropriate, depending on the phase of the cycle and the degree to which real interest rates are falling. The lower end of that range reflects environments where temporary headwinds, such as elevated nominal rates or energy price spikes, are suppressing near-term performance potential.
Key Takeaways: The Stagflation Playbook for Precious Metal Investors
- Stagflation represents a regime shift, not a temporary economic condition, and portfolio construction must reflect this fundamental distinction
- Gold's primary driver is real interest rates, not nominal rates or inflation in isolation, and this relationship must guide timing decisions
- Silver offers structurally higher upside in the most acute phase of the cycle but requires tactical discipline due to elevated volatility
- The 60/40 portfolio model carries compounding risk when bonds and equities face simultaneous headwinds from rising yields, as 2022 demonstrated
- Consumer financial stress indicators, particularly default rates on auto loans and credit cards at all-time records, are leading signals of economic deterioration
- Approximately $193 billion in Federal Reserve credit creation since December 2024 represents an effective QE programme of around $40 billion per month, continuing in an environment of still-elevated inflation
- The Michael Pento stagflation and gold silver outlook frames commodity-heavy, short-duration portfolios with zero long-bond exposure as the most defensible positioning ahead of a confirmed stagflationary inflection
- Premature shorting of equity markets remains a high-risk strategy while the inflationary component continues to dominate; precision in sector selection is essential when the time to short arrives
This article presents macroeconomic analysis and investment perspectives for informational purposes only. Nothing contained herein constitutes financial advice or a recommendation to buy or sell any security or asset class. All investment decisions should be made in consultation with a qualified financial professional. Forward-looking statements and price targets involve inherent uncertainty and should not be relied upon as predictions of actual market outcomes.
Want to Know Which ASX Discoveries Are Emerging Amid the Stagflation Shift?
Discovery Alert's proprietary Discovery IQ model delivers real-time alerts on significant ASX mineral discoveries, instantly translating complex data into actionable insights for investors seeking hard asset exposure in today's stagflationary environment — explore historic discovery returns to understand the potential at stake, and begin your 14-day free trial at Discovery Alert to position yourself ahead of the market.