July 29, 2026
When Geography Becomes Destiny: How Chokepoint Risk Rewrites Commodity Economics
Every commodity cycle eventually encounters a moment when physical geography asserts itself over financial modelling. The Strait of Hormuz, a narrow waterway barely 33 kilometres wide at its tightest point, has long represented the single most consequential vulnerability in global energy infrastructure. When military activity intensifies around this corridor, the repricing that follows is rarely a simple spike and retreat. It reflects something more durable: the market recognising that the cost of moving hydrocarbons from producer to consumer has structurally changed, at least temporarily, and that this change cascades through every energy-intensive industry downstream.
That downstream consequence lands squarely on the mining sector, where diesel consumption underpins virtually every operational process from ore extraction to processing to site power generation. Understanding how Brent above $87 on Iran-backed forces strikes translates into real cost pressure, and which producers are insulated from it, requires working through several layers of market mechanics that rarely get examined together.
When big ASX news breaks, our subscribers know first
The Mechanics Behind Geopolitical Risk Premiums in Crude Markets
Not every escalation event in the Middle East produces a lasting shift in oil prices. Traders are well practised at distinguishing between headline risk, which spikes futures and fades within sessions, and structural risk, which embeds itself into the forward curve and alters cost calculations for months.
The distinction matters enormously for industrial commodity producers. A transient spike may not even register in quarterly fuel procurement costs if purchasing has already been hedged or if the spike reverses before physical contracts reset. A structural floor, by contrast, flows directly into operating cost guidance, project economics, and capital allocation decisions. Understanding crude oil price trends is therefore essential for any producer navigating these conditions.
Several factors determine which category a given escalation falls into:
- Diplomatic foreclosure: When Tehran formally rejected Oman's proposal for joint maritime governance of the Strait of Hormuz, markets interpreted this not as a negotiating position but as a deliberate signal that normal transit conditions would not return soon. This single development shifted trader probability weightings toward sustained constraint rather than temporary disruption.
- Inventory buffer erosion: The US Strategic Petroleum Reserve held approximately 311.4 million barrels at the time of the most recent escalation, representing a 22.6% year-over-year decline. This reduction limits the emergency release capacity that historically acts as a ceiling on sustained price elevation.
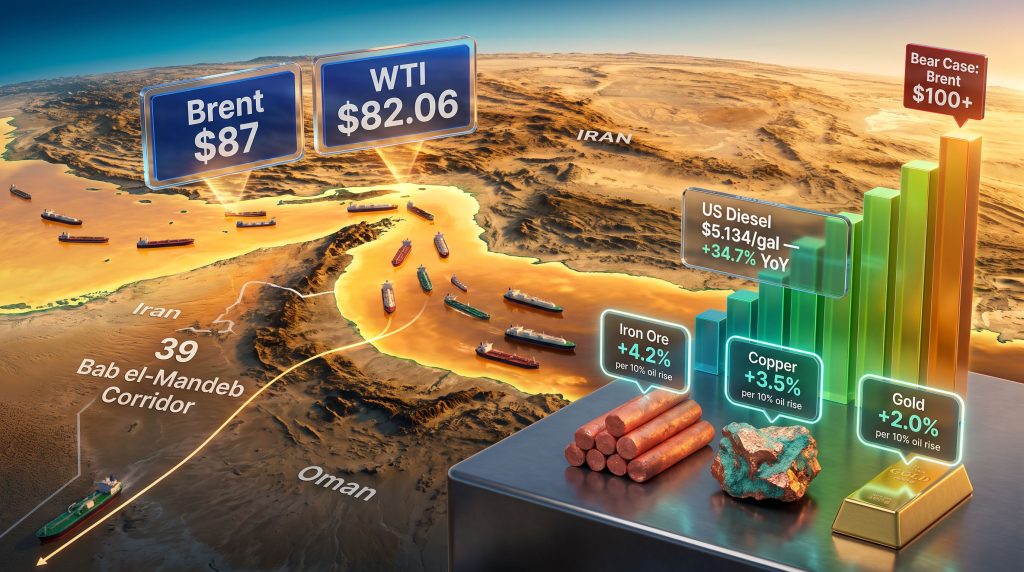
- Physical supply adaptation signals: The rerouting of 39 vessels through the Bab el-Mandeb corridor indicated that supply chains were adapting rather than collapsing, a distinction markets price very differently. Rerouting extends transit times and elevates shipping costs; closure would be categorically more severe.
- Concurrent inventory drawdown: US crude inventories fell by approximately 3.3 million barrels, tightening near-term physical supply independently of geopolitical factors and removing one potential counterweight to price elevation.
When these conditions align simultaneously, the result is not merely a risk premium layered on top of existing prices. It becomes a new reference floor. That is precisely the analytical position DBS Bank articulated, framing an $80 per barrel level as a baseline rather than an upper boundary, with the trading range expected to span $80 to $100 under continued Hormuz constraint.
Brent's 3.6% single-session gain to $87.13, concurrent with WTI rising 3.5% to $82.06, reflected this multi-factor repricing rather than a simple reaction to a news headline.
OPEC+ Supply Architecture and the Fed as Simultaneous Catalysts
Two macro variables were converging at the same moment that geopolitical risk was elevating crude prices, and their interaction is worth examining separately from the Hormuz dynamic.
OPEC market influence was already evident before the escalation, with OPEC+ having committed to a three-month pause on output increases from October. This decision effectively placed a ceiling on additional supply precisely when the market needed buffer capacity most. The combination of a supply ceiling from producers and a disruption threat to existing flows creates an asymmetric setup: upside price pressure faces limited resistance while downside corrections require either a significant diplomatic breakthrough or a decisive demand-side shock.
Simultaneously, the Federal Reserve's rate decision introduced a second macro catalyst. With CME FedWatch assigning a 70% probability to rates holding at 3.5% to 3.75%, the prospect of extended rate stability at elevated levels created a nuanced backdrop for commodity producers. Rate stability at this level is not uniformly bearish or bullish for mining. It tends to produce selectivity, where operational fundamentals and cost structures matter more than sector-wide sentiment.
Rate stability at elevated levels typically compresses the universe of attractive commodity investments to those with genuine cost discipline, while filtering out producers relying on loose monetary conditions to fund marginal operations.
The dollar's behaviour under this rate scenario also feeds back into oil pricing. A stable, relatively strong dollar places modest downward pressure on commodity prices denominated in that currency, partially offsetting geopolitical risk premiums. This creates a complex cross-current that sophisticated commodity investors track closely.
Mining Cost Sensitivity: Why a 10% Oil Move Is Not a 10% Cost Move
One of the most frequently misunderstood aspects of oil price transmission into mining economics is the non-linearity of the relationship. A 10% increase in crude prices does not produce a 10% increase in mining costs. The actual cost impact depends on fuel intensity relative to total operating cost, which varies significantly by commodity, mining method, and geography. Furthermore, the relationship between commodity prices and miners involves several compounding variables that make blanket assumptions unreliable.
BMO Capital Markets, drawing on Wood Mackenzie data, produced estimates that illustrate this asymmetry clearly:
| Commodity | Cost Increase per 10% Oil Rise | Fuel Intensity Classification | Geographic Sensitivity |
|---|---|---|---|
| Iron Ore | +4.2% | High | Europe/Asia higher than Africa/Americas |
| Copper | +3.5% | Medium-High | Variable by haulage method |
| Gold | +2.0% | Medium | Lower sensitivity, mixed open-pit/underground |
Iron ore carries the highest exposure for a straightforward operational reason. Open-pit iron ore extraction involves enormous haul-truck fleets moving very large volumes of low-value-per-tonne material. The ratio of fuel cost to revenue per tonne is unfavourable compared to higher-value commodities, meaning diesel price movements have outsized margin impact.
Copper sits in an intermediate position. Haulage requirements are significant, particularly in large open-pit operations like those common in Chile and Peru, but copper's higher commodity value per tonne provides greater capacity to absorb fuel cost increases before cash cost thresholds are breached.
Gold occupies the most protected position, partly because underground mining, which characterises many high-grade gold operations, consumes substantially less diesel than open-pit methods. Ore grades also matter here: a high-grade underground gold mine moving modest tonnages to extract significant value is far less fuel-intensive than a bulk open-pit operation processing hundreds of millions of tonnes annually.
The Geographic Dimension Most Analysts Overlook
Beyond commodity type, geographic positioning creates a second layer of differentiation that receives insufficient analytical attention. Mining operations in Africa and the Americas have demonstrated structurally lower oil-price sensitivity than comparable operations in Europe and Asia. Several factors explain this:
- Local energy infrastructure: Some African and South American jurisdictions allow mining companies to access hydroelectric or other renewable power sources for site electricity, reducing reliance on diesel generation.
- Domestic fuel pricing structures: Certain jurisdictions insulate industrial fuel consumers from full international price pass-through through regulated pricing frameworks, though this varies significantly by country.
- Haulage distance and topography: Geographic factors affecting haul road length and gradient influence total diesel consumption independently of commodity type.
This geographic dimension means that two copper mines with identical ore grades and processing methods can have meaningfully different oil-price sensitivities purely based on location.
US Retail Diesel at $5.134 Per Gallon: The Compounding Pressure
The broader context for mine-site fuel costs extends beyond crude oil spot prices. US retail diesel reached $5.134 per gallon, representing a 34.7% year-over-year increase. This figure matters because it captures not just crude price movement but the full chain of refining margins, distribution costs, and regional supply-demand dynamics that determine what fuel actually costs at a mine gate.
For open-pit operations running fleets of haul trucks, each consuming several hundred litres of diesel per hour, this cost level is not abstract. It flows directly into shift-level operating costs and ultimately into quarterly cash cost reporting. The compounding nature of year-over-year increases means that operations which appeared cost-competitive twelve months ago may now be sitting uncomfortably close to industry cost curve inflection points.
Industry data from Railveyor indicates that evaluation of electrified haulage systems has accelerated among mining companies as a direct response to sustained diesel cost inflation. Consequently, electric mining transport options, including battery-electric haul trucks, trolley-assist systems, and conveyor-based ore transport, represent different points on the technology adoption curve, with each offering different capital cost profiles and suitability for specific mine geometries.
The asymmetry between miners with established forward diesel hedging programmes and those exposed to spot pricing is another underappreciated differentiator. During rapid price escalation events, an unhedged operation can see quarterly fuel costs jump by amounts that materially alter reported margins, while a hedged operation absorbs the same market movement with minimal near-term impact.
Scenario Framework: Three Pathways and Their Mining Sector Implications
Scenario A: Hormuz Remains Constrained Through Q3
Under this pathway, Brent above $87 on Iran-backed forces strikes continues to set the tone, with Brent holding within the $80 to $100 range. Energy-intensive open-pit operations face sustained margin compression, and investor attention migrates from sector-wide commodity price momentum to operational efficiency metrics. Miners with fuel hedges, electrified or alternative haulage, and geographic exposure to lower oil-sensitivity regions outperform. This scenario rewards the patient accumulation of operationally superior producers over headline-driven sector positioning.
Scenario B: Diplomatic Resolution or OPEC+ Output Resumption
WTI retreats toward the low $70s under this pathway, and the fuel cost overhang that has differentiated winners from laggards diminishes. Iron ore producers could recover approximately 4.2% in operating margins, copper producers around 3.5%, and gold producers close to 2.0%. Broad sector re-rating becomes possible as the cost premium embedded in fuel-intensive operations normalises. This scenario benefits laggards most, creating potential mean-reversion opportunities in previously underperforming names.
Scenario C: Full Hormuz Closure or Escalation Beyond Current Parameters
Brent moves above $100 under this pathway. Diesel-dependent operations face severe cost pressure, and capital begins rotating toward producers with low fuel intensity or established alternative energy sources. Supply chain disruptions extend beyond fuel to equipment procurement, reagent supply, and logistics, creating second-order cost impacts that are harder to model and hedge. In addition, miners with the lowest operating cost structures and the highest commodity value per tonne of ore processed become defensive holdings.
The next major ASX story will hit our subscribers first
Key Indicators for the Next Inflection Point
For investors tracking this dynamic in real time, several data releases provide the most actionable forward signal:
- EIA Weekly Petroleum Status Report confirms whether the 3.3 million barrel inventory drawdown represents a trend establishing itself or a single-week anomaly.
- CME FedWatch rate probability shifts indicate changes to the macro backdrop that alter the dollar-oil relationship and commodity demand expectations.
- Strait of Hormuz transit vessel counts provide the most direct quantitative measure of physical supply risk intensity.
- OPEC+ October production decision determines whether the supply ceiling tightens further, holds, or begins to loosen.
- US retail diesel rack pricing offers a lagging but operationally critical indicator for forward mine-site cost forecasting.
Fuel Exposure as the Mining Sector's New Dividing Line
The episode of Brent above $87 on Iran-backed forces strikes is best understood not as an isolated geopolitical event but as a stress test of mining sector cost resilience. The companies that emerge from this period with relatively intact margins will share common characteristics: established fuel hedging programmes, progress toward a broader mine energy transition, geographic exposure to lower oil-sensitivity regions, and sufficient operating margin buffer to absorb cost increases without breaching cash cost thresholds that trigger investor concern.
The companies that struggle will, however, be those whose cost structures were optimised for a pre-escalation energy environment, whose haulage methods are diesel-intensive, and whose geographic positioning offers no structural insulation from international fuel price movements.
Operational efficiency, not commodity price momentum, is the variable that will separate sector leaders from laggards for as long as the Strait of Hormuz remains a contested corridor. That is a more nuanced investment thesis than broad sector exposure, but it is also a more durable one.
Disclaimer: This article contains forward-looking statements, scenario projections, and analyst estimates that involve inherent uncertainty. All financial figures, commodity cost estimates, and price projections are based on publicly available data and analyst commentary at the time of writing and are subject to change. This content is for informational purposes only and does not constitute financial or investment advice. Investors should conduct independent research before making investment decisions.
Want to Identify ASX Mining Companies Best Positioned to Weather Rising Energy Costs?
Discovery Alert's proprietary Discovery IQ model scans ASX announcements in real time, instantly surfacing mineral discoveries with the operational and geographic advantages that matter most when fuel costs are reshaping sector economics — explore historic examples of discovery-driven returns to understand the opportunity, then begin your 14-day free trial at Discovery Alert to gain an immediate edge in identifying the next standout producer.