June 14, 2026
The Strait of Hormuz and the Architecture of a Global Supply Shock
Every major oil price crisis in modern history traces back to one of three causes: a collapse in demand, a coordinated producer cartel decision, or a physical constraint on supply infrastructure. The current situation belongs firmly in the third category, and it is arguably the most structurally dangerous of the three. When demand collapses, producers adjust. When cartels restrict output, negotiations eventually resume. But when the world's most critical maritime chokepoint becomes contested territory, no policy lever, reserve release, or diplomatic communique can fully substitute for the physical reality of constrained flow.
That is precisely the environment in which Brent breaks $111 oil shortages became the defining market narrative of May 2026, a threshold that carries both psychological and mechanical significance for global energy markets. The move did not happen in isolation. It arrived at the intersection of drone strikes on Gulf infrastructure, a stalled diplomatic process between Washington and Tehran, and an inventory drawdown trajectory that the IEA described as producing a 6 million barrel per day supply-demand gap between March and June 2026.
Understanding how these forces converged, and where they lead, requires moving beyond the headlines and into the structural mechanics of how physical oil markets actually break.
When big ASX news breaks, our subscribers know first
Why the Strait of Hormuz Cannot Be Replaced at Scale
The Strait of Hormuz is a navigable channel roughly 33 kilometres wide at its narrowest point, connecting the Persian Gulf to the Gulf of Oman. Its physical dimensions are modest. Its economic footprint is extraordinary. Approximately 20 to 21% of global oil trade transits through this corridor daily, along with significant volumes of liquefied natural gas from Qatar. Furthermore, the disruption to global LNG supply compounds the pressure on energy-importing nations already facing acute crude shortages.
Several alternative export routes exist, but none can absorb the full volume at speed:
- The East-West Pipeline across Saudi Arabia can move roughly 5 million barrels per day to the Red Sea, but it operates near capacity and requires significant coordination to scale
- ADNOC's Habshan-Fujairah pipeline bypasses Hormuz entirely for Abu Dhabi crude, but current capacity covers only a fraction of total UAE export volumes. ADNOC has confirmed plans to double this bypass export capacity by 2027, which is structurally significant but offers no relief for the current crisis
- Overland routes through Turkey and Iraq exist but are constrained by geopolitical complexity and insufficient throughput infrastructure
Historically, prior Hormuz tension events including the tanker wars of the 1980s and the recurring mine-laying incidents of the 2010s produced sharp but short-lived price spikes because physical closure never fully materialised. The current situation is structurally different because the constraint has persisted long enough to translate from futures market risk premium into actual inventory depletion across commercial and strategic stockpiles globally.
How Three Converging Forces Drove Brent to $111
The price breakout did not emerge from a single catalyst. It reflects a layered compression of risk factors, each reinforcing the others.
Layer One: Geopolitical Escalation Through Infrastructure Targeting
The immediate trigger for the latest surge was a drone strike that caused a fire near the perimeter of the UAE's Barakah nuclear power plant, the first operational nuclear facility in the Arab world. UAE authorities confirmed the strike hit an electrical generator outside the inner security perimeter, with no radiation leak or injuries reported. Separately, Saudi Arabia intercepted three drones that entered its airspace from Iraqi territory.
These strikes carry a significance beyond their immediate physical impact. Infrastructure targeting, even when intercepted or contained, signals intent and capability. Markets do not price only current damage; they price the probability distribution of future damage. Consequently, each successful or near-successful attack against Gulf energy infrastructure raises the floor of the geopolitical risk premium embedded in crude prices.
Layer Two: Diplomatic Deadlock and the China Intermediary Problem
President Trump's visit to China generated significant market optimism that President Xi might leverage Beijing's relationship with Tehran to facilitate a Hormuz reopening. That optimism proved unfounded. No Iran breakthrough emerged from the engagement, and Trump subsequently returned to issuing direct warnings to Iran demanding negotiation or facing further consequences.
The structural problem with the U.S.-Iran-China diplomatic triangle is that China's incentives are not aligned with a rapid resolution. Beijing purchases a significant share of Iranian crude at discounted prices, a commercial arrangement that a Hormuz reopening and sanctions normalisation would complicate. These dynamics limit the leverage that Washington can realistically apply through Beijing as an intermediary. In addition, the broader trade war and oil prices relationship has further complicated the diplomatic calculus across all parties.
Layer Three: Physical Market Tightness Beyond Seasonal Norms
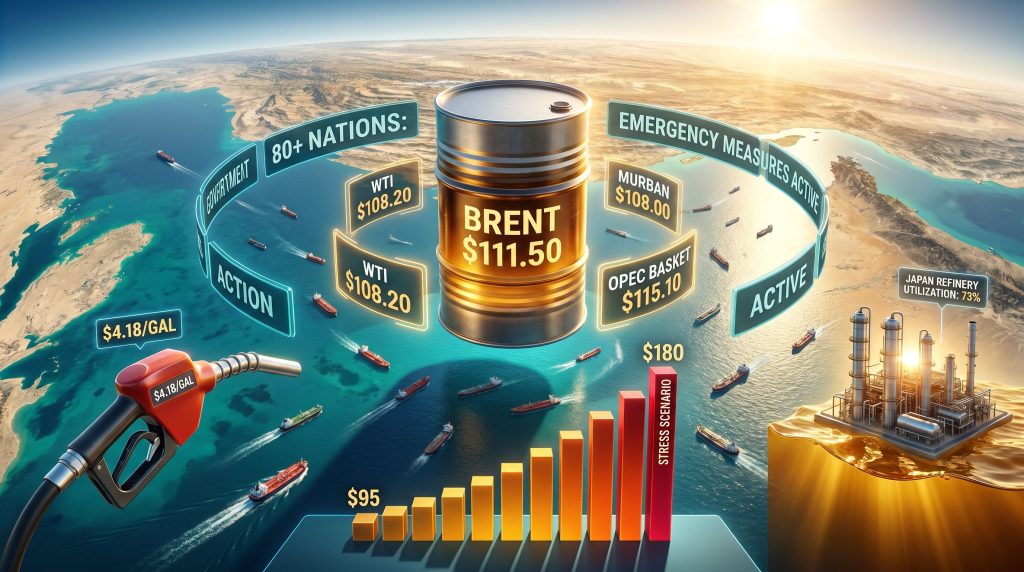
The third pressure layer is the most consequential for sustained price elevation. Global commercial crude inventories have been declining at a pace that market analysts described as unprecedented. Floating storage, a buffer mechanism traders use when onshore capacity is exhausted, was approaching utilisation limits. Approximately 80 nations had activated emergency energy measures by mid-May 2026, a figure that contextualises the scale of the supply constraint beyond financial market dynamics.
Benchmark Price Snapshot at the Breakout Moment
| Benchmark | Price (USD/bbl) | Session Change |
|---|---|---|
| Brent Crude | $111.50 | +2.03% |
| WTI Front-Month | $108.20 | +2.59% |
| Murban Crude | $108.00 | +3.15% |
| OPEC Basket | $115.10 | +6.90% |
| WTI Midland | $106.50 | +3.39% |
Source: Live market data compiled from global benchmark trackers, May 2026
The 6 Million Barrel Per Day Deficit: What That Number Actually Means
The IEA's May 2026 Oil Market Report quantified a supply-demand imbalance of approximately 6 mb/d spanning March through June 2026. To contextualise that figure:
- The COVID-19 pandemic produced a demand collapse of roughly 9 mb/d in April 2020, but that was a demand destruction event, not a supply constraint
- The Russia-Ukraine conflict in 2022 removed approximately 2 to 3 mb/d from accessible supply through sanctions
- The current deficit is caused by physical supply restriction, not reduced demand, which means the normal economic adjustment mechanism of demand destruction requires prices to rise far enough to forcibly reduce consumption
This distinction is critical for understanding crude oil price trends. In a demand-led contraction, prices fall as the imbalance corrects itself. In a supply-constrained environment with stable or growing demand, prices must rise until either supply is restored or demand is destroyed through economic pain.
The Five-Stage Inventory Stress Sequence
The pathway from an initial supply shock to a physical shortage follows a recognisable progression:
- Benchmark price surge as futures markets immediately price supply risk ahead of physical scarcity
- Spot premium expansion as physical crude buyers compete for available cargoes, widening the differential between paper and physical markets
- Stockpile activation as governments and major refiners begin drawing down strategic and commercial reserves to bridge the supply gap
- Operational stress threshold as inventory levels approach the minimum working volumes required to maintain refinery run rates and distribution logistics
- Physical allocation failures where product shortages emerge at the regional or national level, triggering rationing mechanisms or administered price interventions
JPMorgan estimated in May 2026 that OECD inventories could reach what it characterised as operational stress levels by early June 2026, suggesting the market may already be entering Stage 4 of this sequence.
What Major Financial Institutions Are Forecasting
The institutional forecasting community has responded to the breakout with coordinated upward revisions across base cases and stress scenarios alike.
| Institution | Base Case Position | Stress Scenario Framing |
|---|---|---|
| Goldman Sachs | Upward revision to near-term forecasts | Elevated if Hormuz constraint persists |
| Citi | Supports $104+ average for Q2 2026 | Prolonged disruption risk priced in |
| ING | Raised near-term forecasts | Extended geopolitical premium expected |
| Aberdeen Economists | ~$104 Q2 average | Up to $180/bbl if Hormuz constrained long-term |
The $180 figure, cited by Aberdeen economists in analysis reported by analysts at OilPrice.com, deserves careful framing. It represents a stress scenario, not a central forecast. Its significance lies not in its probability but in the fact that credible institutional analysts are treating it as a scenario worth modelling, which itself signals how severely they assess the tail risk distribution.
A $180 per barrel stress scenario implies a 60%+ premium above already elevated spot prices. If realised, the macroeconomic transmission effects would extend well beyond energy markets into sovereign debt dynamics, currency crises in import-dependent nations, and central bank policy paralysis.
Three Forward Trajectory Scenarios
Scenario A: Partial Resumption (Base Case)
Hormuz traffic partially normalises within four to six weeks, Brent stabilises in the $95 to $105 range, and inventory rebuild begins in the second half of 2026. Inflation pressure moderates but remains elevated through year-end.
Scenario B: Prolonged Stalemate (Elevated Risk)
Hormuz constraints persist through Q3 2026, Brent consolidates above $115 to $125, OECD inventories breach operational stress thresholds, and emergency allocation frameworks are activated across multiple major economies.
Scenario C: Escalation Spiral (Tail Risk)
Military escalation expands beyond current parameters. Brent approaches or exceeds the $150 to $180 stress range. Global recession risk materialises through energy cost transmission into consumer prices, corporate margins, and sovereign fiscal positions.
How $111 Oil Transmits Through the Global Economy
The macroeconomic consequences of sustained crude prices above $111 are not evenly distributed. They cascade through economies according to their import dependency, industrial structure, and fiscal capacity to absorb subsidy costs.
Direct Cost Impacts
- U.S. retail gasoline prices rose toward $4.18 per gallon alongside the crude rally, creating consumer-level inflation pressure in an economy where fuel costs feed directly into discretionary spending
- Aviation fuel costs have escalated to levels that industry analysts warn could disrupt summer travel patterns, with airline ticket price increases lagging but following fuel cost movements with a typical lag of four to eight weeks
- Diesel and heating oil price increases are pressuring freight and logistics costs globally, embedding energy inflation into the price of virtually every traded good
- India's wholesale inflation reached a 3.5-year high as fuel costs surged approximately 25%, an economy particularly exposed given its very high net oil import dependency
Exposure by Major Economy
| Economy | Import Dependency Profile | Estimated Exposure at $111+ Brent |
|---|---|---|
| Japan | High | Refinery utilisation at 73% drawing on strategic stocks |
| India | Very High | Wholesale inflation at 3.5-year high; fuel up 25% |
| Europe | Moderate to High | Compounded by simultaneous LNG market disruption |
| China | High | Partially managed through Iran relationship and diversified supply |
| United States | Low to Moderate | Consumer impact via gasoline prices approaching $4.18/gallon |
How Governments Are Responding
The breadth of emergency measures activated across approximately 80 nations by mid-May 2026 illustrates that this has transitioned from a financial market event to a macroeconomic crisis requiring administrative intervention:
- India's Prime Minister ordered a 50% reduction in official motorcade sizes as a symbolic and practical fuel conservation measure, alongside raising retail fuel prices for the first time in four years
- Japan's refineries hit a utilisation rate of 73% as strategic oil stocks were channelled into the production system to maintain domestic fuel availability
- China eased fuel export rules but remained cautious about fully liberalising outbound shipments, reflecting domestic supply security prioritisation
- Strategic petroleum reserve releases were initiated across multiple IEA member countries, though the arithmetic of SPR capacity against a 6 mb/d deficit reveals their role as a bridging mechanism rather than a structural solution
The next major ASX story will hit our subscribers first
OPEC+ Arithmetic: Why Spare Capacity Cannot Close the Gap
A common market assumption is that OPEC+ spare capacity provides an effective insurance mechanism against supply shocks. However, in the current configuration, that assumption requires stress-testing. OPEC's market influence has historically served as a balancing mechanism, but the physical reality of Hormuz constraints fundamentally limits what any producer can deliver to market.
OPEC+ collective spare capacity estimates prior to the current crisis ranged between 3 and 4 mb/d, with the majority concentrated in Saudi Arabia and the UAE. Against a 6 mb/d deficit, this leaves a structural gap of at least 2 mb/d even if every available barrel were immediately activated. Additional UAE export capacity faces the same Hormuz transit constraint affecting the broader market.
There is also a paradox embedded in the current OPEC+ position. Russia's oil revenues surged by an estimated $6.3 billion as elevated prices more than offset production constraints, creating a financial incentive structure that does not align neatly with rapid resolution. Nations receiving windfall revenues from elevated prices have limited economic motivation to accelerate the diplomatic or production responses that would compress those prices.
An additional complication is that Malaysia reported a surge in Iranian ship-to-ship oil transfers, suggesting that sanctioned Iranian crude continues to find market access through transshipment mechanisms, but at volumes that cannot substitute for normal Hormuz transit flows at scale.
The Timing Asymmetry That Markets Cannot Ignore
Perhaps the most underappreciated structural risk in the current situation is the timing mismatch between physical market dynamics and diplomatic resolution timelines. Physical oil inventories deplete in weeks to months when a 6 mb/d gap persists. Diplomatic negotiations, particularly those involving Iran, the United States, and the complex triangulation of Chinese interests, operate on months to years timelines.
This asymmetry means that even a successful diplomatic outcome emerging in June or July 2026 may arrive after OECD inventories have already reached the operational stress thresholds JPMorgan has flagged. Markets would need to see credible, verifiable progress on Hormuz reopening, not just diplomatic engagement, before pricing in a sustained correction. Furthermore, the oil price rally dynamics that preceded this crisis have left strategic reserves in a weaker starting position than in prior disruption events.
Trump's scheduled meeting with national security advisors in the Situation Room on Tuesday, 20 May 2026, was being monitored by Reuters as a potential escalation signal. Any military action beyond the current parameters of Project Freedom would eliminate the base case scenario almost entirely and shift market pricing toward Scenario B or C frameworks.
FAQ: Brent Breaks $111 and the Oil Shortage Risk
What caused Brent to break above $111 per barrel?
A convergence of drone strikes on Gulf infrastructure, the failure of Trump's China visit to produce a U.S.-Iran breakthrough, and a physically tightening crude market with inventories depleting at an accelerated pace drove the moment when Brent breaks $111 oil shortages became a global headline in May 2026.
How large is the current oil supply deficit?
The IEA's May 2026 Oil Market Report estimated a supply-demand gap of approximately 6 million barrels per day between March and June 2026.
Could oil prices reach $180 per barrel?
Aberdeen economists are modelling a scenario in which Brent approaches $180 per barrel under a prolonged Hormuz constraint. This is a stress scenario, not a base case, but it is being treated as a credible tail risk by institutional analysts.
When could OECD inventories reach critical levels?
JPMorgan estimated in May 2026 that OECD inventories could approach operational stress thresholds by early June 2026 if current drawdown rates continue without supply restoration.
What does $111 oil mean for consumers?
U.S. gasoline prices rose toward $4.18 per gallon, India's wholesale inflation reached a 3.5-year high with fuel costs up 25%, and aviation ticket prices face upward pressure that could disrupt summer travel globally.
Why can't OPEC+ simply fill the supply gap?
OPEC+ collective spare capacity of roughly 3 to 4 mb/d falls short of the 6 mb/d deficit even at full activation. Additional UAE capacity also faces the same Hormuz constraint, and Russia's revenue windfall reduces financial pressure to accelerate a resolution.
This article is intended for informational and educational purposes only and does not constitute financial, investment, or trading advice. Oil price forecasts and scenario analyses referenced herein represent the views of third-party institutions and analysts. Energy markets involve significant uncertainty, and all forward-looking projections carry material risk of deviation from actual outcomes. Readers should conduct independent research and consult qualified financial advisors before making investment decisions.
Want to Capitalise on Market-Moving Commodity Discoveries Before the Crowd?
When energy markets shift this dramatically, resource discoveries across oil-adjacent sectors — from critical minerals to alternative energy commodities — can generate extraordinary investor returns almost overnight. Discovery Alert's proprietary Discovery IQ model scans ASX announcements in real time, instantly translating complex mineral data into actionable opportunities for both short-term traders and long-term investors — explore historic discovery returns on Discovery Alert's dedicated discoveries page and begin your 14-day free trial to position yourself ahead of the next major market move.