May 18, 2026
The Chokepoint That Controls a Fifth of the World's Oil Supply
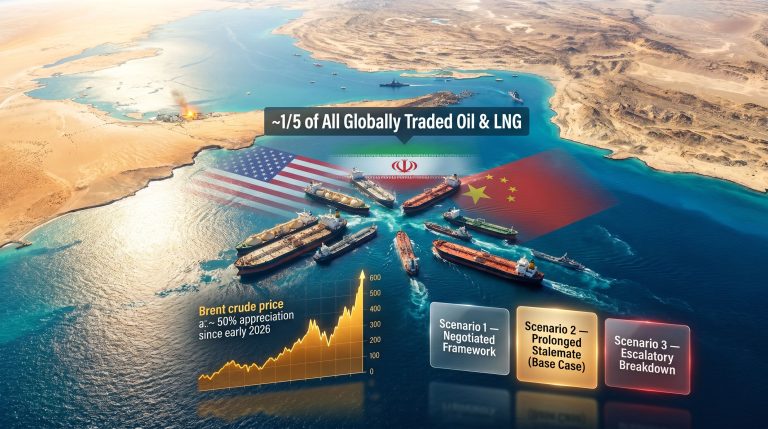
Energy markets have always carried embedded geography. The physical routes along which oil and gas travel are just as consequential as the reserves themselves, and nowhere is that principle more starkly illustrated than in a narrow stretch of water connecting the Persian Gulf to the Gulf of Oman. The Strait of Hormuz oil shortage is not simply a transit corridor concern — it represents a threat to the fulcrum of the global petroleum system, and when it stops functioning, the consequences radiate outward across every economy that depends on affordable, accessible energy.
That scenario, once treated as a theoretical stress test reserved for risk management presentations, is now playing out in real time. The prolonged disruption of transit through the strait has moved the conversation from price forecasting to supply survival, and the questions being asked across trading floors, government ministries, and refinery control rooms are becoming increasingly urgent.
Why the Strait of Hormuz Is Irreplaceable in the Global Energy Architecture
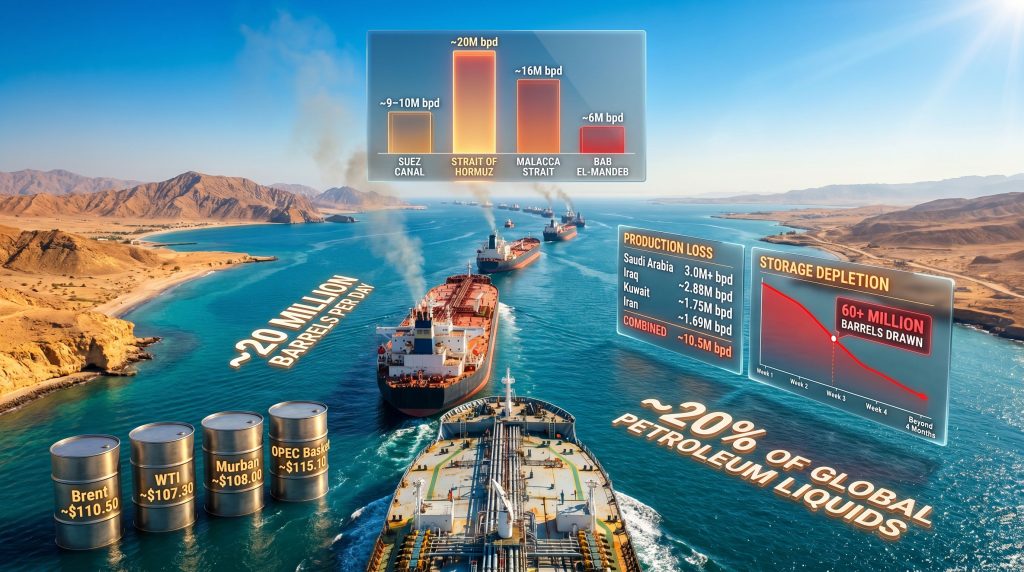
Understanding the severity of any Strait of Hormuz oil shortage requires first appreciating the structural irreplaceability of this passage. Roughly 20 million barrels per day of petroleum liquids moved through the strait in 2024, representing approximately 20% of total global consumption. At its narrowest navigable point, vessels pass through channels just 3.2 kilometres wide in each direction, meaning the world's most consequential maritime energy corridor is also one of its most physically constrained.
| Metric | Figure |
|---|---|
| Daily petroleum throughput (2024) | ~20 million barrels |
| Share of global petroleum liquids | ~20% |
| LNG volumes transiting annually | ~30% of global LNG trade |
| Countries critically dependent | Japan, South Korea, India, China |
| China's Hormuz-dependent crude imports | ~45% of total |
To place this in context, the strait's throughput dwarfs every other maritime chokepoint by a significant margin:
- Suez Canal: approximately 9 to 10 million barrels per day
- Strait of Malacca: approximately 16 million barrels per day
- Bab el-Mandeb: approximately 6 million barrels per day
- Strait of Hormuz: approximately 20 million barrels per day
No alternative route comes close to replicating this volume, which is precisely why disruption here triggers cascading failures rather than manageable inconveniences. Furthermore, understanding crude oil price trends in the lead-up to this crisis helps contextualise just how rapidly the situation has deteriorated.
When big ASX news breaks, our subscribers know first
What a Hormuz Closure Actually Does to Global Oil Supply
The Compounding Supply Destruction Cascade
The damage from a sustained Strait of Hormuz disruption is not linear. Unlike a single-nation production outage, it simultaneously removes output from multiple major producers whose export infrastructure converges on this single exit point. Cargo tracking firm Kpler reported that cumulative oil supply losses across the Middle East reached 782 million barrels as of early May 2026, measured from the disruption's onset on 28 February, with the tally on track to surpass 1 billion barrels before the end of that month.
In daily production terms, the numbers are equally stark:
| Producer | Estimated Daily Output Loss |
|---|---|
| Saudi Arabia | 3.0+ million bpd |
| Iraq | ~2.88 million bpd |
| Kuwait | ~1.75 million bpd |
| Iran | ~1.69 million bpd |
| Combined regional loss | ~10.5 million bpd |
The International Energy Agency, in its revised 2026 forecast, projected that global oil supply would contract by approximately 3.9 million barrels per day across the full year. However, the IEA separately estimated the actual daily supply loss from the Middle East at 10.5 million barrels per day, meaning the annual average figure significantly understates the severity of what is happening during peak disruption periods. Meanwhile, demand was projected to fall by only 420,000 barrels per day, creating a widening gap between what the world needs and what it can physically access.
Why Non-OPEC Producers Cannot Fill the Gap
A recurring assumption in pre-crisis energy modelling was that production flexibility outside the Middle East could absorb a moderate supply shock. The current disruption has exposed the limits of that assumption, and OPEC market influence over supply decisions has made the situation considerably more complex. Specifically:
- U.S. shale producers require between three and six months to meaningfully accelerate drilling programmes, given the lead times for equipment, labour, and well completion
- Canadian oil sands and Brazilian deepwater projects operate on development cycles measured in years, not weeks
- Spare capacity across non-Middle Eastern producers is structurally constrained after years of underinvestment driven by the energy transition narrative
- Even at maximum effort, non-OPEC production growth cannot offset losses measured in millions of barrels per day on a short-term basis
Are Strategic Oil Reserves Enough to Bridge the Gap?
The Accessible Inventory Problem
Before the conflict intensified, global oil inventories were cited as a key buffer. Pre-war projections suggested world stocks were sufficient to absorb a demand surplus approaching 4 million barrels per day, a figure that reinforced confident predictions of a prolonged glut. That calculus has been thoroughly reversed.
Kpler data showed that cumulative draws from onshore storage reached approximately 60 million barrels since late March 2026, leaving roughly 3 billion barrels nominally remaining in global onshore storage. However, Saudi Aramco's chief executive Amin Nasser highlighted a critical distinction that most market participants have underappreciated: not all of the barrels counted as being in storage are actually physically accessible on a day-to-day basis.
A substantial portion of reported inventory volumes are locked within pipeline fill requirements, minimum tank operating levels, and the routine operational constraints that keep refining and distribution infrastructure functioning. In the United States and Europe combined, the maximum physically drawable volume from storage has been estimated at approximately 2 million barrels per day, a figure that falls dramatically short of bridging a supply gap exceeding 10 million barrels daily during peak disruption.
This distinction between nominal inventory levels and operationally accessible inventory is one of the most important and least-discussed dynamics in the current crisis. Markets have been partially reassured by large headline storage numbers without adequately accounting for what fraction of those barrels can actually be mobilised under emergency conditions. The Atlantic Council has outlined how this choice between rationing now or paying a steep price later is becoming increasingly unavoidable for policymakers.
| Phase | Estimated Timeframe | Inventory Status |
|---|---|---|
| Initial disruption buffer | Weeks 1 to 4 | Moderate draws, panic buying subsides |
| Accelerating depletion | Weeks 5 to 10 | Cumulative draws approach 60+ million barrels |
| Operational stress threshold | Weeks 10 to 16 | Commercial inventories near critical minimums |
| Full shortage scenario | Beyond 4 months | Rationing, refinery curtailments, fuel access crises |
JP Morgan's commodity analysts warned that commercial oil inventories in developed economies could approach operational stress levels within weeks if the disruption continued beyond May 2026, at which point the crisis would shift from manageable to structurally destabilising.
Beyond Crude: The Refined Products Dimension
A Hidden Supply Chain Fracture
One of the most underappreciated aspects of a Strait of Hormuz oil shortage is its impact not just on crude oil, but on the downstream refined products that economies actually consume. Even where crude supplies are partially available through alternative routing, the disruption of Middle Eastern refining capacity and export logistics creates a separate and compounding shortage in the fuels that power aviation, freight, agriculture, and residential heating.
Goldman Sachs noted that commercial refined product inventories had declined to approximately 45 days of demand coverage, down from roughly 50 days before the disruption began. A 10% erosion in the refined product buffer may appear modest in isolation, but it represents a meaningful reduction in the system's resilience against further shocks.
The fuels most exposed to the Hormuz shortage dynamic include:
- Jet fuel and aviation kerosene, heavily concentrated in Middle Eastern export infrastructure
- Naphtha, the critical feedstock for Asian petrochemical industries including plastics and fertilisers
- LPG, which is essential for cooking and heating across South and Southeast Asian populations that lack access to piped gas networks
- Diesel and gasoil, which underpin freight logistics, agricultural machinery, and industrial operations globally
In addition, the LNG supply outlook for affected importers has deteriorated sharply, given that approximately 30% of global LNG trade transits the strait annually.
The Refinery Substitution Problem
Even crude oil successfully rerouted through alternative pathways faces a downstream obstacle that receives insufficient attention: refineries are configured to process specific crude grades, and they cannot simply switch feedstocks without significant operational adjustments. Substituting different crude types requires:
- Configuration adjustments to refinery processing units, which can take weeks to months
- Quality blending operations to match the crude slate to existing unit specifications
- Logistical restructuring of crude delivery and scheduling arrangements
- Potential yield losses across key product slates during the transition period
This means the refining system amplifies, rather than absorbs, the supply disruption, adding weeks of additional lag between any political resolution and the restoration of normal fuel availability at the end-user level.
What Alternative Routes Exist, and How Much Can They Actually Offset?
Bypass Infrastructure: Capacity Versus Reality
Several pipeline and port alternatives theoretically allow Middle Eastern producers to move crude without transiting the Strait of Hormuz. In practice, however, their combined capacity falls far short of replacing strait throughput:
| Bypass Route | Operator | Capacity | Key Limitation |
|---|---|---|---|
| Saudi East-West Pipeline (Petroline) | Saudi Aramco | ~5 million bpd | Crude only, excludes products and LNG |
| UAE Habshan-Fujairah Pipeline | ADNOC | ~1.5 million bpd (expanding to ~3 million bpd by 2027) | Limited to Abu Dhabi crude grades |
| Iraq-Turkey (Kirkuk-Ceyhan) Pipeline | SOMO/Botas | ~0.4 to 0.6 million bpd | Subject to political and technical disruptions |
Even if all bypass routes operated simultaneously at their maximum theoretical capacity, the structural deficit under full closure conditions remains in the range of 13 to 15 million barrels per day. ADNOC has announced a pipeline expansion project designed to double its Hormuz-bypass export capacity, with operational timing expected in 2027. While strategically significant over the long term, this infrastructure arrives too late to address the supply emergency unfolding in 2026.
How Asia's Major Importers Are Responding
The Region Most at Risk
Asia-Pacific economies represent the largest collective block of Hormuz-dependent energy consumers, and each major importing nation is navigating the crisis through a different strategic lens.
China faces perhaps the most complex exposure. Approximately 45% of its crude imports transit the Strait of Hormuz, and while Chinese authorities have been maintaining strategic reserve drawdowns, the country has remained cautious about releasing fuel for re-export despite some easing of export restrictions. Gasoline consumption across China is projected to fall by as much as 5.5% in 2026 if oil prices remain at elevated levels, representing a significant contraction in the world's largest vehicle market.
An intriguing and less widely discussed dynamic involves Chinese tankers actively testing transit conditions through the strait. Vessel tracking data has recorded individual Chinese-flagged tankers making passage under heightened security conditions, effectively serving as live probes of what transit risk actually looks like in practice. This reflects a sophisticated risk-management approach where actual operational data is gathered rather than relying solely on intelligence assessments.
India is absorbing the crisis across multiple dimensions simultaneously. Wholesale fuel cost inflation has surged approximately 25%, driving wholesale price indices to their highest levels in three and a half years. The trade deficit has widened materially as energy import bills expand.
India has signed strategic oil reserve and LPG supply agreements with the UAE as a partial hedge, is pushing diplomatically for extended Russian oil import waivers, and has introduced domestic fuel conservation measures including a government directive to reduce official motorcade sizes by 50%. India has also raised domestic fuel prices for the first time in four years, signalling the limits of political tolerance for absorbing import cost increases through subsidies.
A particularly notable detail: India-bound LPG tankers have been recorded transiting the strait in what shipping trackers describe as dark mode, meaning with their Automatic Identification System (AIS) transponders switched off. This practice, typically associated with sanctions evasion, is now being employed by legitimate commercial operators seeking to reduce their targeting profile during passage through a contested maritime zone.
Japan is running refinery utilisation at approximately 73% as strategic oil stocks are deployed to compensate for reduced import volumes. Japanese authorities are actively accelerating engagement with alternative LNG and crude suppliers, while Japan-bound tankers navigate elevated transit risk conditions.
Pakistan is deploying active diplomacy to secure LNG supply access through Hormuz, reflecting the acute vulnerability of smaller, less financially resilient economies that lack both the storage buffers and the geopolitical leverage available to larger importers.
The next major ASX story will hit our subscribers first
What Russia Gains From the Crisis
An Asymmetric Beneficiary
One of the most consequential and politically uncomfortable dynamics produced by the Strait of Hormuz oil shortage is the windfall accruing to Russia. Higher global oil prices more than offset any production constraints Russia faces, with revenue gains estimated at approximately $6.3 billion above prior projections.
This creates a structural incentive misalignment: the nations suffering most acutely from the supply disruption are simultaneously financing an adversarial power through elevated energy revenues. Furthermore, the trade war and oil prices dynamic has added another layer of complexity, with geopolitical tensions amplifying the financial consequences for import-dependent nations. Malaysian authorities have separately warned of a surge in Iranian ship-to-ship oil transfers in regional waters, suggesting that sanctioned crude is finding new transit pathways as the crisis reshapes maritime trade flows.
Three Pathways Forward: Scenario Analysis
Scenario 1: Negotiated Reopening by June 2026
JP Morgan's commodity strategy team has identified a diplomatic or ceasefire resolution as the base case, contingent on what analysts described as a clear and credible announcement confirmed by all parties. Under this pathway, tanker operators would need to observe multiple successful transits across different flag states before normalising freight and insurance pricing. Even then, storage replenishment, refinery restarts, and freight cost normalisation would take weeks to months.
Scenario 2: Extended Disruption Through Q3 2026
If the conflict persists through the northern hemisphere summer, commercial inventories in developed markets are projected to reach operational stress thresholds. Rationing measures would likely emerge in the most exposed import-dependent economies. Jet fuel and LPG shortages would begin affecting aviation schedules and residential energy access. Crude prices sustaining above $120 per barrel would begin triggering demand destruction in price-sensitive sectors across emerging markets.
Scenario 3: Structural Closure Extending Six Months or Beyond
Ellen Wald, Senior Fellow at the Atlantic Council's Global Energy Center, conveyed to the Wall Street Journal that inventory depletion cannot be managed indefinitely through demand reduction alone. Once storage runs out, the market faces a hard collision between physical scarcity and price discovery mechanisms. Under a prolonged closure scenario, IEA-coordinated Strategic Petroleum Reserve releases would prove insufficient to bridge the gap. Consequently, global energy trade flows could be restructured on a multi-year basis, with profound implications for oil's role in the global economy.
The EIA's detailed analysis of Hormuz transit volumes underscores precisely why even a partial or intermittent closure produces outsized economic consequences relative to other supply disruptions.
Current Market Pricing and Investor Psychology
From Panic Accumulation to Scarcity Management
| Benchmark | Recent Price Level | Recent Movement |
|---|---|---|
| Brent Crude | ~$110.50/bbl | +1.12% |
| WTI Crude | ~$107.30/bbl | +1.75% |
| Murban Crude | ~$108.00/bbl | +3.15% |
| OPEC Basket | ~$115.10/bbl | +6.90% |
Energy market analysts have noted a behavioural shift among commodity traders. The initial disruption phase was characterised by aggressive physical cargo accumulation, a classic panic-buying response that temporarily disconnected spot prices from forward curves. That phase has largely passed.
Hamad Hussain, Commodities Economist at Capital Economics, described to the Wall Street Journal how the urgent physical cargo grab has subsided, replaced by a more deliberate scarcity management regime in which buyers ration purchase volumes across longer time horizons and price discovery migrates toward forward markets.
This transition from panic to structured scarcity management is itself a signal worth monitoring. It suggests that while acute volatility may moderate temporarily, the underlying price pressure from inventory depletion has not been resolved. Freight and war risk insurance premiums on Middle Eastern routes remain elevated, keeping the total cost of delivered crude well above benchmark prices for affected buyers.
Disclaimer: This article is intended for informational and educational purposes only. It does not constitute financial, investment, or trading advice. All figures, forecasts, and scenario projections involve uncertainty and are subject to change. Readers should conduct their own research and consult qualified financial advisers before making any investment decisions.
Want to Stay Ahead of Commodity Market Shifts Driven by Global Supply Disruptions?
Discovery Alert's proprietary Discovery IQ model delivers real-time alerts on significant ASX mineral discoveries, translating complex market dynamics into actionable investment insights for both short-term traders and long-term investors. Explore how historic mineral discoveries have generated substantial returns by visiting Discovery Alert's dedicated discoveries page, and begin your 14-day free trial today to position yourself ahead of the market.