
July 10, 2026
The Futures Curve Is Speaking — But Is Anyone Listening to the Right Market?
Every experienced commodity trader knows the futures curve is a map, not the territory. In oil markets specifically, the distinction between what the paper market implies and what the physical market demands can be the difference between a profitable position and a catastrophic one. When those two worlds diverge sharply, the gap itself becomes the most instructive signal available. That divergence is precisely what characterises the current Brent crude market, where Brent contango and physical oil market tightness are running simultaneously — a condition frequently misread as confirmation of durable oversupply.
When big ASX news breaks, our subscribers know first
What Brent Contango Actually Means — and What It Does Not
Contango, in the context of crude oil futures, refers to a market structure where contracts for future delivery carry higher prices than those for immediate settlement. The front of the curve trades at a discount to the back. This structure traditionally communicates one central message: near-term supply is comfortable enough that sellers must offer barrels at a discount today to remain competitive against the prospect of cheaper future production.
The mirror image, backwardation, occurs when prompt barrels command premiums over deferred ones. This structure signals physical scarcity and immediate demand pressure — the conditions that historically accompany supply disruptions, inventory drawdowns, and production shocks. Understanding the crude oil market overview is therefore essential before drawing conclusions from curve shape alone.
The critical distinction that most market participants miss is this: contango and backwardation describe what the financial market believes is happening, not necessarily what is physically occurring in refineries, on tankers, or at loading terminals.
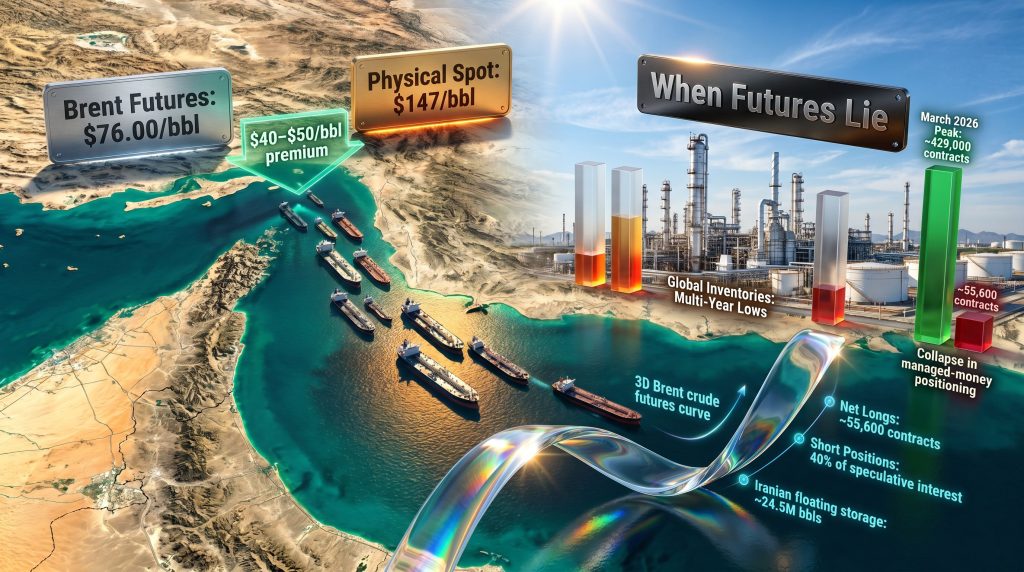
The danger in the current environment is that the Brent contango and physical oil market tightness are running in opposite directions simultaneously. The futures curve has signalled near-term adequacy while physical spot premiums for prompt crude have reached extraordinary levels — in some cases cited near $40 to $50 per barrel above futures benchmarks for grades such as Forties blend. When a refiner is willing to pay that kind of premium above the paper price, it is not because supply is abundant. It is because the barrel they need, right now, simply does not exist at the futures price.
How Three Simultaneous Events Manufactured a Paper Glut
Understanding how Brent slid toward contango requires dissecting three concurrent supply-side developments that each individually appeared bullish, but together created a misleading wave of apparent near-term abundance.
The Iranian Floating Storage Liquidation
Following the introduction of a 60-day U.S. administrative sanctions waiver in mid-June 2026, the logistical barriers that had prevented Iranian crude from reaching mainstream buyers temporarily dissolved. Insurance, financing, and maritime enforcement frameworks were suspended, allowing a large volume of previously stranded barrels to move. According to S&P Global Commodities, Iranian crude and condensate held in floating storage across East Asian waters fell from approximately 49 million barrels in May 2026 to roughly 24.5 million barrels by end of June — a drawdown of close to 50% within a single month.
This was not new supply entering the market. It was inventory liquidation — the conversion of previously stranded barrels into spot market volumes. The distinction is fundamental: new supply adds to sustained production capacity, while liquidation simply clears a backlog before conditions revert. Furthermore, as Brent crude's disconnect from physical oil prices illustrates, such temporary flows can create dangerously misleading benchmark signals.
China's Temporary Withdrawal from Crude Markets
In the aftermath of the Strait of Hormuz effective closure in early 2026, Beijing implemented a twofold response that blindsided commodity analysts globally. Domestic refined fuel exports were prohibited, and foreign crude purchasing was sharply curtailed. For a country that represents the single largest marginal source of crude demand growth, this withdrawal was consequential enough to mask the supply shock from Hormuz entirely — at least on the surface.
The artificial suppression of Chinese demand during this period was the primary mechanism through which the market appeared balanced on paper. Without China actively bidding, spot markets softened, OSPs were discounted, and the futures curve shifted toward contango. The trade war impact on oil dynamics further compounded Beijing's incentive to reduce its market footprint during this period.
Saudi Prompt Discounts Compounding the Effect
Layered on top of the Iranian liquidation and the Chinese absence, Saudi Arabia and GCC producers continued scheduled term deliveries while simultaneously offering discounted prompt-loading allocations. This created a third concurrent source of spot availability, compressing the front-month price relative to deferred contracts and reinforcing the contango structure through market mechanics alone.
Speculative Positioning Amplified the Distortion
The market's financial architecture magnified these physical developments into a more extreme signal than fundamentals alone would justify. According to Saxo Bank commodity strategy data, managed-money net long positions in Brent crude fell approximately 87% from a March 2026 peak of around 429,000 contracts to a near-historic low of just 55,600 contracts by late June. Gross short positions simultaneously climbed toward all-time highs, representing over 40% of total speculative interest — the third-highest reading in 15 years.
This extreme crowding in short positions created a market that was essentially pre-loaded for a violent reversal. When geopolitical escalation between the U.S. and Iran renewed in early July, the resulting short-covering cascade propelled Brent from around $71 per barrel back toward the $78 to $80 range. Brent was trading near $76 per barrel on July 9, 2026, having shed approximately 2.58% in a single session as traders attempted to reprice the competing signals.
When short positioning reaches historically extreme levels, the market becomes a pressure vessel. The geopolitical trigger doesn't need to be large; it simply needs to exist.
What the Physical Market Is Actually Saying
While the paper market was pricing in adequacy, the physical crude market was communicating something entirely different. The following indicators, taken together, present a picture of acute underlying scarcity:
| Market Indicator | Current Signal | Strategic Implication |
|---|---|---|
| Brent futures curve | Contango | Paper market sees near-term adequacy |
| Iranian floating storage | Down ~50% in one month | Temporary liquidation, not new supply |
| Physical spot premiums | $40–$50/bbl above futures | Immediate barrels remain genuinely scarce |
| Hormuz throughput | Up to 10 mbpd at risk | Physical supply chain severely constrained |
| Global inventory levels | Multi-year lows | No buffer against additional disruption |
| Managed-money net longs | Near historic low | Financial positioning misaligned with fundamentals |
| Russian diesel exports | Down ~50% year-over-year | Middle distillate markets facing structural deficit |
The Strait of Hormuz handles an estimated 20 to 21% of global oil trade under normal conditions, or roughly 17 to 21 million barrels per day. A seven-week period of effective closure represents a sustained supply shock with few modern precedents. Consequently, the idea that the global market is in structural oversupply requires extraordinary evidence to sustain.
Global crude inventories had already entered 2026 at multi-year lows following a cumulative draw exceeding one billion barrels across 2025 and 2026. The physical market was running a structural deficit of approximately two million barrels per day before Hormuz disruptions escalated. Contango built on top of that foundation is not a durable market structure. It is a temporary technical condition resting on a foundation that is actively being removed.
Three Scenarios Where the Contango Signal Actively Misleads
The analytical framework for understanding why Brent contango and physical oil market tightness can coexist is best expressed through three distinct scenario pathways, each of which the current market is navigating simultaneously.
Scenario One: The Temporary Liquidation Mirage
When a large volume of previously stranded or sanctioned crude enters spot markets simultaneously, it creates a localised, time-limited surplus. This generates a contango signal without representing any improvement in underlying supply capacity. Once the liquidation wave is absorbed, the structural deficit reasserts itself — sometimes with significant velocity. The ~24.5 million barrels of Iranian floating storage absorbed within weeks is the living example of this mechanism.
Scenario Two: The Demand Suppression Illusion
China's deliberate withdrawal from crude purchasing temporarily reduced apparent global demand, making the market look balanced. Chinese refiners, including major independent operators such as Rongsheng Petrochemical, have since received export permits and are projected to process and export approximately three million tonnes of refined fuel within a single month. To support this export programme, Chinese buyers secured an estimated 26 million barrels of GCC crude for July to August 2026 delivery, according to data cited by Argus. The demand that appeared to have disappeared has returned at scale.
Scenario Three: The Policy Reversal Shock
The 60-day U.S. administrative waiver on Iranian crude flows — the primary mechanism enabling the floating storage drawdown — was cancelled. Approximately 63 million barrels of crude were reported stranded at sea following the waiver's abrupt termination. Buyers who had integrated Iranian supply into procurement schedules must now source replacement barrels from an already constrained market, and the insurance and financing frameworks that had briefly enabled these flows have reverted to full sanctions posture.
Traders positioning for a sustained contango structure should recognise that all three conditions generating that structure are unwinding concurrently. That is not a gradual rebalancing. That is a structural convergence.
The next major ASX story will hit our subscribers first
The Russian Diesel Deficit: A Tightening Force Flying Under the Radar
One of the most underappreciated supply-side developments in the current cycle is the structural reduction in Russian diesel export capacity. Ukrainian precision strikes on Russian refining infrastructure have generated a year-over-year decline in Russian diesel exports of approximately 50%, creating a significant withdrawal from global middle distillate markets that extends well beyond crude oil dynamics.
European diesel markets, which were already structurally recalibrating following the supply realignment that began in 2022, now face renewed tightening pressure. The increased Chinese diesel exports projected to enter the market will function as an offset to this Russian shortfall, not as an addition to overall supply. The net effect on middle distillate market balance is closer to neutral than bearish — a nuance frequently missed in headline-level analysis.
This compounding pressure across crude and refined product markets simultaneously is one of the distinguishing features of the current cycle that makes simplistic contango-based bearish narratives particularly vulnerable to disconfirmation. In addition, the oil price volatility factors at play in 2025 and 2026 have significantly increased the complexity of reading market structure signals accurately.
How to Read Dual Market Signals: A Decision Framework
For participants navigating the divergence between Brent contango and physical oil market tightness, a structured analytical approach to interpreting competing signals is essential:
-
Identify the origin of the contango. Is it driven by genuine supply growth, or by the temporary liquidation of previously stranded inventory? These are categorically different conditions with opposite implications for durability.
-
Cross-reference with physical premiums. When prompt delivery prices diverge materially from futures benchmarks, the physical market is providing the more reliable signal about immediate supply-demand conditions.
-
Assess the inventory trajectory. Contango is only sustainable as a market structure when inventory builds are actually occurring. In a sustained draw environment, contango is a lagging indicator, not a leading one.
-
Evaluate the durability of the policy conditions enabling supply relief. When the primary driver of apparent near-term adequacy is a temporary administrative waiver, the market is exposed to reversal risk the moment that policy changes.
-
Monitor speculative positioning extremes. Historically crowded short positions create non-linear risk to the upside. The trigger for a reversal may be geopolitical rather than fundamental, but the magnitude of the move will be determined by how extreme the positioning has become.
Near-Term Price Pathways and Structural Outlook
What Do Current Conditions Imply for Brent Pricing?
The simultaneous unwinding of all three contango-generating conditions — the Iranian waiver expiry, the return of Chinese crude demand, and the absorption of floating storage — creates a high-probability scenario for market tightening in the two to eight week horizon. Goldman Sachs has flagged fresh threats to global oil supply as a primary risk factor in current conditions, noting that the convergence of physical disruptions and historically low inventory levels represents a risk environment that futures pricing has not fully incorporated.
A retest of the $78 to $80 per barrel range for Brent appears structurally supported under current conditions. A move toward $85 to $90 per barrel becomes increasingly probable if Hormuz disruptions persist beyond 30 days without meaningful normalisation. At the extreme, some physical market analysts have cited a $150 to $160 per barrel range as a potential demand destruction threshold if the full convergence of Hormuz disruption, Iranian sanctions reinstatement, Russian export reductions, and Chinese demand reactivation materialises simultaneously.
Saudi Arabia's evaluation of Red Sea pipeline expansion routes as a bypass for Hormuz-dependent export volumes signals that even the largest producers recognise this constraint as a structural risk rather than a temporary episode. However, infrastructure timelines mean that any meaningful bypass capacity is years away from realisation. Furthermore, OPEC's market influence over production scheduling decisions will remain a critical variable in determining how quickly the physical market rebalances.
The broader context of oil trade and geopolitics also reinforces why simplistic curve-reading is particularly hazardous in the current environment. The key takeaway for market participants is straightforward: a futures curve built on temporary policy waivers, forced inventory liquidation, and artificially suppressed demand is not a reliable foundation for a sustained bearish thesis.
The physical market, speaking through spot premiums, inventory trajectories, and refinery nomination data, is currently providing a materially more accurate read of underlying conditions than the Brent futures curve. As financial markets continue to miss the mark on oil price predictions, treating the contango signal as durable — without interrogating the conditions that created it — represents one of the more consequential analytical errors available to make in this market cycle. Indeed, academic research on contango, backwardation and current oil dynamics further underscores that curve structure alone is an insufficient basis for positioning decisions when physical and financial markets are this deeply misaligned.
Disclaimer: This article is intended for informational and educational purposes only and does not constitute financial, investment, or trading advice. All price references, positioning data, and market forecasts involve forward-looking elements and inherent uncertainty. Readers should conduct their own independent research before making any investment decisions. Past market patterns are not necessarily indicative of future outcomes.
Want to Stay Ahead of Major Resource Discoveries Before the Broader Market Catches On?
While oil market dynamics reveal how quickly supply-demand signals can diverge from reality, the same principle applies to mineral exploration — where timing is everything. Discovery Alert's proprietary Discovery IQ model scans ASX announcements in real time, translating complex geological data across more than 30 commodities into clear, actionable insights, so subscribers can identify significant mineral discoveries the moment they are announced. Explore historic discovery returns on Discovery Alert's dedicated discoveries page and begin a 14-day free trial to position yourself ahead of the market.