July 20, 2026
When Geography Becomes Destiny: The Strait of Hormuz and the Logic of $90 Oil
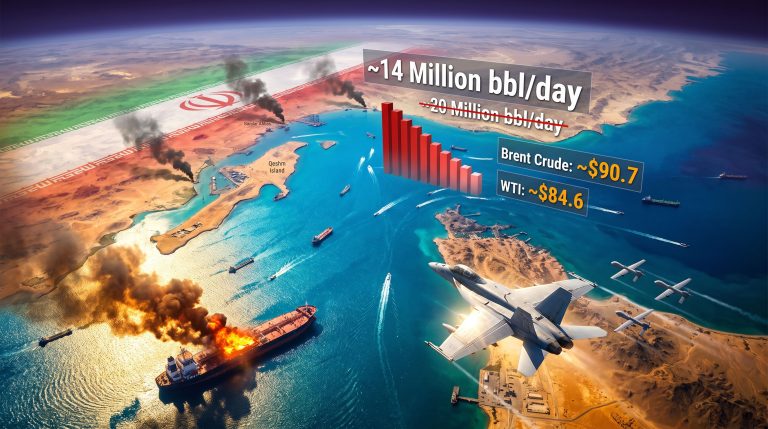
There is a narrow passage of water, roughly 33 kilometres wide at its tightest point, that quietly determines the pace of industrial civilisation across three continents. The Strait of Hormuz has never been an abstraction for energy markets. It is a physical constraint built into the architecture of global oil trade, and when military conflict threatens that constraint, price discovery becomes something closer to controlled panic. Brent breaks past $90 as U.S.-Iran conflict rages on, reactivating a risk that energy markets have always known was there.
Understanding why Brent crude has broken past $90 per barrel requires more than reading a price chart. It requires understanding why this particular chokepoint carries asymmetric consequences, why the structural backdrop of 2026 makes markets more vulnerable than they were during previous tension cycles, and what the trajectory of military operations signals about where prices may head next. For broader context on crude oil price trends, the current escalation fits a pattern that analysts have been monitoring closely.
When big ASX news breaks, our subscribers know first
The Strait of Hormuz: Why No Other Chokepoint Compares
One Passage, No Substitutes
Approximately one-fifth of all globally traded oil moves through the Strait of Hormuz on any given day. That single statistic captures the fundamental problem: there is no viable alternative routing for Persian Gulf crude. Pipelines exist, but their capacity is a fraction of what moves by tanker. Unlike the Suez Canal, where vessels can reroute around the Cape of Good Hope at significant cost and delay, a Hormuz closure leaves Gulf producers effectively landlocked.
This structural reality creates what traders call asymmetric price risk. When a disruption threatens a chokepoint with no bypass, even a partial reduction in throughput generates price responses that are disproportionate to the actual volume loss. Markets price the possibility of total closure, not just the reality of partial disruption.
How the Major Chokepoints Stack Up
| Chokepoint | Approximate Share of Global Oil Trade | Primary Risk Factor | Viable Alternative Route |
|---|---|---|---|
| Strait of Hormuz | ~20% | Military conflict, naval blockade | None |
| Strait of Malacca | ~25% of Asian supply | Geopolitical tension, piracy | Limited |
| Suez Canal | ~12% | Regional instability | Cape of Good Hope (costly, slow) |
| Bab el-Mandeb | ~6-8% | Houthi activity, conflict spillover | Suez Canal bypass possible |
The Hormuz column stands out precisely because of what the final column shows. Every other major chokepoint has at least a partial workaround. Hormuz does not. That absence of alternatives is exactly why oil markets respond so sharply when military operations escalate in its vicinity.
Nine Consecutive Nights: Why Operational Tempo Transforms Market Pricing
The Difference Between a Strike and a Campaign
Energy markets have a well-documented pattern of overreacting to single geopolitical events and then rapidly giving back those gains once the immediate threat fades. A one-off retaliatory strike typically generates a price spike lasting 48 to 72 hours before fundamental supply-demand logic reasserts itself. What is unfolding in the current U.S.-Iran conflict is, however, categorically different.
American forces entered a ninth consecutive night of strikes against Iranian targets as of July 20, 2026, with U.S. Central Command confirming operations targeting Iranian coastal surveillance systems, air defence infrastructure, maritime assets, and missile and drone storage facilities. Separately, Islamic Revolutionary Guard Corps units connected to the July 17 attack on U.S. personnel in Jordan were also struck.
This is not tactical opportunism. Nine consecutive nights of coordinated operations across multiple target categories represents a sustained degradation campaign. For oil markets, that distinction is critical: sustained campaigns embed risk premiums into the forward curve rather than producing the temporary spike-and-fade pattern associated with isolated incidents.
Casualty Escalation and Market Repricing
The human dimension of this conflict has amplified market anxiety in a specific and measurable way. The U.S. military confirmed the death of a third American service member during recent operations, while investigators recovered unidentified remains near the site of an Iranian attack in Jordan that had previously left two personnel dead and one missing.
Each confirmed casualty milestone carries market implications beyond the humanitarian dimension:
- Political pressure to intensify operations increases, extending the timeline of the engagement
- Diplomatic off-ramps narrow as domestic political constituencies demand visible responses
- Institutional traders extend their long positioning in crude futures, anticipating a longer disruption window
- Insurance underwriters reprice war risk premiums for vessels transiting the Gulf, adding a hidden but real cost layer to delivered crude
"The escalation pattern observed in mid-July 2026 follows a logic that commodity markets have long understood: when military operations shift from being time-limited to being open-ended, the geopolitical risk premium stops being a temporary overlay and becomes a structural component of the price."
Brent at $90.79: Decoding the Price Action
What Monday's Numbers Actually Reveal
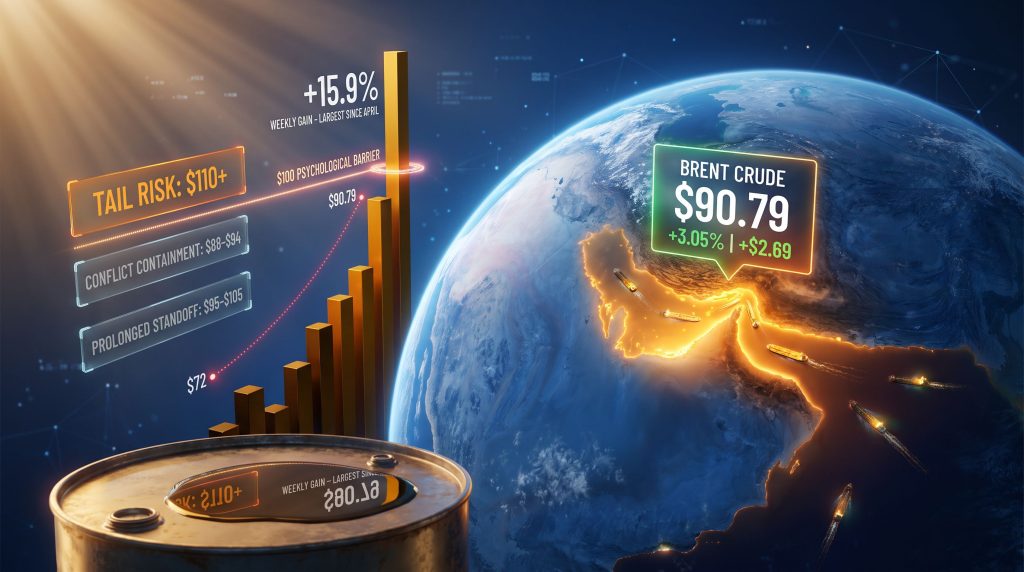
On July 20, 2026, international benchmark Brent crude for September delivery rose approximately 3.05% to reach $90.79 per barrel, while U.S. West Texas Intermediate crude for August delivery climbed roughly 2.4% to $84.49. These single-session moves arrived on top of the prior week's extraordinary performance.
| Benchmark | Price Level (July 20) | Single-Session Move | Prior Week Gain | Notable Context |
|---|---|---|---|---|
| Brent Crude (Sept. Delivery) | $90.79 | +3.05% (+$2.69) | +15.9% | Highest since June 11, 2026 |
| WTI Crude (Aug. Delivery) | $84.49 | +2.4% | Correlated move | Key psychological resistance level |
| Pre-Conflict Brent Baseline | ~$72 | – | – | Approximate pre-escalation level |
The prior week's 15.9% gain in Brent crude is the data point that most clearly reveals the structural nature of what markets are pricing. Weekly crude moves of that magnitude are exceptionally rare, typically associated only with the most severe supply shock events. Furthermore, the fact that Monday's session extended those gains rather than producing a mean-reversion pullback suggests institutional conviction behind the positioning.
From the pre-conflict baseline of roughly $72 per barrel, Brent has now absorbed approximately $18-19 per barrel in pure geopolitical risk premium. That accumulated premium represents the market's probability-weighted assessment of sustained supply disruption, not a momentum-driven overshoot. This kind of oil geopolitics analysis highlights how swiftly risk premiums can build during active conflicts.
Scenario Pathways for Brent Through September 2026
Quantum Strategy's David Roche flagged in a Monday note that global crude markets have entered a structurally tighter phase as Gulf export volumes contract, warning that inventory stress could intensify by September and projecting a Brent target range of $95 to $105 per barrel.
Three distinct scenarios now define the potential price landscape:
Scenario 1: Conflict Containment
- Diplomatic back-channels reopen within two to three weeks
- Hormuz traffic partially normalises; Brent consolidates in the $88-$94 range
- Inventory stress is delayed but not eliminated; structural tightness persists into Q4
Scenario 2: Prolonged Military Standoff
- Operations continue through August with no resolution visible
- Hormuz effectively closed to normal commercial traffic patterns
- September inventory tightness materialises as forecast; Brent tests $95-$105
Scenario 3: Broader Regional Escalation (Tail Risk)
- Additional regional actors are drawn into the conflict
- Multiple Gulf export terminals face simultaneous disruption
- Brent exceeds $110; emergency energy measures activated across major consuming nations
Why 2026 Is Not 2019: The Structural Vulnerability Difference
A Thinner Buffer Against Shock
When Hormuz tensions flared in 2019 and again in 2020, global energy markets carried substantially more shock-absorption capacity than they do today. Three interconnected vulnerabilities have compounded since then:
- Reduced OPEC+ spare capacity: Production cut agreements implemented over recent years have left the cartel with a narrower buffer of immediately deployable barrels to offset disruption-driven shortfalls. Indeed, OPEC's market influence has been a defining feature of how supply constraints propagate through global benchmarks.
- Depleted strategic petroleum reserves: Major consuming economies drew down their strategic reserves aggressively during the 2022-2023 energy crisis and have not fully rebuilt those stockpiles to pre-drawdown levels.
- Structural demand resilience: Global oil consumption has remained firm, particularly across emerging Asian economies, reducing the demand-side cushion that might otherwise absorb a supply shock.
The convergence of these three factors means that the same geopolitical event produces a larger price response in 2026 than it would have five years earlier. Markets are not overreacting. They are accurately pricing a world with less buffer.
Regional Exposure: Who Bears the Most Risk
| Region | Hormuz Dependency | Primary Alternative Supply Source | Vulnerability Rating |
|---|---|---|---|
| East Asia (Japan, South Korea, China) | Very High | U.S. LNG, West African crude | High |
| South Asia (India) | High | Russian crude, West African supply | Moderate-High |
| Europe | Moderate | North Sea, U.S. LNG, North African supply | Moderate |
| United States | Low-Moderate | Domestic production, Canadian imports | Low-Moderate |
The asymmetry of exposure is striking. East Asian economies that have rebuilt their manufacturing and export sectors around reliable Gulf crude access now face their greatest supply security test in years. For Japan and South Korea in particular, which lack meaningful domestic hydrocarbon production, a sustained Hormuz disruption is not a financial inconvenience. It is an industrial emergency.
Kuwait, Bahrain, and the GCC Exposure Problem
Reports of additional Iranian strikes against Kuwait and Bahrain during the current escalation period have introduced a dimension that goes beyond simple shipping lane security. If Gulf Cooperation Council member infrastructure becomes a target, the risk calculus extends from maritime disruption to export terminal vulnerability. Insurance premiums on tankers transiting the region have already escalated sharply, creating a hidden cost layer that adds to the delivered price of crude even when tankers successfully complete their voyages.
From Crude to Consumer: The Inflation Transmission Chain
How $90 Brent Reaches the Petrol Station
The mechanism connecting benchmark crude prices to everyday consumer costs operates through several channels simultaneously:
- Retail fuel prices typically lag crude movements by two to four weeks, meaning households will feel the July 20 price surge at the pump in early-to-mid August
- Aviation fuel and diesel surcharges respond more quickly, affecting airline ticket pricing, freight logistics, and the cost of goods that require energy-intensive transport
- Indirect CPI components including food production, plastics, and chemicals are priced with energy costs embedded, meaning inflation pressure radiates well beyond the fuel pump
The Central Bank Dilemma
Sustained crude prices above $90 arrive at a particularly uncomfortable moment for central banks that had been building the case for policy easing. An energy-driven inflation spike reintroduces upward CPI pressure at precisely the point where rate-cut trajectories were being mapped. This dynamic mirrors broader concerns about the safe-haven market response that investors have adopted when inflationary shocks collide with geopolitical uncertainty.
| Brent Scenario | Inflation Impact | Central Bank Response Risk | Growth Impact |
|---|---|---|---|
| Stabilises at $88-$92 | Moderate CPI uptick | Rate cut timeline extended | Mild economic slowdown |
| Reaches $95-$100 | Significant CPI pressure | Rate cuts postponed materially | Moderate slowdown |
| Exceeds $100 | Stagflationary risk territory | Policy paralysis possible | Severe slowdown risk |
The $100 per barrel threshold deserves particular attention. Historically, triple-digit crude prices activate demand destruction responses as consumers and businesses curtail energy use, which eventually creates a self-correcting mechanism. However, in a supply-shock-driven price environment rather than a demand-driven one, demand destruction provides only partial relief. The supply constraint persists regardless of whether consumers reduce consumption.
The next major ASX story will hit our subscribers first
The Domestic Political Dimension: TACO Pressure and Conflict Duration
One analytical angle that receives insufficient attention in energy market commentary is the domestic political economy of sustained high fuel prices. When crude benchmarks remain elevated, retail energy costs climb, and that inflation becomes visible to ordinary voters in a way that most macroeconomic variables do not.
The concept of political tolerance constraints on administrations pursuing energy-disrupting military strategies introduces a feedback loop that is genuinely underappreciated. Prolonged conflicts that drive Brent materially above $90 generate measurable consumer inflation pressure, particularly at the U.S. fuel pump, which historically creates political urgency to pursue resolution or de-escalation pathways.
Furthermore, that political pressure operates on a different timeline than military strategy, and the two can diverge significantly, creating uncertainty about how long the current operational tempo can be sustained without triggering a domestic political recalibration. The oil prices and trade war dynamic from recent years demonstrated how economic pressures can ultimately reshape policy priorities.
"The inventory stress timeline flagged by analysts, pointing to critical tightness by September 2026, is not an abstraction. It maps directly onto the political calendar of an administration that must weigh military objectives against the domestic economic consequences of sustained energy disruption."
Frequently Asked Questions: Brent Breaking $90 and the U.S.-Iran Conflict
Why did Brent crude break $90 in July 2026?
Brent crude surpassed $90 per barrel on July 20, 2026, as U.S. forces entered a ninth consecutive night of military strikes against Iranian targets and commercial shipping through the Strait of Hormuz faced sustained disruption. The $90.79 closing level represented the benchmark's highest point since June 11, 2026, and built on the prior week's exceptional 15.9% gain.
What is the Strait of Hormuz and why does it drive oil prices?
The Strait of Hormuz is a narrow maritime passage between Iran and Oman that serves as the only viable export route for crude oil produced across the Persian Gulf basin. Roughly one-fifth of all globally traded oil transits this corridor. With no alternative routing available, any sustained disruption translates directly into tighter global supply and higher benchmark prices.
How high could Brent crude go if the conflict continues?
Analyst projections place a Brent target range of $95 to $105 per barrel if Gulf export disruptions persist through August and September 2026. A broader regional escalation involving multiple Gulf export terminals could push prices above $110. The psychologically and analytically significant $100 level is widely regarded as the threshold at which demand destruction and central bank policy responses become active market forces.
What was Brent crude trading at before the current conflict escalation?
Prior to the current escalation cycle, Brent crude traded at approximately $72 per barrel. The conflict has since added roughly $18-$19 per barrel in geopolitical risk premium, representing one of the largest sustained premium additions to crude prices in recent years.
How does elevated crude pricing affect ordinary consumers?
Retail fuel costs typically reflect crude price movements with a two-to-four week lag. Beyond direct fuel costs, elevated crude prices filter through to airline ticket prices, logistics and freight charges, food production costs, and a wide range of manufactured goods that rely on petroleum-derived inputs. Consequently, sustained Brent prices above $90 create measurable upward pressure across consumer price indices.
Key Takeaways: What Brent Above $90 Actually Means
- Brent crude's breach of $90 per barrel reflects structural supply disruption mechanics, not temporary speculative excess
- The Strait of Hormuz, carrying approximately one-fifth of global oil trade with no viable bypass route, is the physical mechanism driving the price surge
- Nine consecutive nights of U.S. military operations signal a sustained degradation campaign, embedding persistent risk premiums rather than producing short-lived spikes
- The prior week's 15.9% gain in Brent, one of the largest weekly moves in years, confirms institutional conviction behind the price move
- Analyst consensus points to a $95-$105 Brent range if disruptions extend into September, with a tail risk scenario above $110
- Global inventory buffers are materially thinner than during previous tension cycles, amplifying price sensitivity to each incremental disruption
- The $100 per barrel threshold carries stagflationary implications for central bank policy frameworks across major economies
- Domestic political pressure dynamics in the United States introduce a variable that could influence conflict duration and resolution timelines in ways that are difficult to model but cannot be ignored
Disclaimer: This article contains forward-looking analysis, scenario projections, and analyst commentary that involve significant uncertainty. Crude oil prices are influenced by a wide range of geopolitical, economic, and physical factors, and actual outcomes may differ materially from any projections discussed. This content is intended for informational purposes only and does not constitute financial or investment advice. Readers should conduct their own research and consult qualified professionals before making any investment decisions.
Want to Capitalise on Commodity Volatility Before the Broader Market Does?
When geopolitical shocks send energy and resource prices surging, timing is everything — Discovery Alert's proprietary Discovery IQ model delivers real-time alerts on significant ASX mineral discoveries, transforming complex market signals into actionable opportunities the moment they emerge. Explore historic discoveries and their extraordinary returns on Discovery Alert's dedicated discoveries page, and begin your 14-day free trial today to position yourself ahead of the next major market move.