
June 26, 2026
The Anatomy of a Falling Oil Price in a World Still Short of Supply
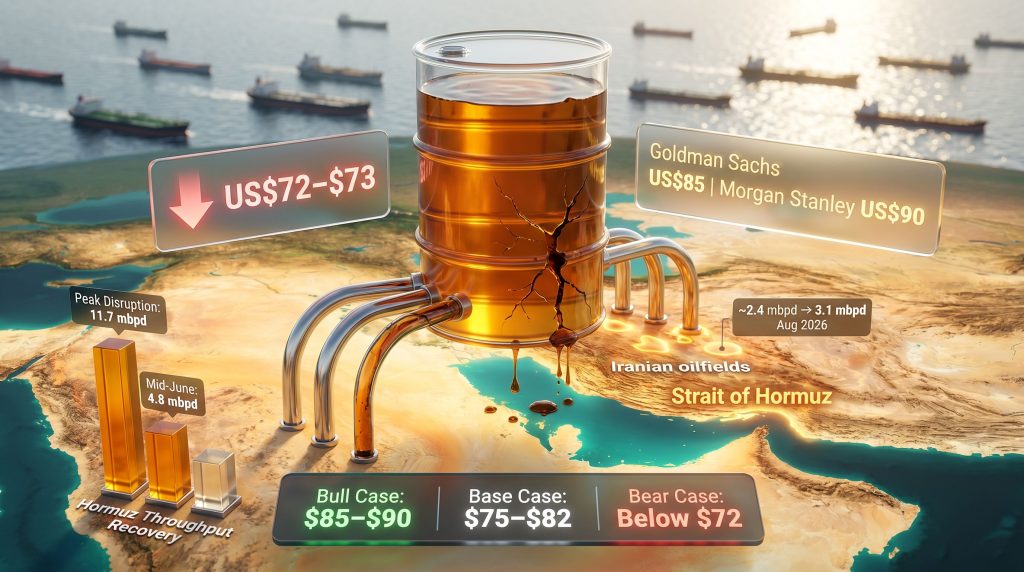
There is a peculiar phenomenon that repeats itself across commodity markets with remarkable consistency: prices often move against the prevailing physical reality. Nowhere is this more visible right now than in crude oil, where Brent is trading near US$73 per barrel, close to its lowest level in three months, even as the Strait of Hormuz, the world's most consequential energy chokepoint, continues to operate well below its pre-conflict throughput capacity.
This is not a market malfunction. It is a forward-pricing mechanism at work, with traders discounting a supply recovery that has not yet fully materialised in physical terms. Understanding why Brent crude slips as Gulf output recovers quickly requires unpacking several layers of market behaviour, geopolitical signalling, infrastructure constraints, and production economics that rarely surface in headline coverage. The crude oil market dynamics at play here are, furthermore, shaped by forces well beyond simple supply and demand.
When big ASX news breaks, our subscribers know first
The Supply Numbers Behind the Price Decline
The scale of the Gulf output recovery since peak disruption is genuinely significant. According to estimates from Rystad Energy, shut-in production across the Gulf region reached 11.7 million barrels per day (mbpd) at the height of the conflict in early June 2026. By mid-June, that figure had fallen to 9.6 mbpd, representing a reduction of approximately 2.1 mbpd returning to the market within roughly three weeks. Rystad has subsequently moved its forecast for full regional supply restoration forward by one quarter, now projecting completion by the end of 2026.
The rebound has not been uniform across producers. The recovery scorecard looks like this:
| Producer | Current Status | Key Development |
|---|---|---|
| Iran | ~2.4 mbpd, rising fast | Shorter shut-in, limited upstream damage |
| Saudi Arabia | Targeting ~4.5 mbpd via Yanbu | Record pipeline-routed export flows |
| Kuwait | Force majeure fully lifted | Tendering July cargo allocations |
| UAE | Exporting via Habshan-Fujairah bypass | Expanding pipeline capacity long-term |
| Iraq (Kurdistan) | ~230,000 bpd resumed | Adding incremental pressure to recovering market |
Iran is leading the rebound in percentage terms primarily because its upstream infrastructure sustained less damage than initially feared and its production shut-in window was comparatively brief. Saudi Arabia and the UAE, which together represent approximately 65% of current regional output, successfully maintained export continuity by routing shipments through pipeline bypass infrastructure rather than through the Strait of Hormuz during the conflict period.
Why the Strait of Hormuz Remains the Defining Variable
Despite the recovery narrative dominating market sentiment, Hormuz throughput currently sits at roughly 32% of its pre-conflict benchmark of approximately 15 mbpd. That translates to around 4.8 mbpd transiting the strait in mid-June, compared to effectively zero at the peak of the disruption. At 32% of normal operations, Hormuz still represents a historically significant supply constraint by any reasonable measure.
The mechanism keeping exports flowing at current levels is storage drawdown. Gulf producers have been running their onshore tank inventories, currently at 50 to 60% of capacity, to sustain export volumes while tanker traffic through Hormuz remained suppressed. This approach has a finite operational window. Current crude oil prices reflect, however, a market that appears to be pricing in a faster resolution than the physical data currently supports.
"If tanker traffic normalisation does not accelerate materially, producers face a binary outcome: throttle output back again or deplete storage buffers to critically low levels. Either path pushes full recovery into 2027 rather than late 2026."
This storage buffer dynamic is one of the least discussed but most consequential near-term variables in global oil supply. A 50 to 60% tank utilisation rate sounds comfortable in isolation, but when viewed against daily drawdown rates needed to sustain current export volumes, the runway narrows considerably. Reporting from QC Intel confirms that Brent has already slipped below pre-war levels as Gulf flows gradually rise.
How US-Iran Diplomacy Pulled the Recovery Timeline Forward
The preliminary agreement reached between the United States and Iran on June 17, 2026 functioned as the diplomatic accelerant that compressed what was previously projected as a mid-2027 full recovery into a potential end-2026 outcome. Washington's subsequent decision to suspend Iranian oil sanctions for a 60-day window created immediate commercial incentives for buyers to position for Iranian crude availability. The oil sanctions impact of such waivers on pricing behaviour has, furthermore, been observed in previous diplomatic cycles.
A specific provision within the waiver permitted purchases of already-loaded Iranian crude through August 21, even before Iranian barrels have physically transited Hormuz. This is a textbook example of forward market pricing outrunning physical reality: futures prices are adjusting to policy signals rather than confirmed volume flows.
Key dimensions of the sanctions waiver and its market implications:
- The 60-day suspension creates a defined recalibration window, after which policy direction must be reaffirmed or reversed
- Buyers positioning for Iranian crude availability before physical delivery confirmation are effectively front-running the supply restoration
- The waiver covers already-loaded cargoes, limiting immediate volume uplift while establishing the policy trajectory
- Long-term Iranian production sustainability carries structural constraints entirely separate from near-term diplomatic progress
Iran's Production Ceiling: A Growth Story With a Structural Asterisk
Iran represents the most dynamic individual production recovery story within the current Gulf rebound, but the longer-term picture carries important caveats that markets may be underpricing.
| Time Horizon | Projected Iranian Output | Primary Enabling Factor |
|---|---|---|
| June 2026 (current) | ~2.4 mbpd | Post-conflict field restart |
| August 2026 | ~3.1 mbpd | Sanctions relief plus field recovery |
| End of 2026 | ~3.3 mbpd | Continued diplomatic progress |
| Post-2027 (conditional) | Potentially above pre-conflict highs | Return of international operators |
The near-term trajectory echoes historical precedent. Following the 2016 nuclear agreement, Iran achieved approximately 1 million barrels per day of incremental production within roughly twelve months, demonstrating that Iranian fields are capable of rapid restart when geopolitical conditions permit.
The structural challenge beyond 2026 is substantially more complex. Iranian upstream reservoirs carry steep natural decline rates that require continuous capital injection and advanced enhanced recovery techniques to offset. Since international oil companies exited Iran in 2018 following the reimposition of US sanctions, domestic contractors have managed field operations. These operators generally lack the financial capacity and technical sophistication required to arrest structural field decline through conventional means.
A return of international operators from 2027 onward, conditional on sustained diplomatic normalisation, represents the primary upside scenario for longer-term Iranian production growth. Without that re-engagement, the production ceiling around 3.3 mbpd may prove difficult to breach sustainably.
Major Bank Forecasts vs. Current Market Pricing
The gap between where Brent is trading and where major institutional analysts believe it should be priced reveals the degree of disagreement currently embedded in the market.
| Institution | Revised Brent Forecast | Recovery Timeline Assumption | Output Restoration by September |
|---|---|---|---|
| Goldman Sachs | US$85/bbl | Partial recovery by Sep, full by early 2027 | Up to 50% of lost output |
| Morgan Stanley | US$90/bbl | Similar medium-term trajectory | Up to 50% of lost output |
| Current Market | ~US$73/bbl | Pricing near-full recovery imminently | Implying faster restoration |
The divergence between current spot pricing and institutional forecasts suggests one of two possibilities: either the major banks are too conservative in their recovery timeline assumptions, or the futures market is pricing in an optimistic scenario that physical Hormuz throughput data does not yet support. Goldman Sachs has cut its oil price forecasts on the basis of faster Gulf supply recovery, however, signalling that even conservative institutions are revising their outlooks downward.
"At 32% of pre-war Hormuz throughput, current physical flows still represent a historically significant supply constraint. The market is behaving as though normalisation is a matter of weeks away, but the infrastructure and geopolitical variables suggest a more extended timeline."
The Bypass Route Revolution: A Structural Shift in Middle East Export Architecture
One underappreciated consequence of the 2026 Gulf conflict is the acceleration of a structural transformation in how Middle Eastern crude reaches global markets. Saudi Arabia and the UAE were both forced to lean heavily on pipeline bypass infrastructure during the period when Hormuz was effectively closed, and both nations have since signalled their intention to maintain elevated bypass route volumes even after the strait fully reopens. Consequently, the OPEC market influence over long-term pricing may itself be recalibrated as bypass capacity expands.
Saudi Arabia's Yanbu terminal on the Red Sea has been handling record export flows of approximately 4.5 mbpd this month, routed through the cross-peninsula East-West Pipeline. The UAE's Habshan-Fujairah pipeline, which connects Abu Dhabi's onshore fields directly to the Gulf of Oman and bypasses Hormuz entirely, is being actively expanded as part of a multi-year capital commitment.
These developments carry a long-term consequence that crude markets have not fully absorbed: the geopolitical risk premium historically embedded in oil prices to account for Hormuz vulnerability is likely to compress structurally as bypass capacity grows. If Saudi Arabia and the UAE can collectively route the majority of their combined output through non-Hormuz pathways, the strait's role as a price-determining chokepoint diminishes over a five to ten year horizon.
The next major ASX story will hit our subscribers first
Three Scenarios for Brent Pricing Through the Rest of 2026
| Scenario | Key Assumptions | Brent Price Implication |
|---|---|---|
| Bull Case | Hormuz normalises slowly; storage depletes; Iran sanctions reimposed | Recovery toward US$85-$90 range |
| Base Case | Gradual Hormuz restoration; Iranian volumes ramp as projected | Stabilisation in US$75-$82 range through Q3 2026 |
| Bear Case | Rapid Hormuz reopening combined with OPEC supply discipline breakdown | Further downside pressure below US$72 |
The variables that will determine which scenario materialises include:
- The pace of Hormuz shipping lane clearance and tanker traffic normalisation
- Whether the 60-day Iranian sanctions waiver is extended, allowed to lapse, or reimposed
- The rate at which Gulf storage buffers deplete relative to Hormuz throughput recovery
- The trade war oil impact on demand projections, which adds further complexity to price modelling
- Confirmation of physical flow volumes, with the US Energy Secretary recently confirming 20 million barrels exiting Hormuz within a single 24-hour period as an indicator of improving throughput
Historical Precedent: Every Major Middle East Shock Has Resolved
Rystad Energy's research draws attention to a consistent pattern across modern energy history: every significant Middle East supply disruption has ultimately resolved with the region not only restoring but eventually surpassing pre-disruption production levels.
| Historical Event | Nature of Disruption | Long-Term Outcome |
|---|---|---|
| Arab Oil Embargo (1973) | Politically motivated export restriction | Region reached new production highs within years |
| Iran-Iraq War (1980s) | Direct conflict damaging infrastructure | Both nations restored and eventually expanded output |
| Invasion of Kuwait (1990) | Rapid military disruption | Regional production surpassed pre-invasion levels |
| 2026 Gulf Conflict | Multi-producer disruption plus Hormuz constraint | Recovery accelerated; full restoration projected end 2026 |
The investment implication of this pattern is not that disruptions are trivial, but that the question markets should be pricing is not whether recovery occurs but how long it takes. The current debate is essentially a timing argument, and it is that timing uncertainty that explains why Brent crude slips as Gulf output recovers quickly in forward pricing terms, sitting roughly US$12 to $17 below where Goldman Sachs and Morgan Stanley believe it should be if their recovery timeline assumptions prove correct.
Key Takeaways for Oil Market Watchers
- Forward pricing vs. physical reality: Brent crude slips as Gulf output recovers quickly in forward market terms, but Hormuz throughput at 32% of pre-war levels still represents a meaningful physical supply gap
- Storage buffer as a hidden clock: The 50 to 60% tank utilisation rate across Gulf producers creates a finite export sustainability window if tanker traffic does not normalise
- Diplomatic acceleration: The US-Iran June 17 preliminary agreement pulled the full recovery timeline forward by approximately one quarter
- Bypass infrastructure as a structural shift: Saudi and UAE pipeline route commitments are reducing long-term Hormuz dependency in ways that will compress the geopolitical risk premium over time
- Iranian production ceiling: Near-term growth to approximately 3.3 mbpd is credible; sustainable long-term growth beyond that level requires international operator re-engagement from 2027
- Institutional vs. market divergence: A US$12 to $17 gap between current spot prices and major bank forecasts reflects genuine uncertainty about recovery timing rather than a fundamental disagreement about the eventual outcome
Readers seeking ongoing coverage of upstream developments, regional supply dynamics, and global energy market analysis can explore related industry reporting at Petroleum Australia.
Want to Capitalise on the Next Major Resource Discovery Before the Broader Market?
Discovery Alert's proprietary Discovery IQ model delivers real-time alerts on significant ASX mineral discoveries, transforming complex resource data into actionable investment insights for both short-term traders and long-term investors — explore the historic returns major discoveries have generated and begin your 14-day free trial at Discovery Alert to position yourself ahead of the market.