
June 25, 2026
When Chokepoints Become Crisis Points: Understanding the 2026 Hormuz Shock
Energy markets are built on the assumption that critical infrastructure will remain accessible. When that assumption breaks down, the consequences ripple far beyond the immediate geography of conflict. The global oil trading system has evolved over decades around a series of maritime passages that concentrate enormous volumes of seaborne energy into narrow navigable corridors. Of all these corridors, none carries a heavier burden than the Strait of Hormuz.
What distinguishes the 2026 disruption from prior Hormuz crises is not the scale of diplomatic tension or the rhetoric exchanged between adversaries. It is the physical confirmation that the corridor has effectively stopped functioning. The Brent crude surge over the Strait of Hormuz blockade is no longer responding to scenarios — it is responding to reality, as daily tanker transits through a passage that normally handles a significant share of global seaborne crude have fallen to single digits.
When big ASX news breaks, our subscribers know first
The Strait of Hormuz: The World's Most Consequential 33 Kilometres
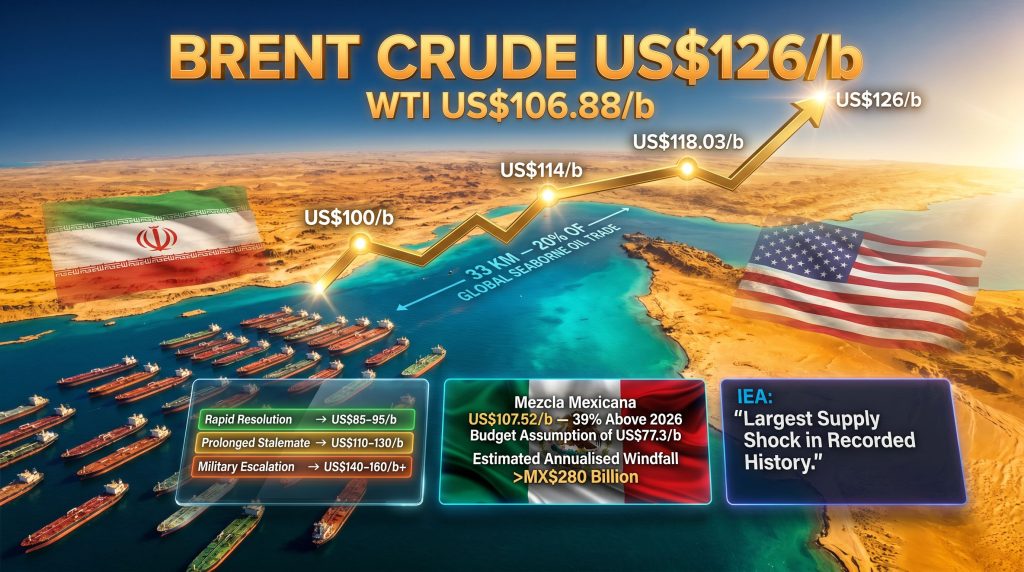
The Strait of Hormuz connects the Persian Gulf to the Gulf of Oman and, beyond it, the broader Indian Ocean trading system. Under normal operating conditions, approximately 17 to 21 million barrels of crude oil and petroleum products transit this passage daily, representing roughly 20% of global seaborne oil trade. An equivalent share of global liquefied natural gas exports passes through the same corridor.
The strategic concentration this creates is without parallel in the global energy system. Unlike most supply constraints, which affect individual producing nations or regional refining hubs, a Hormuz closure simultaneously disrupts crude exports from Iran, Iraq, Kuwait, Saudi Arabia, the UAE, Bahrain, and Qatar. The IEA has classified the disruption generated by the 2026 dual blockade as the largest supply shock in recorded history, a designation that reflects not just the volume involved but the breadth of producers affected.
A Hormuz closure is not a regional supply problem. It is a restructuring of the entire global energy pricing architecture, affecting spot markets, futures curves, refinery feedstock costs, and downstream consumer prices simultaneously.
Why Prior Crises Did Not Produce This Outcome
The Strait of Hormuz has been threatened, contested, and partially disrupted on multiple occasions across the past four decades. During the Tanker War of the 1980s, Iranian and Iraqi forces targeted commercial shipping with intermittent success, triggering price volatility but never eliminating physical transit entirely. The 2012 sanctions era prompted repeated Iranian rhetorical threats to close the strait, generating risk premiums that faded as diplomatic frameworks absorbed the tension. The 2019 tanker seizures created acute volatility spikes that dissipated within weeks.
Each of these events shared a common structural feature: disruption remained partial or speculative. The 2026 scenario is categorically different because physical transit volumes did not merely decline — they collapsed to single-digit daily crossings, converting what had historically been priced as a crude oil price trends risk premium into a confirmed, measurable supply shortage.
| Historical Event | Nature of Disruption | Price Impact | Duration |
|---|---|---|---|
| 1980s Tanker War | Intermittent vessel targeting | Elevated but variable | Multi-year |
| 2012 Sanctions Era | Rhetorical closure threats | Risk premium; faded quickly | Months |
| 2019 Tanker Seizures | Selective detentions | Acute spike; recovered within weeks | Short-term |
| 2026 Dual Blockade | Physical transit collapse to single digits | Brent above US$126/b | Ongoing as of May 2026 |
How the 2026 Crisis Escalated: From Airstrikes to Dual Blockade
The sequence of events that produced the current Brent crude surge over the Strait of Hormuz blockade began in late February 2026, when Iran closed the strait in direct response to US-Israeli military strikes and the death of Supreme Leader Ali Khamenei. The initial closure was followed swiftly by a market response that pushed Brent crude above US$100 per barrel for the first time in the current cycle on March 8, 2026.
The crisis entered a structurally new phase on April 13, 2026, when the United States imposed a naval blockade of Iranian ports. This created what analysts have described as a dual-blockade scenario: Iran blocking outbound commercial transit through the strait from the south, and the US restricting Iranian port access from the north. Together, the two measures eliminated an estimated 10 million barrels per day of throughput capacity and halted more than 90% of normal shipping volumes through the corridor.
The Diplomatic Collapse That Cemented the Price Surge
Face-to-face negotiations between Washington and Tehran stalled through late April. On April 17, 2026, Iran offered a conditional reopening of the strait tied to a Lebanon ceasefire agreement. This diplomatic signal triggered an 11% single-session decline in crude prices, demonstrating just how acutely sensitive markets had become to any resolution pathway. The US rejected the proposal, maintaining the blockade as its primary leverage instrument in nuclear negotiations.
That rejection produced a swift reversal. Prices climbed back toward and beyond US$114/b as market participants abandoned the resolution scenario and began treating prolonged closure as the base case. US President Donald Trump publicly characterised the pressure campaign in terms that left no ambiguity about Washington's intent, describing Iran as being squeezed and asserting that the country could not be permitted to develop a nuclear weapon. Speaking to Axios, Trump conveyed that the pressure would continue to intensify rather than relent.
Brent Crude Price Chronology: The 2026 Escalation in Numbers
| Date / Event | Brent Crude Level | Primary Driver |
|---|---|---|
| March 8, 2026 | Above US$100/b | Initial dual-blockade fears |
| March 2026 Peak | US$126/b | Acute physical supply shortage |
| March 23, 2026 | US$102/b | Brief negotiation optimism |
| March 27, 2026 | US$114/b | Talks collapse; strait remains closed |
| April 17, 2026 | -11% single session | Iran's conditional reopening offer |
| April 29, 2026 | US$118.03/b (close) | Sustained supply shock baseline |
| April 30, 2026 | US$126/b (intraday) | Blockade extension; peace talks stall |
Why the Brent Crude Surge Is Different From Previous Oil Price Spikes
Oil market participants have developed a well-established playbook for geopolitical risk events. The typical sequence runs: military or diplomatic escalation, an initial price spike embedding a risk premium, early signs of negotiation or de-escalation, and then a gradual unwinding of that premium as the physical market proves more resilient than feared. This cycle has repeated itself reliably enough that it has become the dominant mental model used by traders and analysts when responding to Middle East tensions.
The 2026 disruption has, however, broken that model. Neil Wilson, Strategist at Saxo Bank, described the market's transition as a shift away from hoping for resolution toward fixating on physical scarcity and the long-term threat to supply, with the possible escalation of conflict introducing an entirely new dimension of uncertainty. This characterisation reflects the core structural difference between speculative risk pricing and confirmed physical scarcity: tanker transits have not merely slowed — they have functionally stopped.
Vandana Hari, Founder of Vanda Insights, framed the pricing outlook in similarly direct terms, noting that prices have nowhere to go but up until a permanent reopening of the strait comes into view, while acknowledging that the timing and mechanism for such an outcome remains entirely unclear. Both assessments, cited by CNN on April 30, 2026, point toward the same structural conclusion. Furthermore, these perspectives align with broader oil and geopolitics analysis that has long flagged Hormuz as the system's most critical single point of failure.
Goldman Sachs Revised Forecasts and the Limits of Consensus Modelling
Goldman Sachs revised its Q4 2026 Brent crude target to US$90/b and its WTI target to US$83/b in the days before April 30. The bank simultaneously warned that massive Middle East production losses were driving global oil inventories lower at a pace that existing models had not anticipated.
Goldman's upward revision to US$90/b for Q4 2026 Brent, which was framed as a bullish call at the time of publication, was overtaken intraday on April 30 by a price move to US$126/b. This gap between consensus modelling and physical market reality is itself a signal: traditional forecasting frameworks are systematically underestimating the persistence of disruption when physical supply is genuinely constrained.
This underestimation risk is not unique to Goldman Sachs. It reflects a broader challenge in oil price modelling during genuine supply shocks: historical calibration periods include few events of comparable magnitude, which causes models to revert toward mean pricing assumptions faster than the physical market actually justifies.
The OPEC Structural Wildcard: UAE Departure and Supply Coordination Collapse
The UAE formally exited OPEC effective May 1, 2026, removing approximately 4.8 million barrels per day of production capacity from the group's coordination framework. The timing could not be worse from a market stability perspective. In addition, OPEC's market influence — already under pressure from internal disagreements — has been significantly diminished by this departure at the worst possible moment.
OPEC's core function during supply disruptions is to signal flexible production capacity that can partially offset losses elsewhere. That signalling function depends on member cohesion and the credibility of collective output commitments. The UAE's departure fragments the cartel's unified response capacity at precisely the moment when Middle East production losses are accelerating inventory drawdowns across global storage facilities.
The structural implications extend beyond immediate supply volumes:
- OPEC's remaining members hold less spare capacity than the UAE exit implies on paper
- Coordination between Gulf producers outside the OPEC framework is untested at this scale
- Markets may price in a higher risk premium for future supply disruptions given reduced cartel buffering capacity
Cascade Effects: How the Hormuz Blockade Reaches Beyond Crude Oil
The most visible consequence of the Brent crude surge over the Strait of Hormuz blockade is the crude oil price itself. However, the second-order effects across adjacent markets are equally significant and, in some cases, more directly damaging to the global consumer economy.
LNG Markets and the Natural Gas Transmission Mechanism
Approximately 20% of global LNG volumes transit the Strait of Hormuz, meaning the same physical disruption that has constrained crude oil flows has simultaneously tightened natural gas markets. The LNG supply outlook has deteriorated sharply as a consequence, with the two commodity systems linked at the source but diverging in their downstream transmission pathways.
Higher natural gas prices feed directly into ammonia production costs, since natural gas is the primary feedstock for the Haber-Bosch synthesis process used to manufacture nitrogen fertilisers. As fertiliser costs rise, agricultural input costs follow, creating a food price inflation impulse that extends the energy market disruption far beyond the refinery gate and into supermarket pricing. This transmission mechanism disproportionately affects import-dependent emerging market economies that lack the fiscal buffers to absorb simultaneous energy and food price increases.
Tanker Market Disruption and the Hidden Capacity Cost
With transits through Hormuz reduced to single digits, vessel operators are rerouting crude cargoes around the Cape of Good Hope, adding approximately 10 to 14 days to voyage durations between the Persian Gulf and European or Asian destination ports. This extended sailing time creates a hidden tightening effect on global tanker availability.
A tanker completing one round trip every 60 days completes roughly six voyages per year. Add 14 days each way to that voyage, and the same vessel completes fewer than four annual voyages, effectively removing 30% of that hull's annual carrying capacity from the market without a single ship being damaged or detained. Aggregated across the hundreds of VLCCs (Very Large Crude Carriers) normally serving Gulf routes, this routing displacement generates a meaningful effective reduction in global crude transport capacity.
Spot freight rates for VLCCs have surged in response as alternative corridor demand concentrates on routes that were not designed to absorb the full volume of Gulf export flows.
Military Escalation Risk as a Price Floor
Reports have emerged of US military deliberations regarding the potential deployment of long-range hypersonic missiles to the region, with the stated objective of targeting ballistic missile infrastructure embedded within Iranian territory. Goldman Sachs referenced this escalation risk explicitly in its April 30 analysis. Whether or not such deployment occurs, the market is pricing in a non-trivial probability that military escalation could further complicate any diplomatic pathway to strait reopening, effectively establishing a floor on crude prices that rises with each failed negotiation round.
Mexico's Fiscal Position: The Windfall and Its Cost
Few countries outside the Middle East carry a more direct fiscal exposure to crude oil price movements than Mexico. The Mezcla Mexicana de Exportación, Mexico's benchmark export blend, closed at US$107.52/b on April 29, 2026, its highest level since June 2022.
The Revenue Arithmetic
The Ministry of Finance's official 2026 budget crude price assumption stood at US$77.3/b. At US$107.52/b, the Mezcla Mexicana was trading at a 39% premium to that assumption. Mexico's own pre-criteria framework for 2027 budgeting estimates that each additional US$1 per barrel in crude prices generates approximately MX$9.6 billion in additional petroleum revenues.
| Metric | Value |
|---|---|
| 2026 Budget Crude Assumption | US$77.3/b |
| Mezcla Mexicana Close (April 29) | US$107.52/b |
| Premium Above Budget | ~39% |
| Additional Revenue Per US$1/b | ~MX$9.6 billion |
| Estimated Annualised Windfall | >MX$280 billion |
| Weekly IEPS Fuel Subsidy Cost | ~US$280 million |
On an annualised basis, the implied revenue windfall relative to the budget assumption exceeds MX$280 billion, a figure that represents one of the largest unplanned fiscal transfers in Mexico's recent oil revenue history.
The Subsidy Dilemma Beneath the Windfall
The crude price windfall does not arrive without a concurrent fiscal cost. Mexico has been deploying its IEPS (Impuesto Especial sobre Producción y Servicios) mechanism to cap domestic retail fuel prices since the conflict began in February, spending approximately US$280 million per week to maintain those caps.
President Claudia Sheinbaum has stated publicly that without IEPS intervention, Magna gasoline would currently be priced near MX$32/L and diesel between MX$35 and MX$36/L. Current retail price ceilings are held at MX$24/L for Magna and MX$28/L for diesel, a gap of MX$7 to MX$10 per litre that the federal government is absorbing directly through the subsidy mechanism.
The fiscal tension is real but manageable in the near term. The annualised crude windfall of more than MX$280 billion substantially outpaces the current weekly IEPS expenditure rate. However, the subsidy programme's open-ended structure creates exposure if elevated prices persist beyond Q3 2026, since the cost scales with duration rather than intensity alone.
The next major ASX story will hit our subscribers first
Investor and Market Positioning: Scenarios and Sector Implications
The Brent crude surge over the Strait of Hormuz blockade has created a bifurcated investment landscape. Positions that benefit from sustained high crude prices are producing outsized returns, while sectors with structural exposure to elevated energy input costs are facing compressing margins and rising equity risk premiums. Consequently, these oil market disruptions are reshaping capital allocation strategies across the broader energy investment universe.
Three Price Trajectories for Brent Crude
| Scenario | Trigger Condition | Brent Crude Trajectory |
|---|---|---|
| Rapid Resolution | Strait reopens within 30 to 60 days; nuclear framework agreed | Sharp reversal toward US$85 to US$95/b |
| Prolonged Stalemate | Blockade maintained; no diplomatic breakthrough | Sustained trading range of US$110 to US$130/b |
| Military Escalation | US strikes on Iranian infrastructure; full strait closure | Potential spike toward US$140 to US$160/b+ |
This scenario analysis is illustrative and should not be construed as financial advice. Oil price forecasting during active geopolitical crises carries exceptionally high uncertainty, and actual outcomes may deviate materially from any modelled range.
Sectoral Winners and Pressure Points
Sectors positioned to benefit from sustained elevated prices:
- Upstream oil producers with production exposure outside the Middle East corridor
- LNG exporters operating under long-term contracted volume agreements
- Tanker operators routing via Cape of Good Hope alternatives
- Refinery operators with access to diversified crude feedstock sources
Sectors facing structural pressure:
- Petrochemical manufacturers dependent on Middle East feedstock supplies
- Airlines absorbing sustained jet fuel cost inflation into fare structures
- Nitrogen fertiliser producers exposed to elevated natural gas input pricing
- Emerging market economies with high energy import dependency and limited fiscal buffers
What the Goldman Sachs Forecast Gap Tells Investors
The speed with which Goldman Sachs's revised US$90/b Q4 2026 Brent target was surpassed by physical market pricing is instructive for capital allocation decision-making. Consensus price decks produced by major banks tend to anchor to prior disruption durations and historical mean reversion patterns. When a disruption is genuinely structural rather than rhetorical, those anchors pull forecasts below the level that the physical market actually clears.
Investors using consensus price decks as the basis for capital allocation across energy portfolios face material valuation risk if the stalemate extends into Q3 or Q4 2026. The appropriate response is not to extrapolate current spot prices indefinitely, but to weight scenario ranges more heavily toward the prolonged stalemate case and maintain sufficient optionality to capture resolution-driven corrections when they eventually occur.
The Structural Vulnerabilities the 2026 Crisis Has Exposed
Beyond the immediate price dynamics, the Brent crude surge over the Strait of Hormuz blockade has surfaced a set of structural vulnerabilities in the global energy architecture that years of diversification rhetoric had obscured without resolving.
Key structural exposures confirmed by the 2026 crisis:
- Global energy security remains critically dependent on a single maritime passage that has no fully operational alternative
- Existing strategic petroleum reserve frameworks were designed around shorter-duration disruptions and may prove inadequate for multi-month closures
- OPEC's capacity to buffer supply shocks through production coordination is structurally weakened by the UAE's departure
- Consensus forecasting models systematically underestimate price persistence during confirmed physical supply disruptions
- The cascade from crude oil into LNG, fertilisers, and food prices reveals transmission channels that energy security planning has historically under-weighted
The longer-term policy response is likely to include renewed investment in overland pipeline alternatives (including the UAE's Abu Dhabi Crude Oil Pipeline, which has partial bypass capacity), a reassessment of IEA member strategic reserve adequacy, and an acceleration of energy transition investment framed explicitly as a supply security hedge rather than solely an environmental programme.
Whether the 2026 disruption produces lasting structural change in how the global energy system manages Hormuz concentration risk depends on factors that extend far beyond oil markets. But its consequence is already clear: the theoretical vulnerability that analysts had long identified has become a practised reality, and the world's most important 33 kilometres has never carried a higher price.
This article is for informational purposes only and does not constitute financial, investment, or trading advice. Oil price forecasts and scenario projections referenced herein involve significant uncertainty. Readers should consult qualified financial advisors before making investment decisions based on commodity market developments.
Want to Capitalise on the Market Opportunities Created by Major Energy Disruptions?
Discovery Alert's proprietary Discovery IQ model delivers real-time alerts on significant ASX mineral discoveries — including those tied to commodities reshaped by geopolitical supply shocks like the 2026 Hormuz crisis — ensuring subscribers can identify actionable opportunities ahead of the broader market. Explore why historic discoveries generate substantial returns on Discovery Alert's dedicated discoveries page, and begin your 14-day free trial today to position yourself ahead of the next major market move.