July 19, 2026
The Futures Market as a Crystal Ball: How Oil Traders Price Scenarios Before They Happen
There is a fundamental truth about commodity futures markets that casual observers frequently misunderstand: prices rarely move because of what has already happened. They move because of what traders collectively believe will happen next. This distinction sits at the heart of understanding why Brent crude falls as Strait of Hormuz tanker traffic resumes with a force that appears disproportionate to the modest physical volumes actually transiting the waterway.
When a single chokepoint controls access to roughly one-fifth of all globally traded oil, the gap between perception and reality becomes a tradeable asset in itself. The compression of that gap, as geopolitical risk premiums deflate, can generate price dislocations just as violent as the original shock that created them.
When big ASX news breaks, our subscribers know first
The Strait of Hormuz: Why 33 Kilometres Can Move Global Energy Prices by Billions
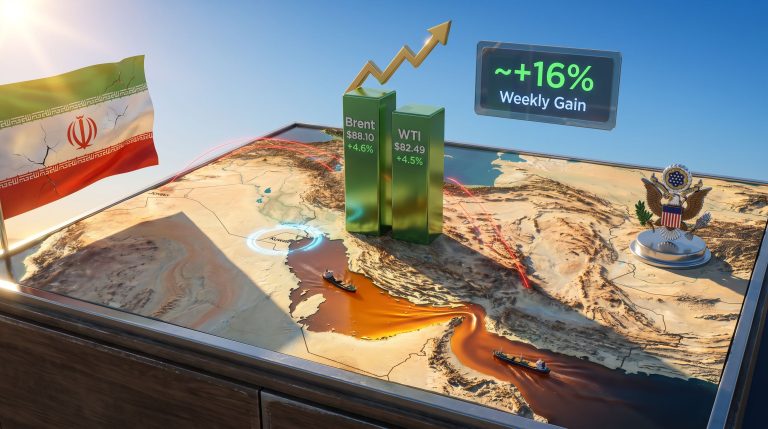
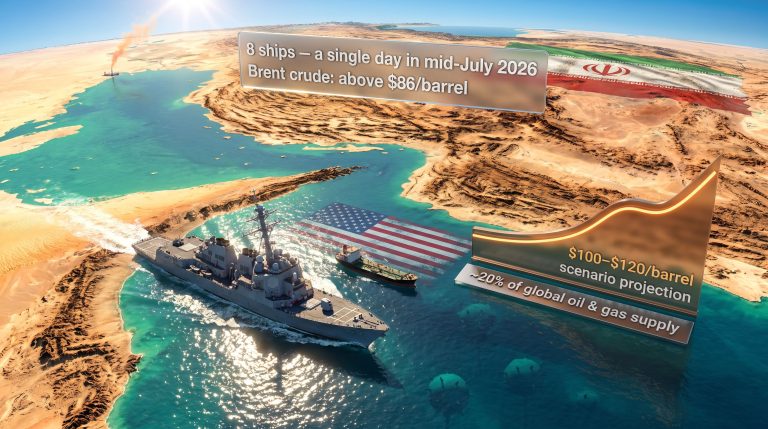
Few geographic features carry the macroeconomic weight of the Strait of Hormuz. Bordered by Iran to the north and Oman and the UAE to the south, this narrow passage connecting the Persian Gulf to the Gulf of Oman represents an effectively irreplaceable maritime corridor. Under normal operating conditions, approximately 20% of globally traded oil moves through this waterway, underpinned by roughly 125 vessel crossings per day.
The strait's unique vulnerability lies not just in its width, approximately 33 kilometres at its narrowest navigable point, but in the absence of adequate alternative infrastructure. While bypass options exist, including the Abu Dhabi Crude Oil Pipeline and Saudi Arabia's East-West Pipeline (Petroline), their combined capacity falls well short of replacing full Hormuz throughput. This structural dependency means that any disruption triggers an immediate repricing of risk across global crude benchmarks.
How Geopolitical Risk Premiums Are Built Into Crude Pricing
The concept of a geopolitical risk premium refers to the portion of a crude benchmark price that exceeds what pure supply-demand fundamentals would justify. When conflict threatens Hormuz access, futures traders effectively embed an insurance cost into forward contracts, a premium reflecting the probability of supply disruption multiplied by its severity. Furthermore, understanding geopolitical tensions is essential to grasping why these premiums inflate so rapidly during regional crises.
From late February 2026 onward, following US-Israeli strikes on Iran, this premium inflated Brent pricing materially above its fundamental equilibrium. The inverse relationship is equally powerful: as tanker traffic begins to normalise and the probability of sustained closure declines, that embedded premium compresses, pulling benchmark prices lower even when physical supply volumes have not actually changed.
This dynamic explains a counterintuitive reality. Markets can fall sharply on good news, specifically the resumption of shipping, because the risk insurance that was baked into prices is now being unwound at speed.
What the Numbers Behind Brent's June 2026 Sell-Off Actually Reveal
The price action on June 25, 2026 was not an incremental adjustment. It was a structural repricing event.
| Metric | Value |
|---|---|
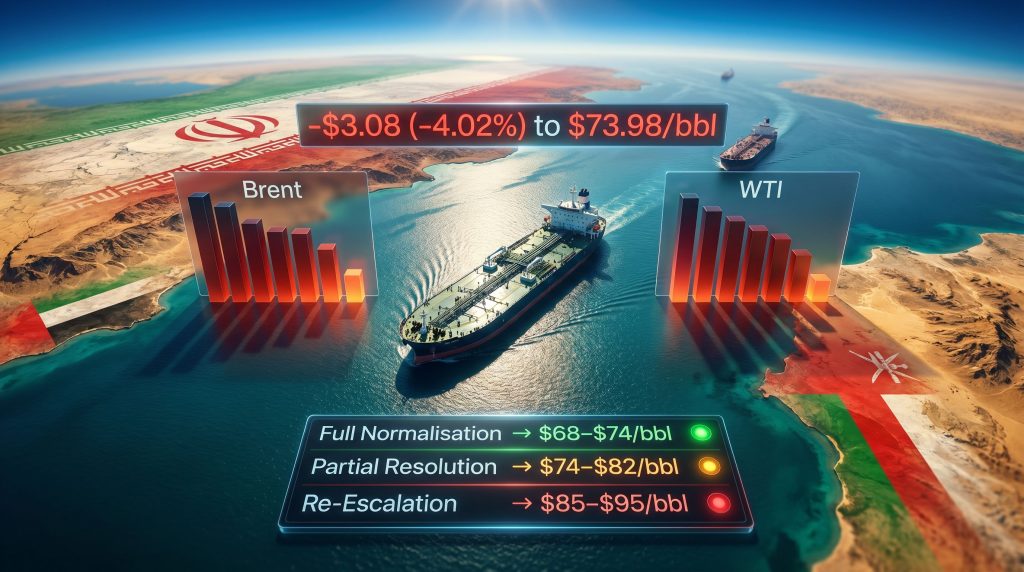
| Brent Crude futures decline (June 25, 2026) | -$3.08 (-4.02%) to $73.98/bbl |
| Brent intraday low (June 25, 2026) | $73.22/bbl |
| Lowest Brent level since | February 27, 2026 (pre-US-Israeli strikes on Iran) |
| WTI futures decline (June 25, 2026) | -$3.13 (-4.06%) to $73.95/bbl |
| WTI earlier session low | Below $70.00/bbl (lowest since March 2, 2026) |
| Brent decline (June 22, 2026 session) | -0.3% to $77.70/bbl |
| WTI decline (June 22, 2026 session) | -$0.12 (-0.2%) to $73.74/bbl |
| Tanker cargo volume resuming transit | ~2 million barrels across two vessels (June 23, 2026) |
| Strait daily transit recovery rate | Approaching 30 transits/day vs. ~125 pre-conflict baseline |
Critical Context: The 2 million barrels that transited on June 23, 2026 represent less than 1.6% of the strait's pre-conflict daily throughput capacity. The market's multi-dollar reaction was not proportional to the physical volumes involved. Instead, it reflected a collective forward-pricing of full Iranian crude re-entry at scale.
The significance of WTI briefly breaching $70 per barrel extends beyond chart technicals. This threshold represents a widely recognised psychological support level for US shale producers. Many operators in high-cost basins such as the Permian's outer tiers and parts of the Bakken carry breakeven costs that begin clustering in the $55-$70 range. A sustained sub-$70 WTI environment would pressure marginal US production economics meaningfully.
Similarly, a Brent price held below $75 per barrel creates fiscal stress for multiple OPEC+ members. Saudi Arabia's fiscal breakeven has been estimated by the IMF at approximately $80-$85 per barrel in recent years, meaning the current price environment, if sustained, creates budget shortfalls that place pressure on the cartel's production discipline framework. In addition, OPEC's market influence over global supply decisions becomes considerably more constrained when Iranian volumes begin re-entering the picture.
Is the Strait of Hormuz Truly Open? Reading the Conflicting Signals
One of the most analytically important dynamics in the current environment is the divergence between what vessel-tracking data shows and what state-aligned media sources assert. This dual-narrative structure is itself a market-moving variable.
Vessel-tracking intelligence confirmed that two tankers carrying approximately 2 million barrels completed transit on June 23, 2026. Daily crossing activity was recovering toward roughly 30 transits per day, a notable improvement from the near-complete stoppage at peak conflict intensity. Yet Iranian media sources, including Tasnim News Agency, continued to characterise the strait as effectively restricted due to ongoing regional hostilities and Israeli operations in Lebanon.
This information asymmetry creates a specific challenge for energy traders. When official political messaging contradicts observable physical data, market participants must assign probability weights to competing scenarios rather than trading on confirmed facts. The result is amplified volatility as new data points arrive and those probabilities are continuously recalibrated. Consequently, crude oil price trends in this environment are as much a function of information quality as they are of physical supply.
The 60-Day MOU Window and Its Hidden Structural Risk
Perhaps the least discussed but most consequential detail in the current Hormuz situation is the architecture of the US-Iran Memorandum of Understanding governing transit rights. The agreement reportedly guarantees toll-free passage for a fixed 60-day window only. Beyond that period, Iran retains the legal ability to impose navigation, environmental, and security-related fees on vessels transiting the waterway.
This creates a structural countdown that markets have not yet fully priced. The stakes are significant:
- Gulf states including Qatar, Kuwait, Bahrain, and the UAE are expected to collectively resist any fee-based access regime as a matter of both economics and sovereignty
- Iran may seek to institutionalise access surcharges framed as environmental or security levies, providing political cover for what is effectively a sovereign revenue mechanism
- The diplomatic architecture required to resolve this question permanently is far more complex than simply reopening tanker lanes
Warning for Energy Investors: If permanent governance arrangements for the Strait of Hormuz are not formalised before the 60-day MOU window expires, markets could reprice geopolitical risk premiums sharply upward, potentially reversing the entire current bearish trajectory.
Why Markets Are Pricing Iranian Oil Re-Entry Before a Single Sanctioned Barrel Moves
A sophisticated understanding of how oil futures markets function reveals a critical insight: futures prices are not a record of what has happened, they are a probabilistic map of what traders expect to happen. The June 2026 sell-off in Brent reflects this mechanism operating at full force.
Iran possesses significant shut-in production capacity that could be mobilised relatively quickly once sanctions waivers, logistics, and insurance frameworks normalise. Historically, Iran produced in excess of 3.8 million barrels per day at peak output levels, though current estimates suggest sanctioned production running substantially below that figure. The market is pre-emptively discounting the anticipated addition of this capacity to global supply, even before a formal sanctions waiver framework is confirmed.
Analysts at ING noted that the gradual increase in oil flows through the strait continued to weigh on market sentiment, confirming that even incremental transit recovery carries sufficient forward-looking signal to sustain bearish price momentum. According to reporting from Business Times, this bearish momentum across the futures curve reflects broad market consensus around Hormuz normalisation.
Tim Waterer of KCM Trade characterised early tanker activity as encouraging but framed the broader market interpretation as a full-scenario pricing exercise, encompassing both Hormuz normalisation and Iranian crude re-entry as a combined supply-side development rather than two separate events.
OPEC+ in a Bind: Cartel Discipline vs. Returning Iranian Barrels
The prospective re-entry of Iranian crude creates a structural dilemma for OPEC+ that deserves careful attention:
- Iran's production has historically operated outside formal OPEC+ quota frameworks due to sanctions, meaning its return adds supply without requiring quota adjustments from other members
- Gulf member states that sustained Iranian missile strikes during the conflict, particularly Kuwait and Bahrain, have political motivations that may complicate cooperative responses within the cartel architecture
- A sustained sub-$75 Brent environment may trigger emergency OPEC+ discussions, but the credibility of any production cut commitment is undermined if Iranian volumes simultaneously expand
- Saudi Arabia, as the cartel's swing producer, faces the most acute tension between defending price floors and managing its relationship with a post-conflict Iran
The Diplomatic Architecture Reshaping Oil Price Trajectories
US Secretary of State Marco Rubio's regional tour covering the UAE, Kuwait, and Bahrain represents Washington's effort to build allied consensus around a proposed Iran peace framework. The substance of that framework matters enormously for oil market outcomes. However, the trade war impact on oil pricing adds another layer of complexity to an already fraught diplomatic environment.
The proposed accord reportedly includes a $300 billion economic fund for Iran alongside partial sanctions relief. Gulf states, many of which experienced direct Iranian missile strikes resulting in civilian casualties and significant economic damage, view these terms as disproportionately generous to Tehran. This scepticism reflects genuine security concerns from nations that host critical US military infrastructure and bear lasting conflict damage.
Rubio's meeting with UAE President Sheikh Mohammed bin Zayed Al Nahyan signals Washington's recognition that Gulf sovereign buy-in is not optional but foundational to any durable regional peace architecture.
Lebanon: The Hidden Variable That Could Reignite Hormuz Risk
Israeli Defence Minister Israel Katz stated explicitly on June 25, 2026 that Israeli forces were not withdrawing from southern Lebanon and that no American demand for such a withdrawal had been made. This position represents a direct obstacle to the comprehensive regional ceasefire that markets are implicitly pricing into the current Brent trajectory.
Iran's parliament speaker Mohammad Baqer Qalibaf, speaking in Baku, explicitly linked a Lebanon ceasefire to an Iran ceasefire, framing the two theatres as inseparable in Tehran's strategic calculus. This linkage has a direct implication for energy markets: any re-escalation in Lebanon could rapidly re-elevate Hormuz transit risk, snapping the risk premium back into Brent futures with significant force.
Washington-backed talks between Lebanon and Israel on a territorial handover framework to Lebanese army control remained unresolved as of late June 2026.
The Oman-Qatar Governance Track: More Important Than It Appears
Qatari Prime Minister Sheikh Mohammed bin Abdulrahman al-Thani visited Muscat on June 25, 2026 for direct talks with Omani counterparts on initiating formal Hormuz governance negotiations. This diplomatic track deserves more analytical attention than it has received.
Oman's role as a structurally non-aligned Gulf state with longstanding back-channel access to Tehran makes it uniquely positioned as a mediator. The core negotiating tension is straightforward: Gulf states will push for unconditional, fee-free transit rights as a baseline condition, while Iran may seek to institutionalise access fees under the framing of environmental and security management.
The resolution of this governance question, not the resumption of tanker traffic, is the genuine long-term determinant of oil price stability in the region.
The next major ASX story will hit our subscribers first
Sector-by-Sector Impact: Who Wins and Who Loses When Brent Falls Below $75
| Stakeholder | Impact of Sub-$75 Brent | Severity |
|---|---|---|
| US shale producers | Margin compression; marginal operators approach breakeven | High |
| OPEC+ member fiscal budgets | Revenue shortfall vs. breakeven thresholds | Medium-High |
| Asian crude importers (India, China) | Reduced import bills; improved trade balances | Positive |
| Global shipping and tanker operators | Normalising freight rates; declining war-risk premiums | Positive |
| European energy consumers | Lower refined product prices; inflation relief | Positive |
| Iran (if sanctions partially lifted) | Higher export volumes partially offset lower per-barrel prices | Mixed |
| Gulf sovereign wealth funds | Portfolio rebalancing required at sustained lower prices | Medium |
Indian refiners represent a particularly important case study within this framework. As major buyers of discounted Middle Eastern crude, Indian refining operations stand to benefit from both lower input costs and restored Hormuz access simultaneously. Complex refinery configurations in India are optimised to process heavier Middle Eastern grades, meaning restored supply flow directly translates to improved processing economics.
There is an important lag dynamic to account for: crude price declines typically take four to eight weeks to flow through into retail fuel price adjustments in major consuming markets, creating a delayed but meaningful disinflationary effect in economies like India, which remain significantly exposed to crude import costs.
Three Scenarios for Brent Pricing Through Q3 2026
| Scenario | Key Assumptions | Brent Price Range Implication |
|---|---|---|
| Full Normalisation | Permanent Hormuz governance agreed; Iranian sanctions partially lifted; Lebanon ceasefire holds | $68-$74/bbl; sustained bearish pressure |
| Partial Resolution | 60-day MOU extended; transit fees disputed; Lebanon talks stall | $74-$82/bbl; range-bound with volatility spikes |
| Re-Escalation | Lebanon conflict expands; Hormuz access restricted or fees imposed | $85-$95/bbl; sharp risk premium reinstatement |
Key Variables to Monitor for Oil Price Direction
Understanding oil price movements in the months ahead will require careful attention to several interconnected variables:
- Progress of Israel-Lebanon territorial withdrawal negotiations in Washington
- Formal governance framework talks involving Qatar, Oman, and Iran regarding permanent Hormuz management
- OPEC+ emergency meeting triggers if Brent sustains below $72 per barrel
- US Congressional response to Iran sanctions waiver provisions embedded in the proposed peace accord
- Iranian crude export volume data as a leading indicator of actual supply-side pressure building in the physical market
- Vessel-tracking data showing daily Hormuz transit counts relative to the 125-crossing pre-conflict baseline
Frequently Asked Questions: Brent Crude, the Strait of Hormuz, and the Iran Conflict
Why did Brent crude fall so sharply in June 2026?
Brent crude falls as Strait of Hormuz tanker traffic resumes because markets interpreted even modest vessel movements as the beginning of a broader process involving Iranian crude re-entering global supply chains. This compressed the geopolitical risk premium that had been embedded in Brent pricing since the conflict began in late February. The decline exceeded $3 per barrel on June 25, 2026, reaching its lowest level since February 27, 2026.
How much oil flows through the Strait of Hormuz?
Under normal conditions, approximately 20% of globally traded oil transits the Strait of Hormuz, supported by roughly 125 vessel crossings per day. By late June 2026, transit activity had recovered to approximately 30 crossings per day, representing less than one-quarter of the pre-conflict baseline.
Is the Strait of Hormuz fully open again?
The situation remained contested as of late June 2026. Vessel-tracking data confirmed tanker movements resuming with approximately 2 million barrels transiting on June 23, 2026. However, Iranian media characterised the strait as still effectively restricted. The US-Iran MOU guarantees toll-free passage for only 60 days, leaving long-term governance unresolved. Mining Weekly's coverage of the supply resumption provides additional context on the pace of recovery.
What is the proposed Iran peace deal, and why are Gulf states sceptical?
The proposed accord reportedly includes a $300 billion economic fund for Iran and partial sanctions relief. Gulf states that sustained Iranian missile strikes during the conflict view these terms as excessively favourable to Tehran, creating diplomatic friction that US Secretary of State Rubio's regional tour is attempting to address.
What happens to oil prices if the Strait of Hormuz closes again?
A renewed closure would rapidly reinstate geopolitical risk premiums across Brent and WTI pricing. The scale of any price spike would depend on closure duration, OPEC+ spare capacity deployment speed, and the utilisation of alternative routing via the Abu Dhabi Crude Oil Pipeline and Saudi Arabia's East-West Pipeline.
Brent's Decline Is a Diplomatic Probability Score, Not Just a Supply Event
The most important analytical frame for understanding the June 2026 Brent sell-off is not supply and demand. It is probability assignment. Every dollar of decline in crude benchmarks represents a marginal increase in market confidence that Hormuz will remain open, that Iranian barrels will eventually flow, and that the conflict premium embedded since February will not be needed again.
The 60-day MOU governance window, unresolved Lebanon dynamics, Gulf state scepticism toward the proposed Iran accord, and the absence of a permanent Hormuz management framework collectively define the risk envelope within which oil will trade through Q3 2026. Each of these variables carries the capacity to independently reverse the current bearish trajectory.
For long-term energy security planners across major importing nations, including India, China, Japan, and South Korea, the deeper lesson is structural. Hormuz governance risk can no longer be treated as an episodic disruption variable. It has become a permanent portfolio consideration requiring scenario-based hedging frameworks that account for both normalisation and re-escalation pathways simultaneously.
Disclaimer: This article contains forward-looking scenario analysis and market commentary. Nothing in this article constitutes financial or investment advice. Commodity price projections are inherently speculative and subject to rapid revision as geopolitical and macroeconomic conditions evolve.
Want to Stay Ahead of the Next Major Commodity Market Shift?
While oil markets navigate geopolitical risk premiums and supply disruptions, significant mineral discoveries on the ASX can generate equally dramatic price movements — and Discovery Alert's proprietary Discovery IQ model delivers real-time alerts the moment those discoveries are announced, turning complex data across 30+ commodities into clear, actionable insights. Explore historic discovery returns on Discovery Alert's dedicated discoveries page and begin your 14-day free trial today to ensure you're positioned ahead of the market.