June 10, 2026
The Hidden Architecture of Oil Price Volatility: Why Diplomacy Moves Markets Faster Than Tankers
Understanding why crude oil prices move requires looking beyond the standard supply-and-demand framework taught in economics textbooks. The physical commodity itself, heavy, viscous, and transported across oceans over weeks, responds to geopolitical events at a speed that defies its material nature. Futures markets price in probability distributions over future supply scenarios, not just current inventory levels. This means that a single diplomatic statement from a head of state can reprice a barrel of oil within seconds, long before a single additional drop of crude reaches any port terminal.
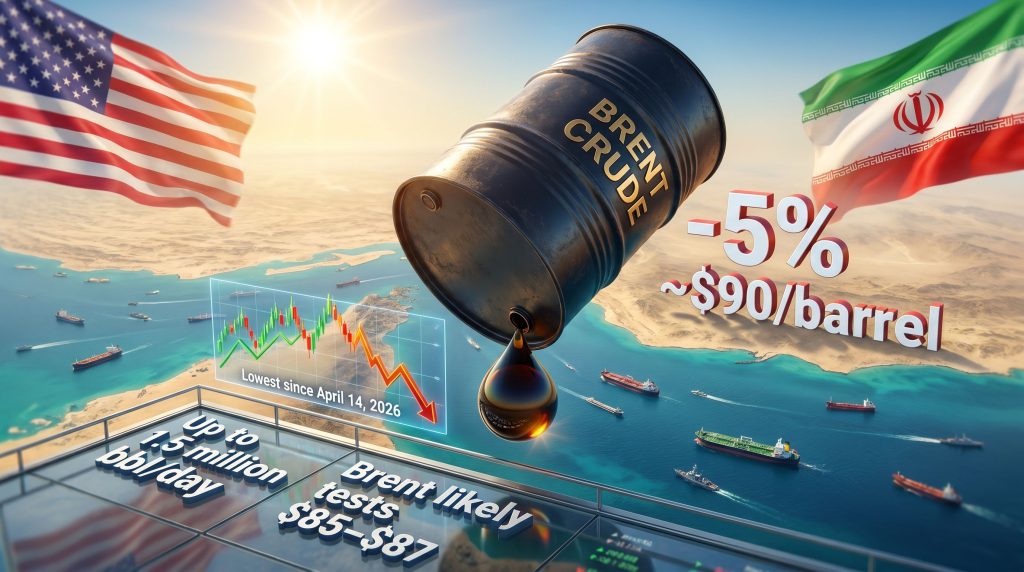
This dynamic was on full display when Brent crude falls below $90 on Iran deal hopes became the defining market story of June 10, 2026, as benchmarks collapsed roughly 5% in a single trading session in response to signals that a United States-Iran diplomatic agreement could materialise within days.
When big ASX news breaks, our subscribers know first
The Geopolitical Risk Premium: How Conflict Gets Priced Into Crude Oil
Every barrel of Brent crude that trades on global futures exchanges carries more than its intrinsic value as a combustible liquid. It carries a risk-adjusted probability of future supply disruption. Analysts commonly refer to this additional value as the geopolitical risk premium, and in the context of the Middle East, it is rarely zero.
The risk premium is not a fixed number. It fluctuates based on:
- The perceived probability of military escalation in key producing or transit regions
- The credibility of diplomatic channels and ceasefire arrangements
- The proximity of conflict to critical infrastructure including pipelines, terminals, and chokepoints
- The historical precedent of how similar crises resolved or escalated
Estimates of this premium vary depending on the analytical model used, but during periods of elevated Middle Eastern tension, academic and industry research has consistently placed the geopolitical component somewhere between $5 and $15 per barrel above what fundamental supply-and-demand models would otherwise justify. The precise figure depends on conflict intensity and the perceived likelihood of supply interruption. Furthermore, understanding crude oil price analysis helps contextualise how these premiums have historically behaved across different conflict cycles.
The Strait of Hormuz: A Structural Premium Built Into Global Energy Markets
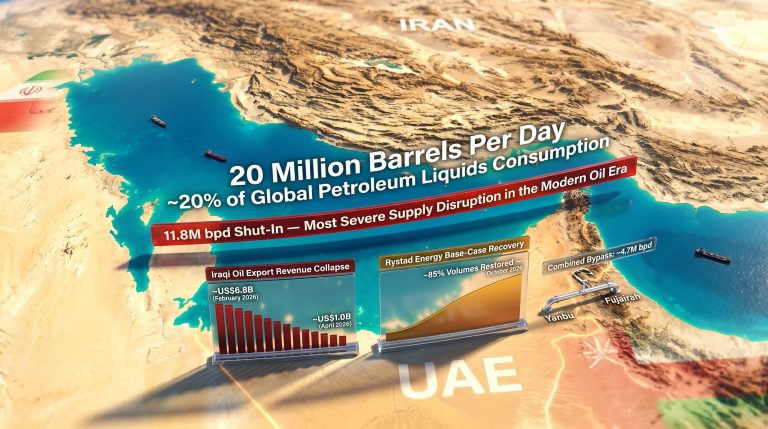
No single geographic feature commands more pricing power in global oil markets than the Strait of Hormuz. Approximately 20% of the world's total oil supply transits this narrow waterway between the Persian Gulf and the Gulf of Oman daily, representing roughly 17 to 21 million barrels per day depending on the period measured. Iran's geographic position gives it the theoretical ability to threaten this passage in ways no other nation can replicate, which is why Iranian military posturing or explicit closure threats translate almost instantaneously into crude price spikes.
In the weeks leading up to June 10, 2026, Iranian officials had explicitly raised the prospect of Strait of Hormuz closure in response to escalating regional tensions. That rhetoric, whether or not operationally credible, was sufficient to push Brent prices toward the upper $90s and briefly approach the $100 threshold.
Key structural insight: Traders do not need to believe a Hormuz closure is likely to price it in. They only need to assign it a meaningful probability. Even a 10–15% probability of a supply disruption affecting 20 million barrels per day creates enormous asymmetric risk, justifying a substantial premium in futures pricing.
What Happened to Brent Crude Prices on June 10, 2026?
The session on June 10, 2026 produced one of the more dramatic single-day crude price reversals of the year. Below is a snapshot of where benchmarks moved and what levels were breached.
| Benchmark | Price Movement | Key Level Breached |
|---|---|---|
| Brent Crude | Fell approximately 5% | Below $90/barrel for first time since April 14, 2026 |
| West Texas Intermediate (WTI) | Fell to approximately $86/barrel | Multi-week low |
| Intraday Swing | Roughly 5% decline | Significant single-session magnitude |
The $90 level is not arbitrary. In crude oil markets, round-number price thresholds function as dual-purpose markers: they carry psychological weight for human traders making discretionary decisions, and they function as technical reference points that algorithmic trading systems are programmed to monitor. When Brent crossed below $90, it activated momentum-following strategies and stop-loss orders on the downside, accelerating the move beyond what the fundamental news alone might have justified.
Why a 5% Single-Session Move Matters in Energy Markets
Crude oil is not a highly volatile asset class by equity standards. In normal trading conditions, daily moves of 0.5% to 1.5% are considered typical. A 5% single-session decline, therefore, represents an event that falls well into the tail of the normal distribution of daily returns, placing it statistically alongside significant inventory shocks, OPEC production surprises, or demand destruction events such as the early stages of COVID-19.
The fact that this move was driven entirely by a diplomatic signal rather than a physical supply change underscores how deeply embedded forward-looking risk assessment has become in modern energy market microstructure.
Unpacking the Iran Diplomacy Catalyst
The immediate trigger for the June 10 selloff was a fresh set of statements from US President Donald Trump indicating that a peace agreement with Iran was close and could potentially be finalised within a two-to-three day window. This followed a pattern that had already been established in prior weeks, where similar signals from the administration had produced temporary price softening before fresh escalation reversed the moves.
What made June 10 different was the combination of factors compressing simultaneously:
- The diplomatic signal arrived with unusual specificity regarding timeline
- It came just one day after crude had surged on renewed Iran-Israel strike activity, meaning the gap between the risk-on and risk-off price was unusually large
- Speculative positioning in crude futures had built to elevated long levels during the conflict escalation phase, leaving a substantial inventory of positions vulnerable to rapid liquidation
This third factor is frequently underappreciated in public commentary. When professional traders and hedge funds build large long positions in anticipation of supply disruption, the subsequent unwind of those positions can amplify a directional move far beyond what the fundamental news warrants. The diplomacy news was the trigger; the speculative positioning was the accelerant.
The Day Before: How Military Strikes Create the Conditions for Violent Reversals
The session immediately preceding the June 10 decline saw Brent surge after Iran and Israel exchanged strikes within the context of a fragile regional ceasefire. That rally embedded fresh risk premium into the price, which then became vulnerable to rapid reversal when the diplomatic signal arrived.
This volatility cycle — escalation spike followed by diplomacy-driven collapse — is a recurring pattern in Middle Eastern energy geopolitics. Traders who understand this cycle can position for mean reversion, though the timing of diplomatic signals is inherently unpredictable, making this a high-risk strategy. Oil slides on US-Iran peace hopes offers further detail on how this particular diplomatic catalyst cascaded through global markets.
How Much Iranian Supply Could Re-Enter the Market?
The core economic argument behind the price decline rests on a straightforward supply calculation. Under current sanctions, Iranian crude exports are significantly constrained. A diplomatic resolution removing or substantially reducing those sanctions would unlock meaningful additional supply into an already-debated demand environment.
| Scenario | Estimated Additional Supply | Market Impact Assessment |
|---|---|---|
| Partial sanctions relief | 500,000 to 800,000 barrels per day | Moderate downward pressure on prices |
| Full diplomatic normalisation | Up to 1.5 million barrels per day | Material surplus risk, significant price decline |
| No deal or deal collapse | Supply remains constrained | Risk premium rebuilds, upward price pressure resumes |
For context, Iran's total production capacity before sanctions was estimated at approximately 3.8 million barrels per day. Even a partial restoration of export capacity represents a supply addition large enough to shift the global balance, particularly given the ongoing debate about whether OPEC+ has sufficient cohesion to absorb new Iranian volumes through compensating production cuts.
OPEC+ and the Iranian Re-Entry Challenge
This is one of the less-discussed structural complications of any Iran deal scenario. OPEC+ members, particularly Saudi Arabia and the UAE, have managed production discipline with the explicit understanding that Iranian supply remains constrained. If Iranian exports increase by 1 to 1.5 million barrels per day without a corresponding reduction from existing OPEC+ members, the cartel faces a genuine credibility test. OPEC's influence on global oil markets provides important context for understanding how such internal tensions have historically played out.
Historically, Saudi Arabia has shown willingness to absorb short-term production adjustments to maintain price stability, but the geopolitical dimensions of Iran's re-entry into export markets carry dynamics that go beyond pure economics. The political relationship between Riyadh and Tehran adds a layer of strategic complexity to what might otherwise be a straightforward supply management calculation.
What a Sub-$90 Brent Price Means for the Global Economy
The downstream implications of crude falling below $90 per barrel extend well beyond energy trading desks.
For oil-importing economies:
- India, the world's third-largest oil importer, benefits directly through reduced import bills and lower domestic fuel subsidy burdens
- China, whose economic recovery trajectory influences global demand projections, gains meaningful manufacturing and logistics cost relief
- Southeast Asian economies, several of which run structural current account deficits partly driven by energy imports, see immediate balance-of-payments improvement
For oil-exporting nations:
- Gulf sovereign wealth funds face reduced revenue inflows at prices below fiscal breakeven levels, which for many GCC members sit in the $70 to $90 per barrel range depending on the budget year
- Russian export revenues, already constrained by Western price caps, face additional compression
- Smaller OPEC members with higher production costs and lower fiscal buffers face acute budget pressure
Macro linkage worth monitoring: Crude oil is among the most important single inputs into global consumer price indices. A sustained period of Brent crude falls below $90 on Iran deal hopes would reduce headline inflation pressure in major oil-importing economies, which in turn could influence the pace and direction of central bank monetary policy decisions through the second half of 2026. For countries where rate cut cycles have stalled due to sticky energy-driven inflation, a lower crude price environment could provide the cover needed to resume easing.
The next major ASX story will hit our subscribers first
Trader Psychology and Market Microstructure During Diplomatic Events
The mechanics of how a diplomatic statement translates into a 5% price move in under a trading session reveals important features of modern energy market microstructure that are not widely understood outside professional trading circles.
Long liquidation vs. fundamental selling are two distinct market dynamics that often occur simultaneously during diplomatic de-escalation events. Fundamental sellers are market participants adjusting their view of intrinsic value based on the prospect of additional supply. Long liquidators are participants who had positioned for higher prices and are simply exiting those positions to lock in profits or cut losses. During June 10's session, both dynamics were likely operating concurrently, which helps explain the magnitude of the move.
Implied volatility in crude options markets serves as a real-time gauge of uncertainty. Before diplomatic signals, elevated implied volatility reflects genuine market uncertainty about supply outcomes. When a credible diplomatic development emerges, implied volatility can collapse rapidly, itself triggering additional selling as volatility-sensitive hedging strategies unwind.
Algorithmic and news-driven trading now accounts for a significant share of crude futures volume. Natural language processing systems designed to identify geopolitical keywords in presidential statements and news feeds can initiate sell orders within milliseconds of a headline appearing, creating the initial sharp move that then draws in discretionary traders and momentum followers.
Scenario Analysis: Three Pathways From Here
Scenario 1: Deal confirmed within the announced timeframe
- Iranian crude begins a phased return to export markets on a defined schedule
- Brent likely tests the $85 to $87 support range as the supply timeline becomes concrete
- OPEC+ faces a strategic decision about production targets that tests cartel cohesion
- Oil-importing economies begin factoring sustained lower energy costs into forward planning
Scenario 2: Negotiations collapse or stall
- The geopolitical risk premium rapidly rebuilds in crude futures
- Brent could recover toward the $92 to $95 range within days of a confirmed breakdown
- Speculative positioning shifts back to net long, amplifying the upside move
- Regional military risk reassessment adds additional uncertainty premium
Scenario 3: Phased or partial agreement
- Markets adopt a cautious consolidation posture, pricing in partial but not full supply restoration
- Brent likely trades in a $88 to $92 range with elevated headline sensitivity
- Ongoing diplomatic developments become the primary price-moving variable
- Options market implied volatility remains elevated relative to historic norms
Broader Market Context in Mid-2026
The Iran diplomacy story is unfolding against a backdrop of other significant forces acting on crude prices simultaneously.
Global demand signals remain mixed. China's post-reopening demand recovery has been more gradual than some forecasters anticipated, while India's demand growth has remained robust. The net effect on global consumption trajectories heading into the second half of 2026 is a point of genuine analytical disagreement among forecasters. In addition, the US-China trade war's impact on oil prices adds a further dimension of demand-side uncertainty that is difficult to model with precision.
US dollar dynamics add a further layer of complexity. Crude oil is denominated in US dollars, creating an inverse mechanical relationship between dollar strength and commodity prices for non-dollar-denominated buyers. A stronger dollar reduces the purchasing power of oil-importing nations priced in local currencies, effectively raising the real cost of crude even as the nominal dollar price falls.
Energy transition narratives, while structurally important over a decade-long horizon, have minimal relevance to near-term crude pricing. Oil demand in absolute terms continues to grow in emerging economies, and the pace of demand destruction from electrification in developed markets is insufficient to materially alter supply-demand balances on a 12 to 24 month horizon. Consequently, a current crude oil market overview remains essential reading for understanding where fundamentals actually sit beneath the diplomatic noise.
Frequently Asked Questions: Iran, Brent Crude, and Oil Market Mechanics
Why does an Iran deal cause oil prices to fall?
A diplomatic resolution between the United States and Iran would likely reduce or remove the sanctions currently limiting Iranian crude exports. Markets anticipate the resulting supply increase and price it in ahead of the physical delivery, causing futures prices to decline as traders unwind risk premiums previously built into contracts.
What is a geopolitical risk premium in oil markets?
It is the additional price embedded in crude futures above what pure supply-and-demand fundamentals would justify, reflecting the probability of future supply disruptions from conflict, sanctions, or political instability in key producing or transit regions.
Why does the $90 per barrel level matter technically?
Round-number levels act as both psychological and algorithmic reference points. Traders monitor these levels for breakout confirmation, and many automated systems are programmed to execute orders when they are breached, making the move self-reinforcing once initiated. Furthermore, the trade war's broader impact on oil markets has further complicated how these technical thresholds interact with macro-driven sentiment shifts.
How quickly can prices recover if talks collapse?
Historical precedent from prior diplomatic breakdown episodes suggests Brent can recover $3 to $6 per barrel within a single trading session following a credible negative diplomatic development, with further recovery possible over subsequent days as risk premium rebuilds.
What is the difference between Brent and WTI?
Brent crude is the international benchmark priced against North Sea production and used as the reference for approximately two-thirds of globally traded oil volumes. WTI is the US domestic benchmark. Their spread reflects regional supply-demand imbalances, infrastructure constraints, and quality differences, and tends to widen during geopolitical events centred on non-US producing regions.
This article contains forward-looking scenario analysis and market commentary. Crude oil prices are subject to rapid change based on geopolitical developments, diplomatic outcomes, and macroeconomic variables. Nothing in this article constitutes investment advice. Readers should conduct independent research before making any financial decisions related to energy markets or commodity-linked assets.
Want to Stay Ahead of the Next Major Commodity Market Shift?
Discovery Alert's proprietary Discovery IQ model delivers real-time alerts on significant ASX mineral discoveries, transforming complex market data into actionable insights for both short-term traders and long-term investors — explore Discovery Alert's discoveries page to understand how major resource discoveries have historically generated substantial returns, and begin your 14-day free trial today to position yourself ahead of the broader market.