
June 10, 2026
The Hidden Architecture of Global Energy Vulnerability
Every barrel of oil carries with it an invisible geography, a set of physical constraints that determine where it can go, how fast it can move, and what happens to global markets when those pathways are severed. Most energy consumers never think about this geography. They experience it only indirectly, through fuel prices, heating bills, and the cost of goods transported across continents. For analysts, traders, and policymakers who map the world's energy arteries, however, one location has always stood apart as the single point of greatest systemic fragility: a 33-kilometre-wide maritime corridor connecting the Persian Gulf to the Gulf of Oman.
The Strait of Hormuz oil supply disruption now unfolding across global energy markets is not simply a geopolitical crisis. It is a stress test of assumptions that have governed global oil market architecture for decades — assumptions about the resilience of bypass infrastructure, the speed of diplomatic resolution, and the recoverable nature of mature oilfield production. Those assumptions are not holding up well.
When big ASX news breaks, our subscribers know first
Why the Strait of Hormuz Remains the World's Most Critical Energy Chokepoint
The Geography of Global Oil Dependency
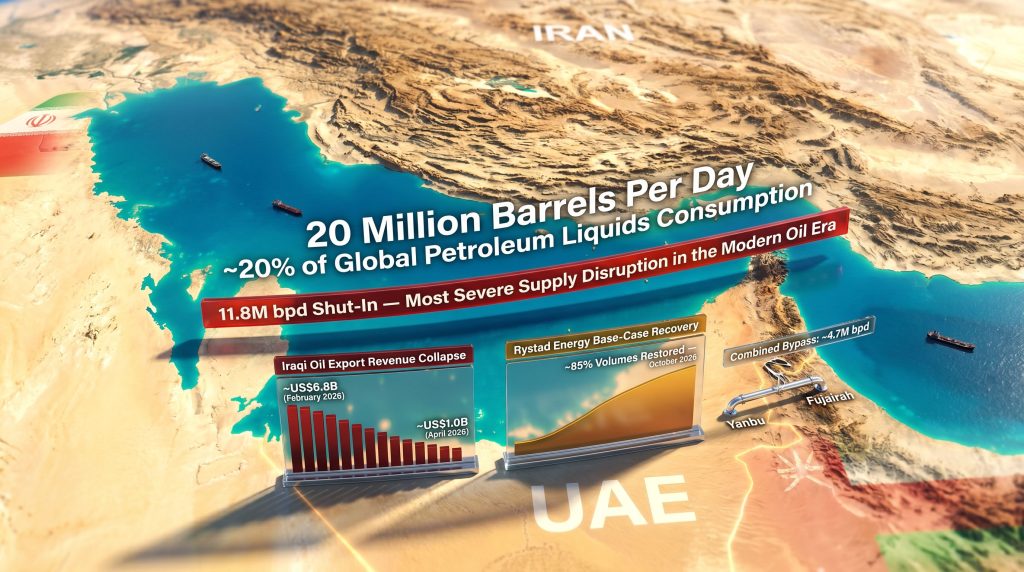
The physical dimensions of the strait are deceptively modest. At its narrowest navigable point, vessels transit a corridor approximately 33 kilometres wide, operating within designated shipping lanes that sit uncomfortably close to territorial waters controlled by Iran on one side and Oman on the other. Yet through this constricted passage, approximately 20 million barrels per day (bpd) of crude oil, condensate, and refined petroleum products moved in 2024, representing roughly 20% of total global petroleum liquids consumption.
That figure alone would make the strait strategically significant. Furthermore, its role extends even further. The same passage carries an estimated one-fifth of the world's LNG supply, meaning it functions as a simultaneous chokepoint for both liquid fuels and natural gas markets. No other single maritime feature concentrates this level of dual-commodity exposure, and LNG supply implications of a closure are severe and wide-reaching.
What makes the strait genuinely irreplaceable rather than merely important is the absence of credible alternatives at scale. Unlike the Suez Canal, which can be partially substituted by routing vessels around the Cape of Good Hope at considerable cost and delay, the Strait of Hormuz has no equivalent workaround for the majority of Gulf producers.
According to the US Energy Information Administration (EIA), total available pipeline bypass capacity across all Gulf producers amounts to approximately 2.6 million bpd. Against a normal transit volume of 20 million bpd, this represents a substitution rate of just 13%. No realistic combination of overland pipelines, port diversions, or expanded terminal capacity can close that gap in the near term.
The two most significant bypass options are:
- Saudi Arabia's East-West Pipeline connecting eastern production regions to the Red Sea port of Yanbu, offering partial but capacity-constrained export rerouting
- The UAE's Abu Dhabi Crude Oil Pipeline (ADCOP) linking onshore Murban crude production to the port of Fujairah on the Gulf of Oman, south of the strait's eastern entrance
Neither system was engineered to absorb full Gulf export volumes. Both face physical throughput limits, logistical constraints, and, as events have demonstrated, vulnerability to military targeting and insurance disruption.
How Large Is the Current Strait of Hormuz Oil Supply Disruption?
Measuring the Scale: Production Losses Across Six Gulf Producers
The breadth of the current disruption is difficult to overstate. Combined output across six Gulf producers has collapsed from approximately 24.2 million bpd before the conflict to around 12.4 million bpd, leaving 11.8 million bpd shut in. This represents the largest simultaneous volume removal from global oil markets in the modern era.
| Producer | Pre-Conflict Output (bpd) | Estimated Shut-In Volume (bpd) | Share of Total Shut-Ins |
|---|---|---|---|
| Saudi Arabia | ~9.5M | ~3.8M | ~32% |
| Iraq | ~4.5M | ~2.8M | ~24% |
| Kuwait | ~2.7M | ~2.0M | ~17% |
| UAE + Others | ~5.5M | ~3.2M | ~27% |
| Total (6 Producers) | ~24.2M | ~11.8M | 100% |
After accounting for bypass flows and partial supply offsets from alternative export terminals, the net remaining global shortfall sits at approximately 9 million bpd versus pre-disruption demand levels, according to Bloomberg market estimates. Rystad Energy analysts have characterised this as the most severe supply disruption the modern oil industry has ever experienced. Consequently, crude oil price trends have shifted dramatically in response to these unprecedented volumes being removed from the market.
Cumulative Supply Loss: A Benchmark Comparison
Three months into the conflict, cumulative supply losses have reached approximately 1 billion barrels — a figure equivalent to 2.5 times the entire US Strategic Petroleum Reserve (SPR). Under Rystad Energy's base case projection, cumulative losses are on track to approach 2 billion barrels by year-end 2026.
Scale Context: Each additional month of unresolved conflict adds an estimated 350 million barrels to the cumulative loss total. A meaningful and growing proportion of those losses are classified by analysts as permanently unrecoverable, particularly from mature field infrastructure in Iraq and Kuwait, where reservoir pressure management requirements impose extended restart timelines that most market pricing models have not adequately captured.
This distinction between recoverable and permanently lost production is critically important. It means the eventual reopening of the strait will not automatically restore pre-conflict supply levels. Some of what has been lost is gone structurally, not just temporarily withheld.
Which Countries and Producers Are Most Exposed to the Disruption?
Iraq: Maximum Vulnerability, Minimum Alternatives
Iraq's exposure to the Strait of Hormuz oil supply disruption is more acute than any other Gulf producer. Its major southern production fields — including Rumaila, West Qurna, and Majnoon, collectively among the largest conventional oil fields on earth — are almost entirely dependent on seaborne export routes through the strait. Northern pipeline capacity via Turkey's Ceyhan terminal exists but remains severely limited relative to Iraq's total export volumes.
The financial consequences have been swift and severe:
| Month | Iraqi Oil Export Revenue |
|---|---|
| February 2026 | ~US$6.8 billion |
| April 2026 | ~US$1.0 billion |
| May 2026 (forecast) | Below US$1.0 billion |
This collapse in revenue has immediate fiscal consequences for an economy that derives the vast majority of its government income from oil exports. The longer-term concern is geological: Iraq's mature southern fields are particularly susceptible to reservoir pressure loss during extended production shutdowns. Restarting these fields safely requires careful, time-consuming pressure management, meaning Iraq's production recovery will lag significantly behind any strait reopening.
Saudi Arabia: Partial Insulation Through Infrastructure Advantage
Saudi Arabia's position within the disruption is structurally different from Iraq's. Its East-West Pipeline to Yanbu provides a meaningful bypass option that has allowed export revenues to remain relatively elevated. March 2026 export revenues reached approximately US$24.6 billion, the highest monthly figure since 2022, reflecting the kingdom's ability to redirect crude flows away from the strait.
However, Yanbu faces its own set of constraints that limit how much of the shortfall it can absorb long-term:
- Vessel availability at Yanbu remains constrained relative to the volume surge the conflict has generated
- Loading-window congestion limits effective throughput below nameplate pipeline capacity
- Houthi interdiction risk in the Red Sea introduces an additional security layer that affects vessel insurance and routing decisions
Iran: Blockade Compounds Conflict Losses
Iran's position involves a compounding set of pressures. Iranian crude exports averaged 1.64 million bpd in March 2026, the final full month before the United States implemented a naval blockade of Iranian ports on April 13, 2026. By April, exports had declined to approximately 1.34 million bpd, with May forecasts pointing to volumes below 500,000 bpd.
US Central Command reported that by May 27, the blockade had prevented 107 vessels from entering or leaving Iranian ports, a figure that illustrates the enforcement intensity of the interdiction campaign. In addition, Iran currently holds an estimated 150 to 160 million barrels of oil on water — a floating storage buffer sustaining Chinese refinery supply and providing Tehran with continued revenue. This buffer is finite, however, and its depletion timeline will become a critical variable in assessing how long Iran can maintain any meaningful export position.
China: The Downstream Demand Pressure Point
China's import exposure to Gulf crude and Iranian barrels makes it the most immediately vulnerable major consumer economy. Chinese imports of Iranian crude declined by more than 500,000 bpd in April, falling to approximately 1.1 million bpd. Chinese refiners are currently drawing down Iran's floating storage buffer, but this cannot continue indefinitely.
Asia is broadly expected to be the first region to experience physical shortages rather than simply price increases, given its structural dependence on Gulf crude flows and limited ability to rapidly substitute with Atlantic Basin or West African volumes at equivalent scale.
Europe: Diesel and Jet Fuel Tightness on the Horizon
Europe faces a different exposure profile. Rather than crude shortfalls, European markets are primarily exposed through rising diesel and jet fuel prices as Gulf-sourced refined product flows tighten. Current inventory drawdowns are absorbing some of the price pressure, but sustained disruption will accelerate buffer depletion. Furthermore, geopolitical tensions reshaping trade are compounding the challenge for European energy security analysts, who have flagged the risk of fuel cost pass-through into manufacturing, logistics, and transportation sectors if the disruption persists beyond Q3 2026.
What Has Happened to Vessel Traffic Through the Strait of Hormuz?
Shipping Volume Collapse: A Timeline
The collapse in vessel transits through the strait has been both rapid and persistent. Multiple rounds of ceasefire negotiations and diplomatic exchanges have failed to produce meaningful or sustained recovery in shipping volumes.
| Period | Daily Vessel Transits | % of Pre-Conflict Baseline |
|---|---|---|
| Pre-conflict baseline (Feb 27) | ~120 vessels/day | 100% |
| March 2026 (conflict peak) | 5–10 vessels/day | ~4–8% |
| April–May 2026 (post-ceasefire attempts) | Below 20–24 vessels/day | <20% |
LNG shipments have been disproportionately affected. Flows declined from approximately 5 vessels per day before the conflict to near zero, effectively removing Qatar and other Gulf LNG exporters from global spot markets. Crude and product tanker movements have similarly failed to normalise, with pre-conflict run rates of nearly 30 tankers per day reduced to a handful on most days.
A less commonly appreciated aspect of the shipping disruption is the insurance market dimension. War risk premiums in the Gulf have spiked to levels that render many voyages economically unviable even when captains are willing to attempt transit. This creates a commercial barrier to vessel movement that persists independently of physical security conditions, meaning transit recovery will require both a security improvement and an insurance market normalisation before volumes return. Indeed, how markets have handled the Hormuz crisis illustrates just how intertwined physical and financial barriers have become.
Are Bypass Routes and Alternative Infrastructure Capable of Filling the Gap?
The Bypass Surge and Its Limits
Combined international loadings from Saudi Arabia's Yanbu and the UAE's Fujairah terminals climbed from below 2 million bpd in mid-February to above 6 million bpd by early April, briefly peaking near 7.2 million bpd in early May. That surge has since reversed sharply, for reasons that reveal structural constraints rather than temporary operational disruptions.
Why Bypass Capacity Has Retreated
Fujairah Terminal Damage (May 4 Attack):
- A targeted strike on terminal infrastructure at Fujairah constrained both power availability and insurance coverage for vessels calling at the facility
- Loadings from Fujairah have declined materially since the attack
- The incident demonstrated that bypass terminal infrastructure carries its own conflict exposure, not just the strait itself
Yanbu Operational Constraints:
- Vessel availability limitations and loading-window congestion have capped effective throughput well below pipeline capacity
- Houthi interdiction activity in the Red Sea continues to affect insurance terms and vessel routing decisions for tankers calling at Yanbu
- Combined bypass flows had retreated to approximately 4.7 million bpd by late May 2026
ADCOP Pipeline Expansion: A Medium-Term Solution
ADNOC has fast-tracked an expansion of the Abu Dhabi Crude Oil Pipeline, raising nameplate capacity from 1.8 million bpd to 3.3 million bpd. This represents meaningful incremental bypass capacity. However, a critical technical limitation constrains its impact: the pipeline carries exclusively Murban crude from ADNOC's onshore producing fields.
ADNOC's offshore production grades, which represent a material share of total UAE output, cannot currently access Fujairah for export without additional infrastructure development. This offshore-to-Fujairah infrastructure gap represents a structural bottleneck that cannot be addressed within the current conflict timeline, meaning the ADCOP expansion provides only partial relief against total UAE bypass capacity requirements.
The next major ASX story will hit our subscribers first
What Do the Recovery Scenarios Look Like for Global Oil Supply?
Rystad Energy Base Case: Phased Reopening from Mid-July 2026
Rystad Energy's base case assumes a narrow diplomatic agreement between the US and Iran in June, followed by a phased reopening of the Strait of Hormuz beginning mid-July 2026. Even under this relatively optimistic scenario, the supply recovery is projected to follow a gradual restoration curve rather than a sharp rebound. For context on how trade war dynamics affect oil recovery trajectories, current conditions illustrate how geopolitical complexity compounds physical supply constraints.
| Month | Projected Regional Supply Recovery |
|---|---|
| July 2026 | 10–15% of shut-in volumes restored |
| August 2026 | Regional supply rising toward ~17.3M bpd |
| September 2026 | Regional supply rising toward ~20.9M bpd |
| October 2026 | ~85% of lost volumes restored |
| January 2027 | Full recovery (Iraq and Kuwait mature fields) |
Several factors drive this gradual curve:
- Tanker repositioning lag: Even after the strait reopens, an estimated two to three weeks will pass before the first wave of vessels completes repositioning and begins loading, delaying initial supply recovery relative to the reopening date itself
- Mature field restart complexity: Iraq and Kuwait's mature fields require careful reservoir pressure restoration before production can safely ramp back toward pre-conflict levels, extending full recovery into Q1 2027
- Insurance and war risk normalisation: Shipping insurance markets will not immediately revert to pre-conflict terms upon a diplomatic announcement, creating an additional lag in vessel availability
- Terminal infrastructure repair: Fujairah's damaged infrastructure will require repair and recertification before it can resume full loading operations
Cumulative supply losses are on track to reach approximately 2 billion barrels by year-end even under this base case scenario.
Downside Risk: What If the Base Case Fails?
Risk Warning: A fragile diplomatic memorandum between the US and Iran that briefly raised market hopes has since deteriorated, with both parties resuming active military exchanges. This narrows the viable diplomatic track and materially widens the probability of a prolonged supply shock extending well beyond current base case assumptions.
Under a prolonged disruption scenario:
- Each additional month of unresolved conflict adds approximately 350 million barrels to cumulative losses
- Total cumulative losses would push materially above 2 billion barrels and extend the recovery timeline into mid-to-late 2027
- Permanently unrecoverable production losses from mature Iraqi and Kuwait fields would introduce a structural reduction in global supply capacity that no amount of diplomatic resolution can reverse
How Does a Strait of Hormuz Disruption Affect Commodities Beyond Oil?
LNG Markets: Near-Total Disruption of Gulf Flows
Qatar routes virtually all of its LNG exports through the Strait of Hormuz, making it uniquely exposed among major LNG exporters. With LNG vessel transits near zero, Qatar has been effectively sidelined from global LNG markets for the duration of the conflict. Unlike crude oil, which can theoretically be rerouted through alternative pipelines and terminals at partial scale, LNG has virtually no viable large-scale alternative routing from Gulf production facilities. The World Economic Forum's analysis of commodities impacted by a Hormuz closure further illustrates how the LNG supply impact is particularly severe and largely supply-inelastic in the short term.
Industrial Commodities: The Overlooked Cascade
The commodity disruption extends well beyond hydrocarbons. A less widely appreciated consequence of prolonged Hormuz closure is its cascade effect through industrial supply chains. In addition, crude oil analysis for 2025 provides useful framing for understanding how these secondary commodity effects compound the primary disruption:
- Fertilisers and ammonia: Gulf natural gas underpins a significant share of global ammonia production. Restricted gas flows affect fertiliser availability and pricing globally, with downstream implications for agricultural input costs and food prices
- Methanol: The Gulf maintains a substantial methanol production base. Disruption to exports affects chemical manufacturing chains across Asia and Europe
- Aluminium and alumina: Energy-intensive Gulf smelting operations face both input cost pressures and logistics disruption, affecting global aluminium supply
- Sulphur: A by-product of Gulf oil and gas processing, sulphur is used extensively in fertiliser production and industrial chemical processes. Supply disruption flows directly into those downstream industries
These secondary commodity effects are frequently underweighted in market analysis focused primarily on crude oil benchmarks, yet they represent real-world cost transmission mechanisms that affect manufacturing competitiveness, food security, and consumer prices across multiple regions simultaneously.
Frequently Asked Questions: Strait of Hormuz Oil Supply Disruption
How much oil passes through the Strait of Hormuz?
Approximately 20 million barrels per day of crude oil, condensate, and petroleum products transited the Strait of Hormuz in 2024, representing around 20% of global petroleum liquids consumption. The strait also carries roughly one-fifth of global LNG supply, making it a critical dual-commodity chokepoint.
What is the current scale of the Hormuz oil supply disruption?
As of mid-2026, approximately 11.8 million bpd has been shut in across six Gulf producers, with net global supply shortfall estimated at around 9 million bpd after bypass flows and partial offsets. Cumulative losses have reached approximately 1 billion barrels in three months, equivalent to 2.5 times the US Strategic Petroleum Reserve.
Which countries are most affected by the Strait of Hormuz closure?
Iraq faces the greatest structural exposure due to near-total dependence on strait-based exports and the geological complexity of restarting mature southern fields. Asian economies, particularly China, are experiencing the most immediate supply pressure. Europe faces rising diesel and jet fuel prices. Saudi Arabia has been relatively better insulated through its Yanbu bypass infrastructure.
Can pipeline alternatives replace Hormuz oil flows?
No. Total available bypass pipeline capacity across all Gulf producers is estimated by the EIA at approximately 2.6 million bpd — a small fraction of the 20 million bpd that normally transits the strait. Current combined bypass flows have retreated to approximately 4.7 million bpd due to infrastructure damage and operational constraints.
When is Strait of Hormuz oil supply expected to recover?
Under Rystad Energy's base case scenario, a phased reopening from mid-July 2026 would restore approximately 85% of lost volumes by October 2026, with full recovery of Iraq and Kuwait's mature fields extending into January 2027. Cumulative losses are projected to reach approximately 2 billion barrels by year-end 2026 even under this relatively constructive scenario.
How does the Hormuz disruption affect LNG markets?
LNG vessel transits through the strait have fallen from approximately 5 vessels per day to near zero, effectively removing Qatar and other Gulf LNG exporters from global markets. Unlike crude oil, LNG has virtually no alternative routing options from Gulf production facilities, making this the most supply-inelastic segment of the broader disruption.
Key Takeaways: The Strategic and Economic Implications of Prolonged Hormuz Disruption
The Strait of Hormuz oil supply disruption represents a structural stress test of global energy architecture that has revealed significant fragility beneath assumptions of market resilience. The following summary captures the core dynamics investors, policymakers, and energy market participants should hold in view:
- The disruption, with 11.8 million bpd shut in across six producers, constitutes the most severe energy supply shock in the modern oil era by volume removed
- Cumulative losses of approximately 1 billion barrels in three months are on track to approach 2 billion barrels by year-end, even under optimistic diplomatic resolution assumptions
- Bypass infrastructure, while providing partial relief, is structurally incapable of replacing strait flows at scale and has itself proven vulnerable to targeted attack
- Iraq faces permanent production loss risk from mature field damage and reservoir pressure decline, introducing a structural supply deficit that extends beyond the conflict timeline
- The insurance market dimension of shipping disruption is frequently underweighted, yet it creates commercial barriers to vessel movement that persist independently of physical security improvements
- LNG markets have been effectively decoupled from Gulf supply for the duration of the disruption, with no viable alternative routing available for Qatari volumes
- Secondary commodity cascades through fertiliser, methanol, aluminium, and sulphur markets represent underappreciated transmission mechanisms from the primary disruption to broader economic costs
- The diplomatic track between the US and Iran remains fragile, and any further deterioration would materially worsen both the supply outlook and the cumulative loss trajectory beyond current base case projections
This article contains forward-looking scenarios and analyst projections that are subject to significant uncertainty. Diplomatic outcomes, military developments, and field-level operational factors may cause actual supply recovery timelines to differ materially from base case assumptions. Nothing in this article constitutes financial or investment advice.
Want To Stay Ahead of the Next Major Commodity Disruption?
The Strait of Hormuz crisis demonstrates how rapidly global energy and commodity markets can be reshaped by a single geopolitical flashpoint — and Discovery Alert's proprietary Discovery IQ model delivers real-time ASX mineral discovery alerts that help investors identify actionable opportunities as commodity supply chains are redrawn. Explore historic discoveries and their exceptional market returns on Discovery Alert's dedicated discoveries page, and begin your 14-day free trial today to position yourself ahead of the next major market shift.