August 25, 2026
The Invisible Architecture Behind Oil's $90 Threshold
Global crude oil markets have always been shaped by more than just barrels pumped and barrels consumed. Beneath every benchmark price sits a layered structure of risk perception, financial system leverage, physical chokepoint geography, and reserve buffer capacity. When all four of these dimensions compress simultaneously, the result is a market that behaves less like a commodity exchange and more like a geopolitical barometer. That is precisely the environment traders are navigating right now, with Brent crude above $90 amid US sanctions on Iran reshaping how energy analysts think about price formation in conflict-adjacent supply chains.
Understanding why crude is holding above $90 per barrel requires stepping back from the daily headlines and examining the structural architecture that makes oil markets uniquely vulnerable to Iranian-linked disruptions. For a broader crude oil market overview, the current environment reflects a convergence of forces rarely seen in a single pricing cycle.
When big ASX news breaks, our subscribers know first
Why Oil Markets Are Structurally Vulnerable to Iran-Related Shocks
The Geopolitical Risk Premium: More Than a Sentiment Adjustment
The term geopolitical risk premium is often treated as a soft, qualitative add-on to commodity pricing models. In reality, it is a measurable, tradeable spread between what supply-demand fundamentals would price crude at and what markets actually price it at when physical disruption risk rises.
Historically, major Middle East escalation events have pushed Brent through successive psychological thresholds with notable consistency. The $80 level was breached during the early phases of the Iran nuclear standoff in 2012. The $90 level has been repeatedly tested during periods of Strait of Hormuz tension. The $100+ range emerged during full-scale conflict scenarios and acute OPEC supply squeezes.
What separates the current environment from prior episodes is the simultaneity of pressure vectors. Sanctions risk, physical tanker incidents, strategic reserve depletion, and military ambiguity are all active at once. This is historically unusual and accounts for the unusual stickiness of the current $90+ floor. Furthermore, the geopolitical oil price drivers at play here extend well beyond the Middle East alone.
Key Insight: Unlike demand-driven price surges, geopolitical premiums are inherently unstable. They can collapse rapidly when diplomatic signals shift or escalation fears recede, creating asymmetric short-term volatility that favours options traders over directional long positions.
The Strait of Hormuz sits at the epicentre of this risk architecture. Approximately 20% of global oil consumption transits this single narrow passage between Iran and Oman. No other maritime chokepoint in the world concentrates this volume of energy trade into such a geographically constrained corridor.
Where Brent and WTI Stand Right Now
Benchmark Performance: A Structured Snapshot
Brent and WTI futures have tracked an unusual pattern throughout the current conflict cycle, with Brent leading directional moves as Iranian supply risk dominates global sentiment. The following table captures the current pricing environment and contextualises it against recent peak levels:
| Benchmark | Price (Aug 25, 2026) | Daily Change | Notable Level |
|---|---|---|---|
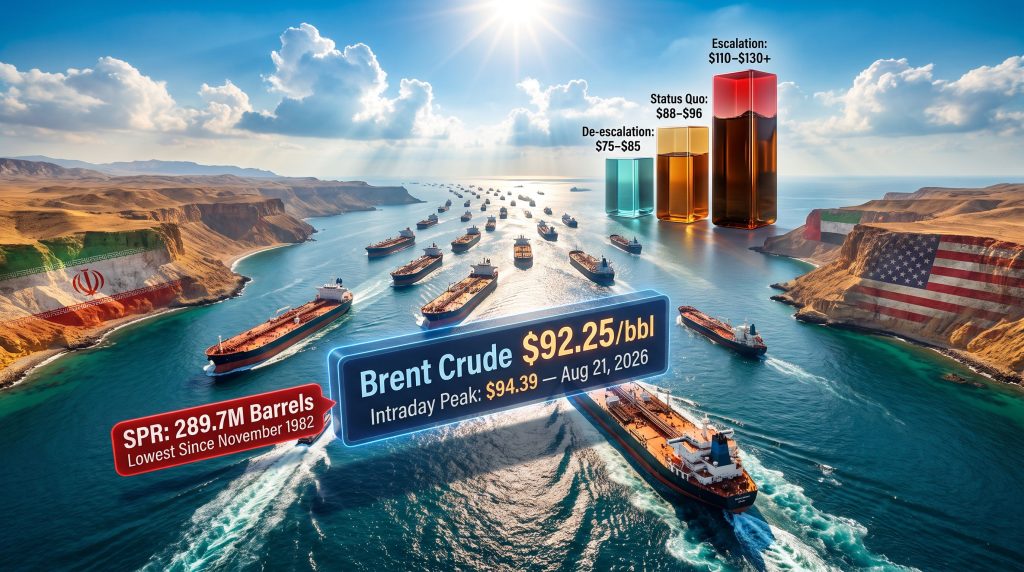
| Brent Crude | $92.25/barrel | +0.09% | $94.39 intraday peak (Aug 21) |
| WTI Crude | $85.31/barrel | +0.35% | Tracking Brent's directional bias |
| Prior Conflict High | ~$126/barrel | N/A | Reached earlier in the conflict |
| Brent Settlement (Aug 24) | $92.17/barrel | Recovery after 2%+ intraday drop | Post-sell-off stabilisation |
The $94.39 intraday high recorded on August 21 is analytically significant. It emerged before the formal sanctions announcement, indicating that derivatives markets had already priced in a meaningful probability of escalation. When the announcement arrived, much of the premium had already been absorbed, which partly explains the subsequent 2% pullback on August 24.
Why Did Oil Slide 2% Before Recovering?
This counterintuitive pattern, where markets sell off after an apparently bullish event such as new sanctions, follows a well-documented behavioural cycle in commodity trading:
- Pre-event positioning builds a premium into futures prices as traders anticipate the catalyst.
- The announcement arrives, and traders lock in gains from positions established during the anticipation phase.
- Ambiguity in implementation creates uncertainty. Treasury Secretary Scott Bessent's announcement notably omitted specific countries facing penalties and provided no concrete enforcement timeline, reducing the perceived immediacy of supply disruption.
- Physical risk reasserts itself, in this case through the tanker incident near Oman, prompting partial recovery.
The result is price consolidation in the $88-$94 range, a pattern consistent with a market in a risk-premium holding pattern rather than trending directionally.
How US Sanctions on Iran Are Reshaping Global Supply Calculations
The Architecture of Financial System Exclusion
The latest expansion of US economic measures targets something more fundamental than Iranian oil exports directly. By threatening to sever access to the dollar-based financial system for any nation continuing commercial ties with Iran, the sanctions create a compliance calculation that extends across every major emerging market energy importer.
This secondary sanctions mechanism works through a tiered pressure model:
- Tier 1 (Primary): Iran itself faces direct asset freezes, export restrictions, and financial transaction prohibitions.
- Tier 2 (Secondary): Third-party nations and corporations trading with Iran risk losing access to USD-denominated correspondent banking, effectively cutting them off from the global trade finance system.
- Tier 3 (Tertiary): Financial institutions that process payments for Tier 2 entities may themselves face penalties, creating a cascading compliance effect.
The absence of named countries and specific timelines in the current announcement is not incidental. It creates maximum compliance uncertainty, which historically forces conservative behaviour among trading partners even before enforcement begins. Consequently, oil markets under trade war pressure are now contending with both financial and physical dimensions of disruption simultaneously.
Policy Watch: The US simultaneously kept military options open, with the Defense Secretary declining to rule out the use of force against Iran. This dual-track approach, economic coercion paired with unresolved military threat, historically amplifies market uncertainty beyond what either lever alone would generate.
Do Sanctions Actually Move Oil Prices Sustainably?
The historical record is instructive but nuanced:
- 2012 Iran sanctions: Brent rose sharply in the 3-month window following implementation but retreated as Saudi Arabia increased output to offset approximately 1 million barrels per day of lost Iranian supply.
- 2018 sanctions reimposition: A similar pattern emerged. Initial spikes were partially neutralised by OPEC+ production flexibility and US shale capacity additions.
The conditions under which sanctions produce durable price floors rather than temporary spikes include:
- Simultaneous OPEC+ supply discipline (currently partially in effect)
- Depleted global strategic reserve buffers (currently confirmed, with US SPR at a 44-year low)
- Concurrent demand growth from Asian importers (partially offset by Chinese economic slowdown concerns)
All three of these conditions are partially present today, which explains why the current sanctions cycle has proven stickier than prior episodes in its price impact. According to recent reporting from The Guardian, Brent crude rose above $90 a barrel for the first time since late July following fresh US pressure on Iran, underscoring how rapidly sentiment can shift on diplomatic signals.
The Strait of Hormuz: A Chokepoint Under Active Physical Threat
Iran's Escalating Jurisdictional Claims
Iran's identification of 45 tankers it alleges violated its rules for Strait transit, accompanied by explicit warnings that cargo confiscation remains a live option, represents an escalation in the operational rather than merely rhetorical threat level. The legal ambiguity surrounding Iran's jurisdictional claims over the Strait is significant: Iran and Oman share sovereignty over the passage under international maritime law, but Iran has repeatedly asserted broader control rights not recognised by the international community.
The tanker strike approximately 9 nautical miles (16.7 km) northeast of Oman's Ash Shishah, confirmed by the United Kingdom Maritime Trade Operations, transformed what had been a theoretical physical risk into a concrete market event. Shipping insurance premiums responded immediately. These geopolitical trade disruptions are increasingly being factored into long-term freight and supply chain planning across major Asian importers.
Mapping the Physical Supply Risk
| Risk Factor | Details | Market Impact |
|---|---|---|
| Tankers flagged by Iran | 45 vessels identified | Shipping insurance premium spike |
| Tanker incident location | ~9 nautical miles NE of Ash Shishah, Oman | Immediate freight disruption signal |
| Strait throughput at risk | ~20% of global oil consumption | Systemic supply shock potential |
| Conflict origin | February 28 (US-Israeli-Iran conflict) | Sustained supply chain disruption |
Why the Strait Cannot Be Easily Replaced
Alternative routing exists on paper but fails practically at the volumes involved:
- East-West Pipeline (Saudi Arabia): Capacity significantly below Hormuz throughput levels and requires Saudi political cooperation.
- Cape of Good Hope routing: Adds approximately 15 days to voyage time for Asian-bound cargoes, dramatically increasing freight and insurance costs.
- Oman-to-Fujairah pipeline: Limited to specific crude grades and does not serve the full range of Hormuz-transiting cargoes.
For India and China, the two largest Asian importers of Gulf crude, there is no cost-effective bypass option. Both nations are therefore disproportionately exposed to any sustained Hormuz disruption, which shapes their diplomatic calculus around compliance with US secondary sanctions.
Strategic Petroleum Reserve Depletion: A Hidden Macro Vulnerability
US Crude Stockpiles at a 44-Year Low
Critical Data Point: US Strategic Petroleum Reserve holdings declined by approximately 3.7 million barrels in a single week, reaching 289.7 million barrels, the lowest recorded level since November 1982, according to data reported by the US Department of Energy.
The significance of the November 1982 baseline extends beyond the headline number. November 1982 predates the 1990-91 Gulf War, the 2003 Iraq invasion, the 2011 Libyan supply disruption, and the 2022 Russia-Ukraine conflict response. In each of these subsequent crises, the US government's ability to deploy SPR releases as a price moderation tool depended on reserve buffers that no longer exist at their prior scale.
Comparing Reserve Levels Across Crisis Periods
| Period | SPR Level (approx.) | Context |
|---|---|---|
| November 1982 | ~289.7M barrels (baseline) | Pre-Gulf War era |
| Post-2022 SPR releases | ~350M+ barrels | Russia-Ukraine conflict response |
| August 2026 | 289.7 million barrels | US-Iran conflict drawdown |
The dual depletion dynamic compounds this vulnerability. Commercial stockpile drawdowns are occurring alongside strategic reserve reductions, meaning both the primary buffer (commercial inventory) and the emergency buffer (SPR) are simultaneously compressed. This structural thinning elevates the market's price floor sensitivity, a condition where smaller supply disruptions produce proportionally larger price spikes than historical models would suggest.
Policy analysts have begun questioning whether the current administration retains sufficient SPR capacity to conduct meaningful market intervention if prices were to accelerate toward the $110-$120 range. However, with Brent crude above $90 amid US sanctions on Iran already a sustained reality, these concerns are no longer theoretical.
The next major ASX story will hit our subscribers first
What Separates the Current Environment from the $126 Peak?
Structural Moderating Factors
Despite active conflict and depleted reserves, Brent has remained well below its prior $126/barrel peak. Several structural factors explain this gap:
- Economic coercion replacing direct military escalation as the dominant US strategy signals lower near-term physical supply disruption risk to markets.
- Chinese demand moderation is creating a demand-side ceiling. Slower-than-expected Chinese economic recovery dampens the upward pressure that would otherwise accompany a tight supply environment.
- OPEC+ spare capacity functions as a partial price ceiling. Saudi Arabia and the UAE retain meaningful production headroom that serves as an implicit market stabiliser.
- US shale responsiveness at the $90+ price level incentivises incremental domestic production increases, adding to global supply over a 3-6 month horizon.
Three Price Trajectories for Brent Crude
The following scenarios represent analytical projections based on current market dynamics and are not investment recommendations. Actual outcomes may differ materially.
| Scenario | Trigger Conditions | Projected Brent Range |
|---|---|---|
| De-escalation | Sanctions compliance by major trading partners; Iran withdraws Strait claims | $75-$85/barrel |
| Status Quo | Ambiguous enforcement; sporadic tanker incidents continue | $88-$96/barrel |
| Escalation | Military action; partial Hormuz blockage | $110-$130+/barrel |
The current price consolidation around $92 is most consistent with the status quo scenario, reflecting a market that has absorbed the primary shock but retains meaningful upside optionality should physical disruption materialise. Furthermore, live Brent crude pricing data from Trading Economics confirms this consolidation pattern, with the benchmark holding broadly within the $88-$96 band observed since the most recent escalation cycle began.
How Global Energy Markets Are Absorbing the Shock
The Non-Western Trading Bloc Dynamic
One of the least appreciated dimensions of the current sanctions environment is the degree to which Iran's crude continues to reach market through non-dollar payment mechanisms. China and India have developed alternative settlement frameworks, including yuan-denominated oil purchases and rupee-dirham bilateral arrangements, that partially circumvent the dollar exclusion threat.
This creates a structural paradox: US secondary sanctions are designed to neutralise Iranian export capacity, yet the acceleration of non-dollar settlement infrastructure among BRICS-aligned nations may simultaneously be accelerating the long-term erosion of dollar weaponisation as a foreign policy tool.
The growing use of alternative payment mechanisms among major energy importers represents a second-order geopolitical consequence of sanctions policy that extends well beyond near-term oil price dynamics.
For energy markets, the practical implication is that sanctions effectiveness is not binary. Iranian crude continues to flow, albeit at discounted prices and through more complex intermediary chains, which partially offsets the supply reduction that benchmark prices are nominally pricing in. In addition, with Brent crude above $90 amid US sanctions on Iran persisting as a structural rather than episodic condition, market participants are reassessing their longer-term hedging frameworks accordingly.
Frequently Asked Questions: Brent Crude, Iran Sanctions, and Oil Market Dynamics
Why Is Brent Crude Above $90 Right Now?
Brent is trading above $90 per barrel due to the convergence of active US financial sanctions targeting Iran, elevated physical supply risk in the Strait of Hormuz, and US strategic petroleum reserves declining to their lowest level since November 1982. These three forces are simultaneously compressing the market's available supply buffer.
What Is the Strait of Hormuz and Why Does It Matter for Oil Prices?
The Strait of Hormuz is a narrow maritime passage between Iran and Oman through which approximately 20% of global oil consumption flows daily. Any credible threat to transit rights immediately elevates the geopolitical risk premium embedded in global crude benchmarks.
How Do US Sanctions on Iran Affect Global Oil Supply?
Primary sanctions restrict Iran's export capacity and financial access. Secondary sanctions extend pressure to third-party nations trading with Iran by threatening their exclusion from the US dollar-based financial system. Historically, sanctions produce temporary spikes with sustained impacts dependent on whether other producers offset the supply reduction.
Why Are US Strategic Petroleum Reserves at Their Lowest Level Since 1982?
Ongoing supply disruptions linked to the US-Israeli-Iran conflict, which began on February 28, have required drawdowns of both commercial and strategic stockpiles. The SPR declined by approximately 3.7 million barrels in a single week to reach 289.7 million barrels.
Could Brent Crude Return to $126 Per Barrel?
While $126 was reached earlier in the conflict, the current US pivot toward economic rather than military pressure has reduced near-term escalation fears. Retesting $126+ would most likely require significant physical disruption to Strait of Hormuz transit or a major direct military engagement.
What Is the Difference Between Brent Crude and WTI Crude?
Brent crude is the international benchmark derived from North Sea production and is most sensitive to geopolitical events affecting global seaborne trade. WTI (West Texas Intermediate) is the US domestic benchmark. Brent typically trades at a premium to WTI given its greater exposure to international supply chain risks.
Key Takeaways: What the $90+ Brent Level Signals for Energy Markets
- The $90+ Brent floor reflects active geopolitical risk pricing, not a fundamental demand-driven supply shortage.
- US sanctions strategy has shifted toward financial system exclusion rather than military threat, which markets interpret as moderating near-term physical supply risk.
- The 289.7 million barrel SPR level represents a structural vulnerability that limits the government's capacity for future price intervention.
- The $94.39 intraday peak on August 21 followed by consolidation near $92 indicates a risk-premium holding pattern awaiting clearer signals on sanctions enforcement.
- Iran's 45-tanker warning and the confirmed tanker strike near Oman demonstrate that physical risk has not been eliminated, only partially repriced by markets.
- The accelerating adoption of non-dollar oil settlement mechanisms among major importers introduces a long-term structural variable that may reduce the future effectiveness of US financial sanctions as a price-driving tool.
Readers seeking additional context on global oil market dynamics and geopolitical risk pricing can explore related energy market analysis published by ET EnergyWorld at energy.economictimes.indiatimes.com, which covers ongoing developments in the oil and gas sector across India and the broader Middle East region. This article contains forward-looking scenario analysis intended for informational purposes only and does not constitute financial or investment advice.
Want to Capitalise on the Next Major Resource Discovery Before the Broader Market?
While geopolitical forces reshape global energy pricing, significant mineral discoveries on the ASX can deliver equally compelling opportunities — and timing is everything. Discovery Alert's proprietary Discovery IQ model instantly identifies high-potential ASX mineral announcements across more than 30 commodities, giving subscribers an immediate market edge; explore historic discovery returns on Discovery Alert's dedicated discoveries page and begin a 14-day free trial to position yourself ahead of the market.