
August 25, 2026
Why the LME Forward Curve Matters More Than the Headline Price
Most market observers focus on the headline aluminium price when assessing market health. Yet experienced traders and physical buyers know that the real intelligence lies beneath the surface, embedded in the structure of the forward curve, the composition of warehouse inventories, and the subtle mechanics of warrant cancellations. When these signals begin to diverge from headline stock figures, they often foreshadow conditions that the spot price alone cannot reveal.
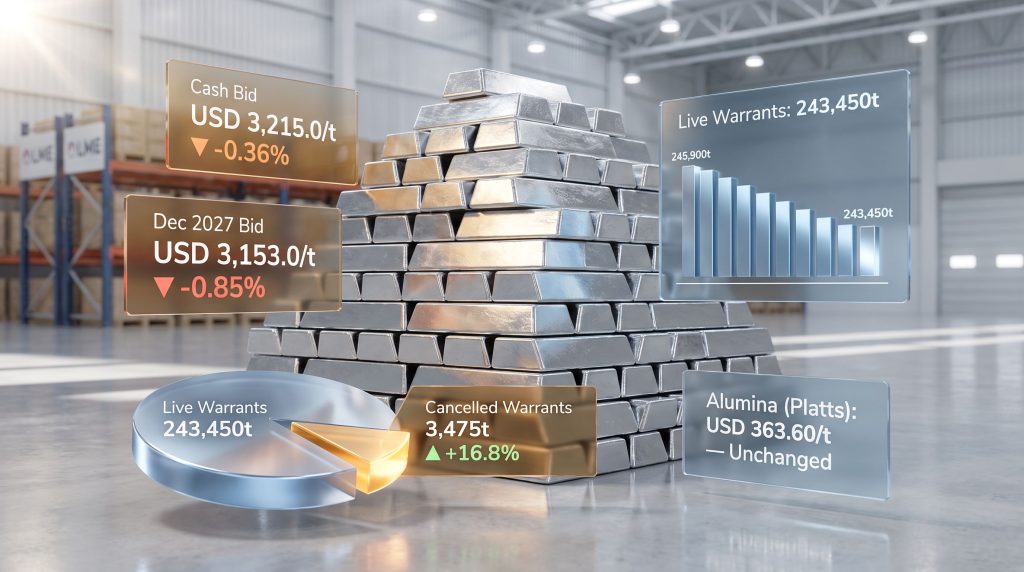
On August 24, 2026, the LME aluminium cash bid falls and live warrants decline simultaneously, creating a confluence of signals that rewards closer examination. The cash bid dropped to USD 3,215 per tonne, down from USD 3,226.5 per tonne on August 21, representing a fall of USD 11.5 per tonne or 0.36%. More telling, however, was the steeper decline registered at the long end of the forward curve, where the December 2027 contract shed USD 27 per tonne or 0.85%, settling at a bid of USD 3,153 per tonne. This differential between near-term and long-dated price movements tells a more nuanced story about market expectations than any single data point could convey.
When big ASX news breaks, our subscribers know first
A Complete Picture of LME Aluminium Pricing Across All Tenors
Understanding how prices shifted across the full LME pricing ladder provides essential context. The table below captures the session-on-session movement across all key benchmarks.
| Price Benchmark | Previous Session (USD/t) | Latest Session (USD/t) | Change (USD/t) | % Change |
|---|---|---|---|---|
| Cash Bid | 3,226.5 | 3,215.0 | -11.5 | -0.36% |
| Cash Offer | 3,227.0 | 3,215.5 | -11.5 | -0.36% |
| 3-Month Bid | 3,242.0 | 3,233.0 | -9.0 | -0.28% |
| 3-Month Offer | 3,244.0 | 3,235.0 | -9.0 | -0.28% |
| Dec 27 Bid | 3,180.0 | 3,153.0 | -27.0 | -0.85% |
| Dec 27 Offer | 3,185.0 | 3,158.0 | -27.0 | -0.85% |
| Asian Reference | 3,237.5 | 3,228.5 | -9.0 | -0.28% |
| Alumina (Platts) | 363.60 | 363.60 | 0.00 | Unchanged |
The data reveals an important gradient: losses intensify as the tenor extends. Cash prices declined 0.36%, three-month contracts fell 0.28%, and the December 2027 contracts dropped 0.85%. This steepening of bearish pressure toward the long end indicates that market participants are pricing in weaker conditions over a multi-year horizon, rather than expecting a near-term correction to reverse quickly. Furthermore, surging LME trading volumes in recent periods have amplified the significance of these directional moves across the curve.
Decoding the Forward Curve Structure
The LME pricing architecture operates across a spectrum of settlement dates. The cash price reflects the most immediate market sentiment, functioning as a real-time indicator of spot demand and physical availability. The three-month contract serves as the global benchmark used most widely for hedging and physical supply contract pricing. Settlements extending to December 2027 provide visibility into long-term market expectations.
A critical feature of the current curve structure is the relationship between spot and forward prices. With the December 2027 bid at USD 3,153 per tonne sitting approximately USD 62 per tonne below the current cash bid of USD 3,215 per tonne, the market is pricing in an expectation of softer conditions over the medium-to-long term. This is not a contango structure, where forward prices exceed spot, which typically signals oversupply. Instead, the pattern reflects an expectation that demand conditions will ease, or that supply additions will gradually absorb current physical tightness.
The Asian reference price, which stood at USD 3,228.5 per tonne on August 24 compared to USD 3,237.5 per tonne previously, functions as a regional pricing anchor for physical market participants operating during Asian trading hours. Its alignment with London price direction confirms that bearish sentiment is not isolated to one trading session or geography.
The Warrant Mechanics That Headline Stock Figures Obscure
Perhaps the most instructive element of the August 24 session data involves the warehouse inventory breakdown. At first glance, total opening stocks appear static at 246,925 tonnes for both August 21 and August 24. This headline figure, however, conceals a meaningful shift in the underlying warrant structure.
| Inventory Metric | Previous Session | Latest Session | Change |
|---|---|---|---|
| Opening Stocks | 246,925t | 246,925t | Unchanged |
| Live Warrants | 243,950t | 243,450t | -500t (-0.21%) |
| Cancelled Warrants | 2,975t | 3,475t | +500t (+16.8%) |
Live warrants contracted by 500 tonnes to 243,450 tonnes, while cancelled warrants increased by the same volume, rising 16.8% to 3,475 tonnes. This one-for-one conversion is mechanically significant. It means that metal is being earmarked for physical withdrawal from LME-registered storage facilities, reducing the pool of immediately tradeable inventory even as total headline stock remains unchanged.
Why Cancelled Warrants Are the Signal Most Investors Miss
A cancelled warrant is not simply an accounting entry. It represents a deliberate decision by a warrant holder, typically a trading house, physical consumer, or warehouse operator, to remove metal from the LME system entirely. Once cancelled, that metal can no longer be used to settle LME futures contracts or traded through the exchange's clearing mechanism.
The practical implication is that effective tradeable supply contracts even when total warehouse stock does not. For physical buyers relying on LME delivery mechanisms, a rising proportion of cancelled warrants tightens the available pool in ways that pure inventory figures do not communicate. According to Reuters, the distinction between noise and signal in LME stock movements is precisely this kind of warrant compositional shift.
Looking at the trajectory of live warrants across recent sessions reinforces this trend:
- 245,900 tonnes (earlier session)
- 245,400 tonnes (following session)
- 243,950 tonnes (August 21)
- 243,450 tonnes (August 24)
This consistent directional erosion across multiple consecutive sessions is not noise. It reflects a sustained pattern of physical withdrawal intent that, if it continues, may ultimately translate into visible stock drawdowns in future reporting periods.
What Drives Warrant Cancellation Behaviour?
Cancelled warrant volumes tend to fluctuate in response to several overlapping factors. Regional physical premiums play a significant role: when the premium paid for metal delivered to a specific location rises above the cost of withdrawing and transporting LME-warehoused stock, traders find it economically rational to cancel warrants and redirect physical material.
Inventory repositioning outside the LME system for long-term storage or sale to end-users is another common driver. Occasionally, cancelled warrant spikes precede visible market tightening, giving observant market participants an early warning of impending physical supply pressure. In addition, base metal pricing delays can compound the difficulty of interpreting warrant data in real time, further obscuring the underlying trend.
Demand and Supply Dynamics Pressing on LME Cash Pricing
The decline in LME aluminium cash bid prices does not occur in isolation. It reflects broader market forces that have been building across both the demand and supply sides of the global aluminium equation.
China's Destocking Cycle and Its Pricing Ceiling
China remains the world's dominant force in aluminium consumption and production. The country accounts for more than half of global primary aluminium output and a similarly commanding share of consumption. When Chinese demand softens, or when domestic market participants engage in destocking cycles, the effects reverberate across LME pricing. China industrial demand trends have consequently become one of the most closely tracked variables among global aluminium market participants.
Continued destocking of aluminium ingot inventories within China has been a persistent feature of recent market conditions. When downstream Chinese fabricators and traders reduce their inventory holdings rather than purchasing fresh material, it creates a structural ceiling on price recovery. Import demand softens, domestic spot prices slip, and the feedback loop suppresses international benchmark pricing including LME cash bids.
This dynamic is not unique to the current cycle. Chinese aluminium ingot inventory patterns have historically exhibited a pronounced seasonal rhythm, with destocking phases often coinciding with periods of subdued downstream manufacturing activity. The key question for traders and analysts is whether the current destocking phase represents a temporary inventory correction or a more durable demand slowdown.
Upstream Cost Stability: What Alumina Prices Reveal
One factor that has not added pressure to aluminium pricing from the supply side is feedstock cost. The Platts alumina benchmark held flat at USD 363.60 per tonne on August 24, unchanged from the prior session. Alumina accounts for approximately 30 to 35% of the operating cost of primary aluminium smelters, making it one of the most direct cost-push inputs in the production chain.
Stable alumina pricing signals that smelters are not facing tightening input costs that might otherwise incentivise production cuts or force price increases. This limits any supply-side support for aluminium prices in the near term. If alumina were rising sharply, smelters in higher-cost regions might begin curtailing output, reducing LME supply and providing a price floor. The current stable feedstock environment removes that potential support mechanism.
Macro Context: Currency, Trade Policy, and Manufacturing Activity
USD-denominated LME benchmarks are also sensitive to broader currency dynamics. A stronger US dollar makes aluminium more expensive in local currency terms for buyers outside the United States, typically softening demand and applying downward pressure to USD prices. However, US aluminium tariffs have introduced an additional layer of complexity, redirecting physical trade flows and distorting regional premium structures in ways that can temporarily decouple LME benchmark pricing from physical market realities.
Global manufacturing PMI trends similarly influence aluminium demand cycles, as the metal is deeply embedded in automotive, packaging, construction, and aerospace supply chains.
Essential Terminology for LME Aluminium Market Participants
For those newer to the mechanics of LME pricing and warehouse inventory dynamics, the following definitions clarify the key concepts underpinning the data discussed above.
- Cash Bid Price: The price at which a buyer is willing to purchase aluminium for immediate LME settlement, and the most direct measure of spot market sentiment.
- Live Warrants: Metal stored in LME-registered warehouses that remains freely available for trading and physical delivery through the exchange.
- Cancelled Warrants: Metal that has been designated for withdrawal from LME warehouses. It is no longer available for exchange trading or to settle futures contracts.
- 3-Month Contract Price: The primary global benchmark for aluminium pricing, used widely in physical supply contracts and hedging strategies.
- Asian Reference Price: A session-specific pricing benchmark established during Asian trading hours, providing a regional anchor for physical market transactions.
- Contango: A forward curve structure where longer-dated prices exceed spot prices, typically associated with oversupply or low physical demand.
- Backwardation: The inverse condition, where spot prices exceed forward prices, often indicating near-term physical tightness.
Practical Implications for Physical Buyers and Hedgers
The pricing and inventory signals emerging from the August 24 session carry distinct practical implications depending on the market participant's position and time horizon.
For downstream manufacturers in sectors such as automotive, packaging, and construction, a softening LME cash bid reduces the reference cost for aluminium procurement contracts linked to LME benchmarks. However, the simultaneous contraction in live warrants introduces a counterbalancing risk: physical availability through LME delivery mechanisms is narrowing, which could widen regional physical premiums paid above the LME benchmark.
For hedgers and treasury teams, the steeper decline in December 2027 forward prices relative to spot creates a potential opportunity to lock in longer-dated hedges at relatively low levels. Effective commodity hedging strategies become particularly important when the forward curve is signalling prolonged weakness, as locking in pricing certainty can provide material cost advantages over competitors relying on spot exposure.
The spread between current LME cash prices and December 2027 settlements of approximately USD 62 per tonne represents the market's current assessment of the expected price trajectory over roughly 28 months. Whether this discount widens or narrows in coming sessions will be among the most closely watched indicators of shifting market sentiment.
The next major ASX story will hit our subscribers first
Key Indicators to Monitor in Upcoming Sessions
The data from August 24 establishes a clear set of metrics worth tracking as conditions evolve.
- Cancelled warrant trajectory: If cancellations continue rising as a proportion of total LME stock, visible drawdowns in opening inventory figures may follow within days or weeks.
- Cash-to-forward spread evolution: A widening discount on December 2027 contracts would deepen bearish medium-term expectations, while a narrowing would suggest recovering confidence.
- Chinese demand signals: Any improvement in downstream Chinese manufacturing activity or a shift from destocking to restocking behaviour would be among the most powerful potential catalysts for a price floor.
- Alumina price movement: Any breakout from the current flat alumina price trend would signal changes in smelter cost economics and potential production dynamics.
- Regional physical premiums: Rising premiums in key consuming regions such as Japan, South Korea, or Europe would indicate tightening physical availability beyond what LME warrant data currently shows.
Summary of Critical Market Signals
The August 24 session delivered a coherent, if cautious, set of market signals. When the LME aluminium cash bid falls and live warrants decline together, the combination warrants attention beyond what either data point conveys in isolation. Furthermore, Al Circle's analysis of recent LME aluminium price movements confirms that declining stocks and cancelled warrants have been a consistent feature across multiple recent sessions, reinforcing the directional signals present in the August 24 data.
- Cash bid declined 0.36% to USD 3,215/t, reflecting softening immediate spot demand.
- Forward prices fell harder at -0.85% for December 2027, pointing to bearish medium-term market expectations.
- Live warrants contracted by 500 tonnes to 243,450 tonnes, tightening tradeable physical inventory.
- Cancelled warrants rose 16.8% to 3,475 tonnes, signalling sustained physical withdrawal intent across multiple sessions.
- Total opening stocks remained flat at 246,925 tonnes, masking the underlying warrant compositional shift.
- Alumina held at USD 363.60/t, confirming no upstream cost-push pressure currently supporting aluminium prices from the supply side.
- Asian reference price eased 0.28% to USD 3,228.5/t, confirming cross-regional alignment with the London price direction.
Disclaimer: This article is intended for informational purposes only and does not constitute financial advice. All price and inventory data referenced relates to the August 24, 2026 LME session. Market conditions are subject to rapid change, and past pricing patterns do not guarantee future outcomes. Readers should conduct independent research or consult qualified financial advisers before making investment or procurement decisions.
Want to Stay Ahead of the Next Major Mineral Discovery on the ASX?
While LME forward curves and warrant mechanics reveal the deeper signals within commodity markets, Discovery Alert's proprietary Discovery IQ model translates complex ASX mineral discovery announcements into real-time, actionable alerts — helping both traders and long-term investors identify significant opportunities the moment they emerge. Explore historic discoveries and their market returns, then begin your 14-day free trial to gain a market-leading edge before the broader market catches on.