July 9, 2026
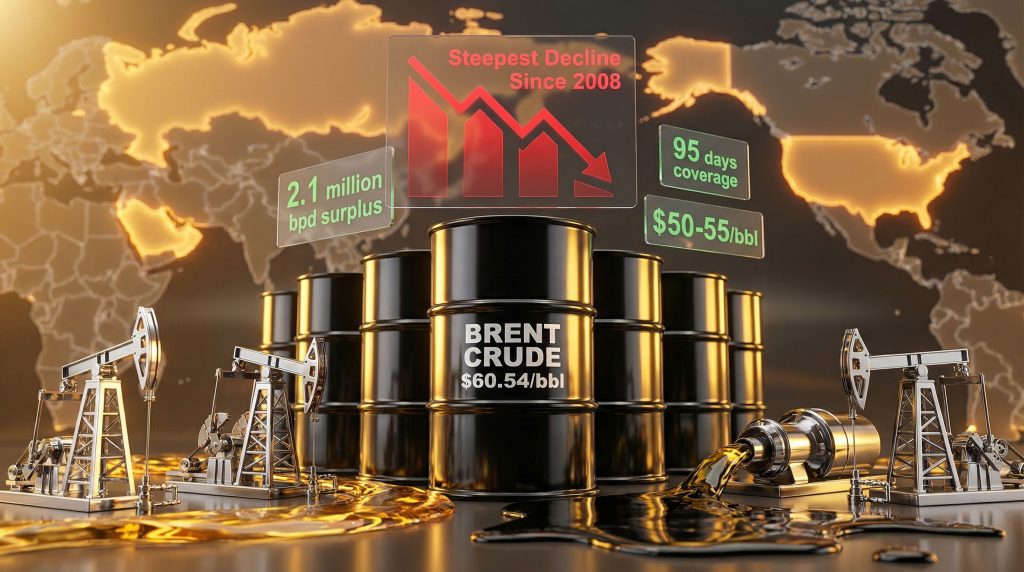
The global petroleum landscape has entered a phase of dramatic realignment, with the Brent crude price drop accelerating through traditional support levels that previously provided market stability. December 2025 witnessed Brent crude futures falling to $59.96 per barrel, marking the first breach below the psychologically critical $60 threshold since May 2025. This decline represents a continuation of broader pricing pressures that have characterised the energy complex throughout 2025.
Market fundamentals indicate that global oil surplus conditions have reached 2.1 million barrels per day, representing a substantial increase from 2024's average surplus of 0.8 million barrels per day. These inventory builds occur against a backdrop of storage infrastructure operating at elevated utilisation rates, with OECD inventory levels currently providing 95 days of coverage compared to the 2024 average of 88 days coverage.
The magnitude of current price pressures becomes apparent when examining the trajectory from 2024 baseline conditions. Brent averaged approximately $79.80 per barrel through 2024, establishing a pricing foundation that has deteriorated significantly as supply-demand imbalances intensified. West Texas Intermediate crude has similarly declined, trading around $56 per barrel in mid-December 2025, reflecting comparable pressure across North American pricing benchmarks.
Economic implications of this Brent crude price drop extend across multiple sectors and geographical regions. Energy-importing nations benefit from reduced input costs that support manufacturing competitiveness and consumer purchasing power, while energy-exporting economies face fiscal pressures as government revenues decline alongside commodity prices. This divergence creates macroeconomic tensions that influence currency markets, trade balances, and investment flows.
Furthermore, these market conditions demonstrate how tariff market impact interconnects with commodity pricing as global trade dynamics evolve.
The current oil market crisis reflects structural oversupply conditions that may persist well into 2026, challenging traditional seasonal recovery patterns and requiring fundamental reassessment of global energy balance assumptions.
Storage capacity constraints represent a critical factor amplifying price pressures. As global inventory builds approach infrastructure limitations, market participants face increasing pressure to reduce acquisition prices or defer purchases entirely. This dynamic creates a feedback loop where storage saturation forces additional price concessions, accelerating the downward momentum in crude valuations.
Understanding the Current Oil Market Crisis
Global petroleum markets confront unprecedented supply abundance driven by coordinated production increases across multiple producing regions. OPEC+ member nations have implemented production quota adjustments that collectively introduce significant additional barrels to international markets, fundamentally altering the supply-demand equation that previously supported higher price levels.
Current OPEC+ production strategies reflect a departure from the organisation's historical approach of maintaining artificial supply constraints to support pricing. Recent ministerial decisions have authorised production increases that collectively add substantial daily output to global markets. Saudi Arabia, as the organisation's largest producer, maintains production levels approaching 8.8 to 9.0 million barrels per day, while other major producers including the UAE, Kuwait, and Iraq contribute additional volumes according to revised quota allocations.
Non-OPEC supply growth presents equally significant pressures on global market balance. United States shale production continues operating at elevated levels exceeding 13.5 million barrels per day, sustained by technological improvements and operational efficiencies that maintain profitability even at current reduced price levels. Canadian oil sands operations contribute approximately 5.5 to 6.0 million barrels per day, providing consistent supply that competes directly with conventional crude sources.
Emerging production centres in South America add further complexity to global supply dynamics. Guyana's offshore developments have rapidly scaled to exceed 400,000 barrels per day, with expansion projects scheduled to increase output substantially through 2026. Brazilian pre-salt production from ultra-deepwater fields maintains growth trajectories that position the nation as an increasingly significant supplier to international markets.
Consequently, understanding these oil rally dynamics becomes essential for comprehending market volatility patterns.
Key Supply Contributors:
• U.S. shale formations: 13.5+ million bpd with breakeven costs estimated at $40-50/barrel
• Canadian oil sands: 5.5-6.0 million bpd with higher breakeven requirements of $55-75/barrel
• Guyana offshore: 400,000+ bpd from rapidly expanding deepwater projects
• Brazilian pre-salt: Continued growth from ultra-deepwater conventional resources
• OPEC+ collective: 28-29 million bpd with recent production quota increases
Storage infrastructure limitations exacerbate supply abundance effects by creating physical bottlenecks that force inventory accumulation. Global crude storage utilisation approaches capacity constraints in key trading hubs, particularly affecting Atlantic Basin markets where European and North American storage facilities experience elevated inventory levels. This storage saturation creates additional downward pressure on prices as market participants seek alternatives to expensive storage arrangements.
When big ASX news breaks, our subscribers know first
What Economic Forces Are Behind the Brent Crude Price Drop?
Structural Supply Oversupply Analysis
Futures market structure reflects underlying supply abundance through contango pricing patterns, where forward-month contracts trade at premiums to near-term deliveries. This pricing structure incentivises inventory accumulation by traders seeking to capture the differential between current spot prices and higher forward valuations. However, contango conditions also signal market expectations that current oversupply conditions will persist, potentially for extended periods.
The interaction between diverse supply sources creates competitive dynamics that traditional market models struggle to accommodate. Unlike historical periods when OPEC production adjustments provided primary market balancing mechanisms, current conditions feature multiple independent producers operating according to distinct economic incentives and cost structures.
Additionally, the relationship between oil trade war impact and current market dynamics reveals how geopolitical tensions affect pricing structures.
Demand-Side Economic Pressures
Global economic growth deceleration contributes significantly to reduced petroleum consumption patterns that amplify existing supply pressures. Industrial production indices across major economies indicate moderated expansion rates compared to post-pandemic recovery periods, directly affecting oil demand growth in manufacturing, transportation, and petrochemical sectors.
Regional consumption patterns reveal particular weakness in traditionally strong demand centres. Asia-Pacific markets, historically driving incremental oil demand growth, exhibit reduced consumption expansion as economic growth moderates and energy transition initiatives accelerate. Chinese crude oil imports, typically exceeding 8 to 9 million barrels per day, reflect changing domestic consumption patterns influenced by electric vehicle adoption and industrial restructuring.
Energy transition impacts create structural headwinds for petroleum demand growth across multiple consumption categories. Transportation sector transformation through electric vehicle penetration reduces petrol consumption in developed markets, while renewable energy expansion displaces oil-fired power generation in emerging economies. These transitions represent permanent demand destruction that cannot be offset by temporary economic recovery.
Demand Pressure Factors:
• Global GDP growth deceleration affecting industrial consumption
• Electric vehicle adoption reducing transportation fuel demand
• Renewable energy expansion displacing oil-fired power generation
• Chinese economic restructuring moderating import requirements
• Developed market efficiency improvements reducing per-capita consumption
Manufacturing sector consumption shows particular sensitivity to current economic conditions, as industrial production adjustments directly translate to reduced petroleum product requirements. Petrochemical feedstock demand exhibits volatility correlated with construction activity and consumer goods production, both sectors experiencing moderated growth compared to previous periods.
In addition, tariffs and inflation trends contribute to broader economic uncertainty affecting commodity demand patterns.
Why Are Traditional Price Support Mechanisms Failing?
Geopolitical Risk Premium Erosion
Historical pricing models for petroleum markets incorporate risk premiums that reflect potential supply disruptions from geopolitical instability. These premiums typically add $5 to $15 per barrel to baseline commodity valuations, depending on the perceived severity and probability of supply interruptions. Current market conditions demonstrate significant erosion of these traditional risk premiums as geopolitical tensions show signs of resolution.
Ukraine-Russia conflict dynamics have evolved substantially, with diplomatic initiatives suggesting potential pathways toward negotiated settlements. Market participants previously factored ongoing warfare risks into petroleum pricing, recognising that escalation could disrupt Russian energy exports or Ukrainian transit infrastructure. Recent diplomatic developments have reduced these disruption probabilities, contributing to risk premium compression.
According to recent reports, progress on Ukraine peace deal negotiations has directly contributed to reduced risk premiums in oil pricing.
Middle East stability improvements provide additional factors supporting risk premium erosion. Regional tensions that historically supported elevated petroleum pricing through supply disruption concerns have moderated, reducing market participants' willingness to pay insurance premiums for potential Middle Eastern supply interruptions.
Risk Premium Compression Factors:
• Ukrainian conflict resolution prospects reducing supply disruption fears
• Middle Eastern stability improvements lowering regional risk assessments
• Strategic petroleum reserve policies providing supply security buffers
• Diversified global supply sources reducing single-point-of-failure risks
Strategic petroleum reserve policies implemented by major consuming nations provide additional market stability that reduces traditional risk premium requirements. Government stockpiling strategies create supply security buffers that market participants recognise as mitigating factors for potential geopolitical disruptions.
Financial Market Dynamics
Institutional investment flows reflect changing sentiment toward energy sector allocations, as environmental, social, and governance (ESG) criteria influence portfolio construction decisions. Major institutional investors have reduced energy sector weightings in response to climate transition concerns and regulatory pressures, limiting capital availability for petroleum-related investments.
Currency dynamics add complexity to petroleum pricing as U.S. dollar strength affects commodity valuations denominated in the American currency. Dollar appreciation makes petroleum more expensive for international buyers using alternative currencies, reducing effective demand and contributing to pricing pressures.
Futures market positioning reveals institutional sentiment through commitment of traders reports and large speculative positions. Current positioning indicates reduced bullish sentiment among managed money accounts, suggesting that traditional price support from financial market participants has diminished.
What Do Current Market Indicators Reveal About Future Trends?
Technical Analysis Framework
Chart-based analysis of Brent crude price drop patterns reveals significant technical deterioration that suggests continued downward pressure. The breach below $60 per barrel represents penetration through a key psychological and technical support level that had provided price stability since May 2025. This breakdown signals potential for further decline toward the next significant support zone in the $55 to $58 range.
Trading volume analysis during recent price declines indicates broad-based selling pressure rather than isolated position adjustments. Higher-than-average trading volumes accompanying price decreases suggest institutional participation in the downward movement, indicating conviction among market participants regarding continued weakness.
Volatility measurements provide insights into market uncertainty and trend sustainability. Current volatility levels remain elevated compared to periods of stable pricing, reflecting ongoing uncertainty about fundamental market balance resolution. This volatility suggests that market participants lack consensus regarding appropriate pricing levels under current supply-demand conditions.
Technical Indicator Analysis:
| Indicator | Current Level | Trend Direction | Support/Resistance |
|---|---|---|---|
| Brent Crude | $59.96 | Bearish | Support: $55-58, Resistance: $65-68 |
| RSI (14-day) | Below 40 | Oversold Territory | Potential bounce zone |
| Moving Averages | Below 50/200 day | Bearish crossover | Downtrend confirmation |
| Volume | Above average | High conviction selling | Institutional participation |
Momentum indicators including relative strength index (RSI) and moving average convergence divergence (MACD) show continued bearish signals that support expectations for additional price weakness. These technical measures suggest that the current Brent crude price drop maintains downward momentum without significant reversal signals.
Forward Curve Analysis
Petroleum futures curves reveal market expectations for pricing evolution through forward time periods. Current curve structure displays contango conditions where longer-dated contracts trade at premiums to near-term deliveries, indicating market expectations that current low prices will gradually recover over time.
The Energy Information Administration projects $50 to $55 per barrel pricing ranges may prove sustainable through 2026, representing significant reductions from historical averages. These official forecasts incorporate supply-demand balance projections that account for both continued supply growth and moderated demand expansion.
Seasonal demand patterns typically provide winter support for petroleum pricing in Northern Hemisphere markets, but current conditions suggest limited seasonal uplift potential. Heating oil and propane demand face competition from alternative energy sources and improved efficiency measures that reduce traditional winter price support mechanisms.
Forward Curve Projections:
• 2026 Average Forecast: $50-55/barrel (EIA baseline scenario)
• 2027 Recovery Potential: $60-65/barrel (assuming supply-demand rebalancing)
• Long-term Structural Level: $55-70/barrel (post-transition equilibrium)
• Seasonal Variation: Limited winter premium due to demand structure changes
Long-term structural changes present the most significant uncertainty for future pricing evolution. Accelerating energy transitions, permanent efficiency improvements, and evolving transportation systems may create permanent demand destruction that prevents recovery to historical price levels.
How Are Different Market Participants Responding?
Producer Strategy Adaptations
Global petroleum producers implement diverse operational and financial strategies to navigate the challenging pricing environment created by the Brent crude price drop. Cost structure optimisation has become a primary focus across all producer categories, from international oil companies to national oil companies and independent operators.
Breakeven price improvements through operational efficiency represent the most critical adaptation strategy. U.S. shale operators have reduced operational breakeven costs to approximately $40 to $50 per barrel through improved drilling techniques, completion optimisation, and infrastructure development. These cost reductions allow continued operations even at current reduced price levels.
Producer Breakeven Analysis by Region:
| Producer Type | Breakeven Cost Range | Current Viability | Strategic Response |
|---|---|---|---|
| Middle East OPEC | $15-25/barrel | Highly profitable | Market share focus |
| U.S. Shale | $40-50/barrel | Marginally profitable | Efficiency improvements |
| Canadian Oil Sands | $55-75/barrel | Break-even/loss | Production optimisation |
| Deepwater Projects | $60-80/barrel | Challenged | Development delays |
| Russian Arctic | $35-45/barrel | Profitable | Sanctions impact |
Capital expenditure adjustments represent another critical adaptation mechanism. Many operators have deferred or cancelled expansion projects that require higher price assumptions for economic justification. Deepwater developments and oil sands projects face particular scrutiny due to high capital requirements and extended payback periods.
Hedging strategies have evolved to provide downside protection against continued price weakness. Producers increasingly utilise options-based hedging programmes that provide price floors while maintaining upside participation potential. These risk management approaches allow operational planning despite pricing uncertainty.
Consumer Market Implications
Energy-intensive industries benefit substantially from reduced petroleum costs, improving manufacturing competitiveness and profit margins. Petrochemical producers, in particular, experience improved economics as feedstock costs decline relative to product pricing. This cost advantage supports industrial expansion in regions with competitive energy costs.
Transportation sector participants realise significant operational cost reductions through lower fuel expenses. Airlines, shipping companies, and trucking operators experience improved margins that can support service expansion or competitive pricing strategies. These benefits partially offset broader economic pressures affecting demand for transportation services.
Consumer Sector Benefits:
• Airlines: Reduced fuel costs improving operational margins
• Shipping: Lower bunker fuel expenses supporting freight competitiveness
• Manufacturing: Reduced energy input costs improving production economics
• Petrochemicals: Favourable feedstock-to-product price spreads
• Utilities: Lower fuel oil costs for backup power generation
Refining sector dynamics reveal complex interactions between crude oil costs and refined product pricing. Lower crude costs typically improve refining margins, but demand weakness for refined products can limit the benefits of reduced input costs. Regional refining capacity utilisation rates reflect these competing influences.
What Are the Broader Economic Implications?
Macroeconomic Transmission Mechanisms
The Brent crude price drop creates cascading economic effects that extend far beyond energy markets, influencing inflation dynamics, currency valuations, and fiscal policies across diverse economies. Disinflationary pressures from reduced energy costs provide central banks with additional policy flexibility while supporting real purchasing power for consumers and businesses.
Inflation calculations incorporate energy costs as significant components, meaning sustained petroleum price reductions directly reduce headline inflation measures. This disinflationary effect allows central banks to maintain accommodative monetary policies without concerning about energy-driven inflation acceleration.
Currency market effects reflect the divergent impacts on oil-exporting versus oil-importing nations. Energy-exporting countries experience currency pressure as reduced export revenues affect trade balances and foreign exchange earnings. Conversely, energy-importing nations benefit from improved trade balances and reduced current account deficits.
Macroeconomic Impact Assessment:
| Economic Variable | Oil Exporters | Oil Importers | Global Impact |
|---|---|---|---|
| Inflation Pressure | Deflationary | Disinflationary | Net disinflationary |
| Currency Valuation | Weakening pressure | Strengthening support | USD strength bias |
| Fiscal Balance | Revenue pressure | Cost relief | Mixed regional impacts |
| Trade Balance | Deteriorating | Improving | Rebalancing effect |
Fiscal policy implications vary dramatically based on government dependence on energy-related revenues. Oil-exporting nations face budget pressures requiring either expenditure reductions or alternative revenue sources, while importing nations benefit from reduced energy subsidies and import costs.
Regional Economic Divergence
Energy-exporting economies confront fundamental challenges as government revenues decline alongside petroleum pricing. Nations with high fiscal breakeven oil prices face particular pressure to implement austerity measures or seek alternative financing sources. These adjustments can create social and political tensions that influence regional stability.
Gulf Cooperation Council (GCC) nations, despite relatively low production costs, require higher oil prices to balance government budgets that support extensive social programmes and infrastructure development. Current pricing levels create fiscal pressures that may require significant policy adjustments.
Regional Fiscal Breakeven Analysis:
• Saudi Arabia: Estimated fiscal breakeven ~$80-85/barrel
• UAE: Fiscal breakeven ~$75-80/barrel
• Russia: Fiscal breakeven ~$60-70/barrel
• Nigeria: Fiscal breakeven ~$120-130/barrel
• Venezuela: Fiscal breakeven ~$100-110/barrel
Energy-importing regions experience contrasting benefits that support economic expansion and competitiveness. European nations reduce energy import costs that had created substantial trade balance pressures, while Asian economies benefit from reduced manufacturing input costs that support export competitiveness.
The next major ASX story will hit our subscribers first
Strategic Investment Considerations
Portfolio Allocation Strategies
Investment portfolio construction faces fundamental challenges as traditional energy sector allocations require reassessment in light of structural market changes driving the Brent crude price drop. Energy sector equity valuations reflect both current earnings pressure and uncertainty about long-term business model sustainability.
Defensive positioning strategies focus on energy companies with lowest production costs and strongest balance sheets capable of surviving extended low-price environments. Integrated oil companies with diversified operations including refining and chemicals may provide better defensive characteristics than pure-play exploration and production companies.
Opportunistic investment approaches identify potential value creation opportunities among energy assets trading at distressed valuations. However, these strategies require careful analysis of fundamental business sustainability and potential for operational improvements rather than relying on commodity price recovery assumptions.
Investment Strategy Framework:
| Strategy Type | Target Assets | Risk Profile | Expected Returns |
|---|---|---|---|
| Defensive Energy | Low-cost producers | Medium risk | Stable dividends |
| Opportunistic Value | Distressed assets | High risk | High potential returns |
| Energy Transition | Renewables/efficiency | Medium risk | Growth potential |
| Diversification | Non-energy sectors | Variable | Market correlation |
Geographic diversification considerations reflect varying regional impacts of petroleum price changes. Investments in energy-importing regions may benefit from improved economic conditions, while energy-exporting regions face economic headwinds that affect broader investment attractiveness.
Long-term Structural Shifts
Energy transition acceleration reflects both policy initiatives and economic competitiveness improvements for renewable energy technologies. Lower petroleum prices paradoxically may accelerate transition efforts as governments seek energy security through domestic renewable resources rather than imported fossil fuels.
Technology disruption in transportation through electric vehicle adoption creates permanent demand destruction for petroleum products that cannot be reversed by temporary price reductions. This structural change requires fundamental reassessment of long-term petroleum demand projections.
ESG investment criteria increasingly influence institutional capital allocation decisions, reducing available funding for petroleum-related projects while increasing capital availability for renewable energy and efficiency technologies. These capital flow changes accelerate energy transition timelines.
Structural Transition Indicators:
• Electric vehicle sales growth: 25-30% annually in developed markets
• Renewable energy capacity additions: 200+ GW annually globally
• Energy efficiency improvements: 2-3% annual intensity reductions
• ESG investment flows: $30+ trillion in sustainable investing assets
Digital transformation within traditional energy industries provides opportunities for operational efficiency improvements that can reduce costs and environmental impacts. Artificial intelligence, automation, and advanced analytics enable optimisation strategies previously unavailable to energy producers.
Market Outlook and Risk Assessment
Scenario Analysis Framework
Future petroleum market evolution depends on multiple interacting variables that create diverse potential outcomes requiring scenario-based analysis rather than single-point forecasts. Base case scenarios assume continued oversupply conditions through 2026 with gradual market rebalancing as demand growth eventually matches supply capacity.
The baseline projection incorporates current supply growth trajectories from U.S. shale, OPEC+ production policies, and emerging supply sources while assuming moderate global economic growth supporting gradual demand recovery. Under these assumptions, Brent crude price drop conditions may persist with trading ranges between $50 to $65 per barrel through 2026.
Upside risk scenarios identify potential catalysts for price recovery including geopolitical supply disruptions, unexpected demand acceleration from economic stimulus programmes, or OPEC+ production discipline that reduces available supply. These scenarios could support price recovery toward $70 to $80 per barrel ranges within 12 to 18 months.
Market Scenario Projections:
| Scenario | Probability | 2026 Price Range | Key Drivers |
|---|---|---|---|
| Base Case | 50% | $50-65/barrel | Gradual rebalancing |
| Upside Recovery | 25% | $70-80/barrel | Supply disruptions/demand surge |
| Downside Pressure | 25% | $40-50/barrel | Recession/transition acceleration |
Downside scenarios incorporate risks from global economic recession reducing industrial demand, accelerated energy transition permanently destroying petroleum consumption, or technological breakthroughs making alternative energy sources more cost-competitive. These scenarios could drive prices below $50 per barrel for extended periods.
Critical Monitoring Indicators
Market intelligence requires systematic monitoring of leading indicators that signal changes in supply-demand balance dynamics before they fully manifest in price movements. OPEC+ policy decisions and compliance monitoring provide critical insights into cartel discipline and market intervention capabilities.
U.S. shale production resilience measurements through rig counts, completion activities, and productivity metrics reveal the supply response to current pricing levels. Sustained production at current prices demonstrates the structural changes in global supply cost curves that limit price recovery potential.
Chinese petroleum demand patterns provide crucial demand-side indicators as the world's largest oil importer. Import statistics, strategic petroleum reserve activities, and domestic consumption trends offer insights into global demand evolution.
Key Monitoring Metrics:
• OPEC+ production compliance rates and quota adjustments
• U.S. rig count and shale production efficiency improvements
• Chinese crude oil imports and inventory accumulation
• Global economic growth indicators and industrial production
• Energy transition progress metrics and policy developments
Storage capacity utilisation rates across major trading hubs indicate physical market tightness or abundance that directly influences pricing dynamics. Approaching storage capacity limits typically force additional price concessions to encourage consumption or discourage production.
Financial market positioning through futures market open interest, speculative positioning, and institutional investment flows provides insights into market sentiment and potential for technical price movements independent of fundamental factors.
The integration of multiple monitoring frameworks enables comprehensive market intelligence that supports strategic decision-making in complex and rapidly evolving market conditions.
Investment decisions should consider multiple scenarios and risk factors. Commodity markets involve substantial volatility and financial risk. This analysis does not constitute investment advice and market participants should conduct independent research and consult qualified professionals before making investment decisions.
Ready to Capitalise on Commodity Market Volatility?
Discovery Alert's proprietary Discovery IQ model delivers real-time alerts on significant ASX mineral discoveries, helping investors navigate volatile commodity markets with precision timing and actionable insights. While oil markets face structural challenges, smart investors are positioning themselves to capture opportunities in the mineral exploration sector through Discovery Alert's proven track record of identifying major discoveries before they reach mainstream attention.