July 14, 2026
The Strait of Hormuz, Geopolitical Risk Premiums, and What Oil at US$85 Actually Tells Us
There is a version of an oil price spike that markets can largely ignore. Supply disruptions caused by individual field outages, seasonal refinery maintenance cycles, or short-term shipping bottlenecks tend to resolve themselves within weeks, and experienced traders know to fade the initial move. Then there is a different category entirely: the kind of disruption that calls into question the structural reliability of one of the world's most critical energy arteries. When Brent crude returns to US$85 per barrel in mid-2026, the question that matters most is not simply how far prices moved, but why they moved, and what that distinction reveals about the state of global energy risk.
When big ASX news breaks, our subscribers know first
The US$85 Threshold Is Not Just a Number
Institutional investors and commodity traders treat certain price levels in crude oil the way technical analysts treat moving averages: they carry weight beyond the mathematics. The US$85 per barrel level in Brent had previously appeared as a ceiling or floor at various points across the 2024 to 2026 cycle, including around April 2026, making the mid-July 2026 return to this level a psychologically loaded event rather than a simple data point. Understanding crude oil price trends helps contextualise why this threshold carries such weight.
What makes this particular touch of US$85 analytically significant is the direction from which prices arrived. Brent crude had been trending downward through much of 2026, with the US Energy Information Administration projecting a decline toward approximately US$70 per barrel by the fourth quarter of the year. That forecast was grounded in genuine supply-demand arithmetic: OPEC+ had been managing output with reasonable discipline, but global demand growth projections for late 2026 were modest, and non-OPEC supply from the Americas was adding incremental barrels to an already adequately supplied market.
An abrupt reversal from a downward trajectory to US$85.12 per barrel, achieved through a single geopolitical catalyst rather than a gradual tightening of fundamentals, carries a very different signal than a demand-led recovery to the same price level would.
When geopolitical events override macroeconomic supply-demand models, price forecasting becomes a risk management exercise rather than an economic one. The US$85 return is a volatility event, not a structural bull market signal.
What Is Actually Driving Brent Back to US$85 in Mid-2026
The Strait of Hormuz: Why This Chokepoint Changes Everything
To understand why oil markets responded so violently in July 2026, it helps to understand the geography of global petroleum flows. The Strait of Hormuz, a narrow passage of water approximately 33 kilometres wide at its narrowest navigable point, sits between Iran and Oman at the mouth of the Persian Gulf. Roughly one-fifth of the world's total daily oil supply, including the vast majority of crude exports from Saudi Arabia, the UAE, Kuwait, Iraq, and Iran itself, transits through this single waterway.
There is no viable, cost-effective alternative route for most of that volume. The partial use of pipelines such as the Petroline across Saudi Arabia and the Abu Dhabi Crude Oil Pipeline can offset some flow, but not at the scale or speed required to replace a full or partial Hormuz closure. This structural reality is precisely why any credible military escalation in or around the strait triggers immediate and disproportionate reactions in crude futures markets.
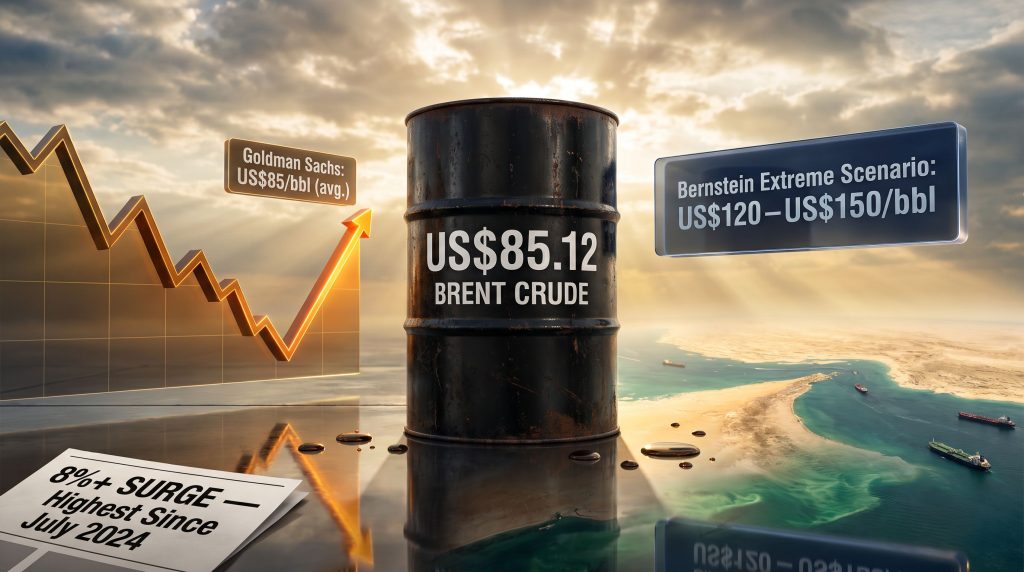
The breakdown in relations between the United States and Iran in mid-2026, accompanied by reported naval confrontations and strikes on oil-registered tankers, represented exactly this category of threat. Brent futures initially surged more than 5% on the news flow before ultimately closing the session up more than 8% at US$85.12 per barrel, the highest level since July 2024 and effectively a near two-year high.
From Downtrend to Reversal: The Volatility Mechanism
The EIA's pre-conflict forecast of US$70 per barrel by Q4 2026 was not a fringe view. It reflected broad consensus among energy economists that the supply environment heading into the second half of 2026 remained comfortable. The gap between that US$70 projection and the US$85.12 price print represents a geopolitical risk premium of roughly US$15 per barrel, embedded in Brent futures almost overnight.
Understanding how this happens mechanically is useful context for investors. Oil futures markets price on the marginal barrel of supply. When traders perceive that a material portion of global supply could be disrupted, they do not wait for physical barrels to disappear from the market. Instead, they reprice futures contracts immediately to reflect the probabilistic cost of a disruption scenario. The larger and more credible the threat, the larger the premium embedded in the futures curve. In this case, the proximity of military activity to the Hormuz shipping lanes was sufficiently credible to produce an 8%+ move in a single session.
How Major Investment Banks Are Repricing Oil Risk
The investment banking response to the Hormuz disruption risk was both swift and notable for its internal divergence, which itself tells a story about analytical uncertainty.
| Institution | Previous Forecast | Revised 2026 Brent Forecast | Extreme Scenario |
|---|---|---|---|
| Goldman Sachs | ~US$77/bbl | US$85/bbl (avg.) | Not disclosed |
| Bernstein | Below US$80/bbl | US$80/bbl (base) | US$120–US$150/bbl |
| EIA (pre-conflict) | US$70/bbl (Q4 2026) | Under review | Not applicable |
Goldman Sachs lifted its 2026 average Brent price forecast by US$8 per barrel to US$85, treating the geopolitical risk premium as likely to persist rather than immediately unwind. This is a meaningful revision because it implies Goldman expects the conflict environment to remain elevated, not resolve in days.
The more striking analytical contribution came from Bernstein, whose base case revision to US$80 per barrel was accompanied by a tail-risk scenario projecting US$120 to US$150 per barrel under conditions of prolonged conflict and sustained infrastructure damage across Persian Gulf oil facilities. It bears emphasising that Bernstein's extreme scenario is precisely that: a tail risk, not a central case. However, its publication signals that serious institutional analysts are stress-testing scenarios that were considered implausible just months earlier.
The divergence between the EIA's supply-demand model and the investment bank geopolitical-risk frameworks illustrates a core tension in oil price forecasting: fundamental models and geopolitical risk models often produce radically different outputs, and knowing which one to trust at any given moment requires a judgement call rather than a calculation.
What Sustained US$85+ Oil Would Mean for Global Inflation
Energy prices do not stay contained within the energy sector. The transmission pathway from crude oil to broader consumer prices flows through several channels simultaneously:
- Retail fuel prices respond within two to four weeks of a sustained crude move, directly affecting household budgets
- Freight and logistics costs increase as diesel prices rise, pushing up the cost of transporting nearly every physical good
- Agricultural input costs rise as diesel-intensive farming operations face higher operational expenses, eventually affecting food prices
- Headline CPI in both developed and emerging market economies tends to drift higher, complicating the task of central banks attempting to ease monetary policy
For central banks in the US, the eurozone, and Australia, the challenge is particularly acute. Rate-cut cycles that were anticipated through the second half of 2026 based on moderating inflation could be delayed or recalibrated if energy-driven CPI readings come in above expectations. Emerging market economies that are net oil importers face the most asymmetric pressure, as they must absorb the dollar-denominated cost increase without the buffer of commodity export revenues. Furthermore, these oil market impacts extend beyond simple energy costs, touching trade balances and currency valuations across the region.
How the Brent Crude Spike Landed on the ASX
A Muted Market Response on 14 July 2026
The Australian equity market's reaction to Brent crude returns to US$85 was notably subdued. The ASX 200 closed the session at 8,807.1 points, having moved just 1.40 points across the trading day, a range that reflects institutional caution rather than active repositioning. BHP Group recorded materially lower turnover compared to the prior Monday session, suggesting that portfolio managers were adopting a watchful stance rather than aggressively adjusting exposure.
At the same time, spot gold was consolidating near the psychologically important US$4,000 per ounce level. The simultaneous clustering of two major global commodities around round-number psychological thresholds, with crude oil at US$85 and gold at US$4,000, is worth noting as a market psychology data point. Both levels represent contested ground where institutional positioning tends to be cautious and directional bets require high conviction. The ASX commodity pressure evident across this session reinforces just how broadly these global price moves flow through to domestic equity markets.
Sector Winners and Losers Under an US$85 Brent Environment
Not all ASX-listed companies respond equally to higher crude prices. The directional impact splits broadly along cost-structure and revenue-linkage lines:
Sectors that typically benefit from elevated crude prices:
- ASX-listed oil and gas producers with direct exposure to Brent-linked pricing receive immediate revenue uplift on existing production
- Domestic coal producers benefit from energy substitution dynamics, as expensive oil encourages power generators and industrial users to seek alternatives where possible
- LNG exporters gain because many long-term LNG contracts carry oil-price linkage mechanisms, meaning higher crude prices flow through to higher LNG contract revenues over time
Sectors facing cost-side headwinds:
- Airlines and transport logistics businesses with unhedged fuel exposure face direct margin compression
- Agricultural producers reliant on diesel-intensive machinery and supply chains absorb higher input costs that may not be easily passed on
- Retail and consumer discretionary companies exposed to freight cost pass-through see gradual margin pressure as logistics costs rise
A sustained move above US$85 per barrel historically triggers a measurable drag on ASX consumer discretionary earnings, typically lagging the crude price move by one to two reporting quarters.
One additional dynamic worth tracking on the ASX is uranium. Uranium-linked stocks had risen late the prior week following Australia's announcement of uranium supply arrangements with India, only to pull back on the Tuesday session. This illustrates how quickly sentiment can reverse in resource sub-sectors when multiple competing narratives are operating simultaneously.
Is the Rally Sustainable, or Is This a Volatility Spike?
The Case for Further Upside
Several factors support the view that the Brent crude price could hold above US$85 or move higher in the near term:
- Hormuz closure scenarios produce multi-week dislocations. Even partial or temporary restrictions on tanker traffic through the strait historically generate price pressure that extends well beyond the initial incident as the market prices in ongoing uncertainty.
- OPEC+ spare capacity is limited. Years of production discipline and underinvestment in upstream capacity have reduced the global buffer available to offset a supply disruption at scale. In addition, OPEC's market influence remains a critical variable in determining how quickly any supply gap could be addressed.
- Bernstein's US$120 to US$150 tail-risk scenario represents a low-probability but structurally coherent outcome if the conflict escalates to include sustained damage to Gulf energy infrastructure.
The Case for a Pullback
Equally, there are strong structural reasons to expect at least a partial reversion of the geopolitical risk premium:
- The EIA's fundamental supply-demand balance has not changed. A world where supply modestly outpaces demand growth does not sustainably support US$85 Brent without continued geopolitical pressure.
- Risk premiums in oil markets are historically short-lived unless accompanied by a permanent reduction in available supply capacity.
- Diplomatic de-escalation remains a plausible scenario, and any credible reopening of Hormuz transit routes could unwind a significant portion of the embedded risk premium within days.
- Strategic petroleum reserve releases by the US or coordinated IEA member releases remain available as policy tools to cap price spikes.
Historical Precedent: How Long Do Geopolitical Oil Spikes Last?
| Conflict Event | Initial Spike | Duration of Elevated Prices | Reversion Pattern |
|---|---|---|---|
| Gulf War I (1990-91) | ~+100% | ~6 months | Gradual over 12 months |
| Iraq War (2003) | ~+30% | ~3 months | Rapid post-conflict |
| Russia-Ukraine (2022) | ~+60% | ~8 months | Gradual with OPEC+ response |
| US-Iran Escalation (2026) | ~+8% to US$85.12 | TBD | Dependent on Hormuz status |
The historical record shows that geopolitical oil spikes tend to partially or fully reverse once the market achieves greater clarity on the actual supply impact. The critical variable in the 2026 case is whether the Hormuz disruption remains a threat or becomes a reality with structural consequences. Analysts tracking oil prices pulling back note that demand-side factors will ultimately reassert themselves once geopolitical risk premiums normalise.
The next major ASX story will hit our subscribers first
What Brent at US$85 Means for Australian Consumers and the Economy
From Brent to the Bowser: The Domestic Fuel Price Lag
Australian retail petrol prices do not respond to international crude benchmarks instantaneously. The typical transmission lag runs between two and four weeks, reflecting the time required for crude price changes to flow through to refined product pricing and then to retail forecourts. This lag creates a window during which consumers and businesses can observe the crude move and anticipate the downstream impact before it fully materialises at the pump.
The AUD/USD exchange rate adds a second layer of complexity. Because crude oil is priced globally in US dollars, a weaker Australian dollar amplifies the domestic fuel price impact of any given crude price move, while a stronger Australian dollar provides a partial natural hedge. Investors monitoring the crude spike should therefore track the exchange rate in parallel as a key variable in the domestic inflation calculus.
Australia's Dual Commodity Exposure
Australia occupies an interesting structural position in a high-oil-price environment. As one of the world's largest LNG exporters, the country benefits meaningfully from elevated energy prices through improved export revenues, particularly given the oil-price linkage built into many long-term LNG contracts. At the same time, Australia is a net oil importer, meaning domestic consumers and fuel-intensive industries face higher costs that cannot be offset by the export revenue benefit.
This dual exposure creates a complex picture for the Reserve Bank of Australia. If energy-driven inflation pushes CPI readings higher than expected through the second half of 2026, the RBA's scope to continue any rate-easing cycle could be constrained. Rate sensitivity in the Australian housing market, combined with energy-driven input cost pressure across agriculture and transport, means the macro stakes of a sustained Brent crude rally extend well beyond the energy sector itself.
The concurrent gold safe-haven dynamics near US$4,000 per ounce provide a counterbalancing positive for Australia's commodity export profile, given the country's significant gold production sector. However, this dynamic also reinforces the broader market signal: multiple global commodities are simultaneously trading at or near psychologically significant price levels, reflecting a world in which geopolitical uncertainty is being priced as a persistent condition rather than a transient event.
Frequently Asked Questions: Brent Crude at US$85
Why Has Brent Crude Returned to US$85 per Barrel?
The primary driver is the escalation of US-Iran military hostilities in mid-2026, which led to disruptions in the Strait of Hormuz, a critical global oil transit route. This triggered an 8%+ surge in Brent futures, pushing prices to US$85.12 per barrel, the highest level since July 2024.
What Is the Strait of Hormuz and Why Does It Matter for Oil Prices?
The Strait of Hormuz is a narrow waterway between Iran and Oman through which approximately one-fifth of the world's daily oil supply passes. Any disruption to transit through this route creates immediate upward pressure on global crude prices because no cost-effective alternative routing exists at equivalent scale.
What Are Investment Banks Forecasting for Brent Crude in 2026?
Goldman Sachs revised its 2026 average Brent forecast upward by US$8 per barrel to US$85. Bernstein raised its base case to US$80 per barrel while flagging an extreme scenario of US$120 to US$150 per barrel if the conflict worsens materially. The EIA had previously projected a decline to approximately US$70 per barrel by Q4 2026 based on supply-demand fundamentals.
How Does a Higher Oil Price Affect the ASX?
Energy producers and LNG exporters on the ASX typically benefit from higher crude prices through improved revenue margins. Sectors with significant fuel cost exposure, including airlines, transport, and consumer discretionary, face earnings headwinds. The ASX 200 responded with notable restraint on 14 July 2026, closing virtually unchanged at 8,807.1 points.
Is the Brent Crude Rally Likely to Be Sustained?
Current evidence suggests this is primarily a geopolitical risk premium rather than a structural demand-driven rally. Historical precedent indicates that conflict-related oil spikes partially reverse once the immediate supply threat is assessed more clearly. Diplomatic resolution or Hormuz reopening could see prices retrace toward the EIA's pre-conflict forecast range.
Key Takeaways: Navigating the US$85 Brent Crude Environment
- Brent crude returns to US$85 per barrel, marking a sharp reversal of the 2026 downtrend, driven by US-Iran conflict and Strait of Hormuz disruption
- The 8%+ surge to US$85.12 per barrel represents the highest Brent level since July 2024, effectively a near two-year high
- Goldman Sachs and Bernstein have both revised forecasts upward, with tail-risk scenarios extending to US$120 to US$150 per barrel under extreme conflict conditions
- ASX energy, LNG, and coal sectors are positioned as relative beneficiaries; consumer-facing and transport sectors face cost headwinds
- The sustainability of the rally depends almost entirely on the geopolitical trajectory, not on demand fundamentals
- Australian investors should monitor the RBA's response to energy-driven inflation, the AUD/USD exchange rate, and the status of Hormuz transit as the three most consequential variables in the near-term outlook
- The muted ASX 200 session on 14 July 2026, closing at 8,807.1 with a move of just 1.40 points, reflects institutional caution rather than conviction in either direction
This article is for informational purposes only and should not be treated as financial or investment advice. Forecasts and scenarios referenced from Goldman Sachs, Bernstein, and the EIA represent those institutions' published views and are subject to change. Readers are encouraged to conduct their own research and consult a licensed financial advisor before making any investment decisions.
Want to Stay Ahead of ASX Resource Opportunities Amid Rising Geopolitical Risk?
When energy markets are repricing risk overnight and commodity volatility is reshaping sector fortunes across the ASX, identifying the next significant mineral discovery before the broader market can be just as consequential as tracking crude benchmarks. Discovery Alert's proprietary Discovery IQ model delivers real-time alerts on significant ASX mineral discoveries, turning complex geological and market data into actionable insights — explore historic discovery returns on Discovery Alert's dedicated discoveries page to see what early positioning can mean, and begin your 14-day free trial to ensure you're never caught flat-footed when markets move.