June 27, 2026
How Crude Oil Markets Price Fear: The Mechanics Behind the Iran War Premium
Every major geopolitical shock that threatens energy supply leaves a fingerprint on crude oil futures. That fingerprint is the war premium, an additional layer of price embedded above what fundamental supply and demand dynamics would otherwise justify. Understanding how this premium forms, inflates, and ultimately unravels is essential to interpreting why Brent erases Iran war premium conditions as Hormuz flows show signs of recovery, and what the trajectory of global energy pricing looks like from here.
The war premium is not simply a reflection of disrupted barrels. It encodes probability-weighted expectations about future supply availability, the credibility of alternative routing, the durability of the conflict, and the speed of diplomatic resolution. Futures traders and institutional portfolio managers price these variables continuously, often ahead of physical market participants. This is why crude prices frequently fall sharply before a single additional barrel actually reaches its destination.
When big ASX news breaks, our subscribers know first
The Strait of Hormuz: A Chokepoint That Shapes Global Energy Architecture
The Strait of Hormuz is not merely a geographic feature. It is a 21-mile-wide passage that functions as the structural backbone of global seaborne oil and LNG trade. Its significance is disproportionate to its physical dimensions.
Approximately 20 to 21 percent of all globally traded oil passes through this single corridor, along with roughly 25 percent of the world's liquefied natural gas. The nations whose export economics depend most heavily on unobstructed Hormuz access include Saudi Arabia, Iraq, Kuwait, the UAE, Qatar, and Iran itself.
| Exporter | Hormuz-Dependent Exports (mb/d) | Alternative Route Available? |
|---|---|---|
| Saudi Arabia | ~6.5 (Gulf terminals) | Partial (East-West Pipeline to Yanbu) |
| Iraq | ~3.5 | No viable alternative |
| Kuwait | ~2.0 | No viable alternative |
| UAE | ~2.5 | Partial (Habshan-Fujairah pipeline) |
| Qatar (LNG) | ~77 mtpa | No viable alternative |
| Iran | ~1.5 | No viable alternative |
What makes Hormuz uniquely vulnerable is the absence of meaningful bypass capacity for most exporters. Saudi Arabia can redirect a portion of its Gulf coast volumes through the East-West Pipeline to the Red Sea terminal at Yanbu, adding approximately 4 million barrels per day in alternative flow. The UAE's Habshan-Fujairah pipeline provides partial relief. But for Iraq, Kuwait, and Qatar, there is simply no workable alternative. Their export revenue depends entirely on the strait remaining navigable.
The Fujairah storage hub on the UAE's east coast became a critical real-time indicator of Gulf supply health during the disruption period, as traders monitored inventory drawdowns and tanker waiting times for early signs of either deterioration or recovery.
From Shock to Scramble: The Four-Month Disruption in Three Phases
Phase One: Escalation and the Initial Supply Shock
The US military strike on Iran on February 28, 2026 served as the conflict trigger point that set the chain of market disruptions in motion. Commercial shipping through the strait collapsed almost immediately, with daily transit volumes dropping sharply from a pre-conflict norm of 130 to 140 crossings per day.
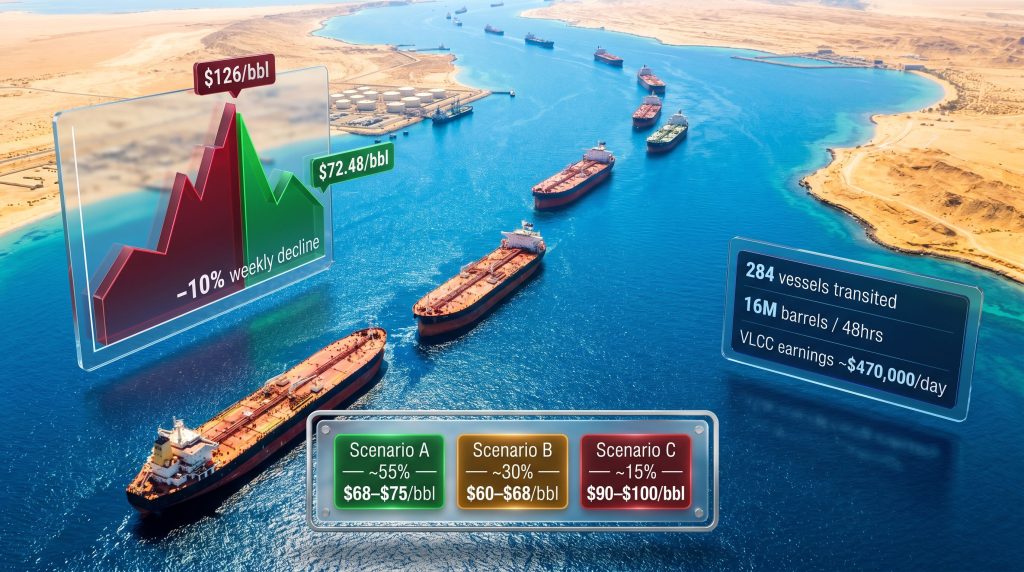
Brent crude responded decisively, surging toward a peak of approximately $126 per barrel as traders embedded maximum fear into forward curves. That figure represented a war premium of roughly $40 to $50 per barrel above the pre-conflict baseline of approximately $72 per barrel, a level nearly 75 percent above where markets had been pricing crude before hostilities commenced. The oil price shock was swift and severe, catching many market participants off guard.
Phase Two: Rerouting, Substitution, and Freight Market Extremes
As the conflict persisted through April and May, physical oil markets adapted. Saudi Arabia redirected export flows through its Red Sea terminals at Yanbu, bringing alternative capacity online. Asian buyers scrambled to secure non-Hormuz supply from West African and other Atlantic Basin producers.
The shipping market reflected the scarcity with brutal precision. Very Large Crude Carrier (VLCC) spot earnings surged toward $470,000 per day, an extraordinary level that fundamentally altered tanker owner economics for the quarter. Under normal market conditions, VLCC earnings typically range between $20,000 and $60,000 per day, making the conflict-period premium a genuinely historic anomaly.
A lesser-known consequence of the disruption was the widespread adoption of what traders refer to as "dark mode" operations, where tanker operators disabled their Automatic Identification System (AIS) transponders to reduce their vessel's visibility and perceived risk profile while navigating uncertain transit conditions. AIS disabling is technically a violation of international maritime regulations but became a pragmatic risk management tool under extraordinary circumstances.
West African crude differentials collapsed as Asian demand fragmented. Congo's flagship Djeno crude, previously a staple supply for northern Chinese refineries, fell to a discount of $10 per barrel versus Dated Brent. Angolan grades dropped to minus $7 versus Dated Brent, both representing historic lows for these differentials.
Phase Three: De-escalation and the Rapid Unwinding of the War Premium
The June 18 peace agreement between the US and Iran served as the catalyst for one of the fastest geopolitical risk premium unwindings in recent crude market history. Brent erases Iran war premium conditions materialised swiftly, with Brent posting a 10 percent weekly decline and settling back toward approximately $72 per barrel, the precise pricing level that had prevailed immediately before the February 28 conflict trigger.
That precision is analytically significant. It confirms that the market had been pricing the conflict almost entirely as a temporary disruption to what it viewed as a fundamentally sound supply-demand baseline, rather than as a structural shift in global energy economics. Furthermore, according to reporting on Brent's wartime gains, Brent hit its lowest point since the Iran war began as expectations of smoother oil flows through Hormuz took hold.
Dubai and Murban crude benchmarks, which serve as the primary pricing references for Middle Eastern crude destined for Asian markets, flipped from backwardation into contango, signalling that physical markets were beginning to anticipate near-term oversupply as Gulf flows resumed. ADNOC responded by reducing its Murban official selling price to $101.48, a direct pricing signal acknowledging easing Hormuz tensions.
Saudi Aramco's loading of its first Persian Gulf cargoes since March, using its VLCC tankers Karan and Zaynah, functioned as both an operational and symbolic marker of recovery.
Evaluating the Recovery: Is the Hormuz Reopening Durable?
The critical analytical challenge is distinguishing between commercial confidence and genuine operational normalisation. Three distinct evidence streams inform this assessment.
Tanker traffic data presents the most direct measure. Vessel-tracking provider Kpler recorded 284 ship transits in the days following the June 18 agreement, while a single 48-hour window spanning Wednesday and Thursday of the reporting week saw more than 16 million barrels transit the waterway, the highest volume since the conflict began. However, this remains well below the pre-conflict norm of 130 to 140 daily crossings.
Benchmark price structure offers a market-implied verdict. Brent's return to $72.48 to $73.23 per barrel represents the market's probability-weighted assessment that conflict resolution is credible and supply recovery is underway. Contango formation in Dubai and Murban reinforces this, as it only emerges when traders expect near-term supply availability to exceed immediate absorption capacity.
Residual risk factors remain material. Iran's Islamic Revolutionary Guard Corps fired drones at the Taiwan-flagged cargo vessel Ever Lovely approximately 7 miles off the Omani coast, damaging the vessel's bridge and demonstrating that transit risk has not fully dissipated despite the peace agreement. US Energy Secretary Chris Wright assessed that mine clearance operations alone could require several weeks before the strait is fully safe for unrestricted commercial navigation.
Institutional analysts from Goldman Sachs and BNP Paribas estimate that crude export volumes from the Gulf will not return to pre-conflict levels until October 2026, with full infrastructure rehabilitation in Iraq and Kuwait potentially extending into 2027.
Cascading Effects: LNG, Asian Crude Markets, and OPEC Cohesion
Qatar's Path Back to Full LNG Output
Qatar's Ras Laffan liquefaction complex, the world's largest LNG export facility, is preparing to restart 12 of its 14 trains, with two remaining offline due to conflict-related damage. Qatar's official position is that normal LNG export volumes could resume within weeks, a timeline that tanker operators appear to believe, given the assembly of vessels at Ras Laffan ahead of anticipated loadings.
Qatar signed its first post-conflict crude deal with Taiwan as a visible confidence signal, reinforcing the commercial normalisation narrative. As Qatari volumes re-enter global LNG markets, natural gas price trends are expected to face downward pressure, providing relief to European and Asian importers who faced acute cost pressures during the disruption period.
Asian Crude Markets: Demand Weakness Compounds Supply Disruption
China's crude import trajectory is heading toward its weakest monthly reading since 2016, as demand-side weakness compounds the supply disruption effects. The China demand outlook remains subdued, with Chinese independent refineries, known within the industry as "teapot" refineries, operating at utilisation rates last seen in 2017.
Chinese state refiners Sinopec and PetroChina are evaluating resumption of Iranian crude purchases for the first time since 2019, enabled by a 60-day window granted under the Trump administration's diplomatic framework, potentially sufficient to complete several cargo transactions.
The teapot refinery dynamic is worth understanding in depth. These independent operators historically drove a significant portion of China's crude import demand growth throughout the 2015 to 2020 period, benefiting from import quotas and access to discounted Iranian and Russian barrels. Their current operational weakness reflects a confluence of domestic economic softness, refinery margin compression, and disrupted access to discounted supply sources.
OPEC Under Internal Pressure
Iraq's reported consideration of withdrawing from OPEC unless production quotas, currently set at 4.378 million barrels per day, are materially increased, represents a structurally important fault line within the cartel. Baghdad's Oil Ministry subsequently characterised the reports as premature, but the underlying tension is genuine. In addition, OPEC market influence is being tested as member states face diverging fiscal pressures in the post-conflict environment.
Iraq's fiscal breakeven oil price requires both high output and elevated prices simultaneously, a combination that OPEC's collective production discipline framework does not always accommodate. Saudi Arabia's price signalling, including plans to reduce official selling prices as Hormuz supply recovery accelerates, adds further downward pressure that fiscally stretched producers like Iraq find difficult to absorb.
Secondary Dislocations: Markets Beyond Crude
The Hormuz crisis generated significant turbulence well beyond crude oil benchmarks. Moreover, the broader consequences of geopolitical trade tensions were felt across multiple asset classes simultaneously.
- Gold recorded its fifth consecutive weekly loss, with spot prices declining to approximately $4,025 per ounce, as a stronger US dollar and Federal Reserve rate hike expectations for September weighed on safe-haven demand.
- Chinese zinc futures collapsed to approximately ¥22,000 per metric tonne ($3,235/mt), trading at a $400 per tonne discount to international benchmark prices. This dislocation is positioning Chinese metal traders to execute outflow arbitrage into Middle Eastern warehouses in the coming month.
- The Euro declined to a one-year low as falling oil prices amplified European Central Bank rate cut expectations.
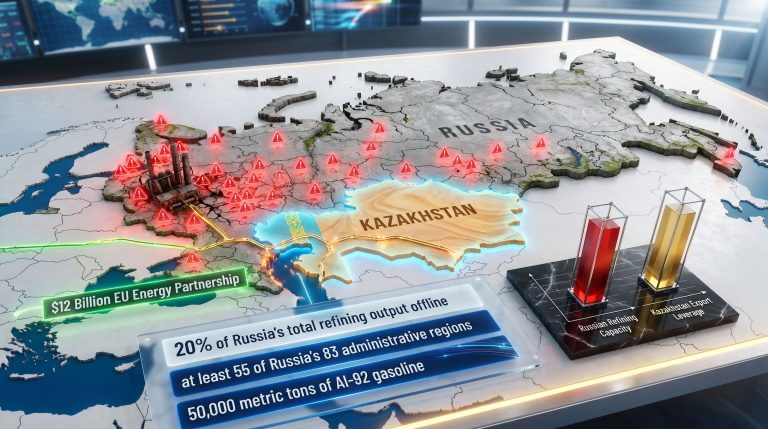
- Russia's energy sector faced compounding pressures, with Ukrainian drone strikes on the Orenburg gas processing plant forcing Kazakhstan's Karachaganak field to reduce output by 25%, dropping production to approximately 200,000 barrels per day. Russian domestic diesel prices rose 9% year-on-year to approximately $4 per gallon, prompting Deputy Prime Minister Alexander Novak to publicly consider a multi-month diesel export ban.
The next major ASX story will hit our subscribers first
Three Scenarios for Brent Pricing Through Q4 2026
| Scenario | Probability | Brent Range (Q4 2026) | Key Trigger |
|---|---|---|---|
| A: Full Normalisation | ~55% | $68-$75/bbl | Mine clearance success + OPEC discipline |
| B: Protracted Recovery | ~30% | $60-$68/bbl | Infrastructure delays + China demand weakness |
| C: Re-escalation | ~15% | $90-$100/bbl | Major strait incident or terminal strike |
The base case rests on mine clearance completing within four to six weeks and commercial traffic recovering toward pre-conflict crossing rates by August 2026. The bear case reflects the compounding risk of incomplete infrastructure restoration and persistent Chinese demand weakness. The tail risk scenario contemplates a major incident, such as the sinking of a VLCC or a strike on a Gulf export terminal, that re-inflates the war premium sharply. Consequently, live Brent crude data will remain a closely watched indicator throughout this period.
What $70 Brent Means for the Broader Global Economy
The return of Brent toward the $70 range carries asymmetric implications across different economies.
- India stands to benefit significantly, with analysts estimating that sustained $70 per barrel Brent pricing could support GDP growth approaching 7% annually by reducing the country's crude import bill and easing inflationary pressure on fuel costs.
- European industry and households benefit from lower LNG prices as Qatari volumes restore supply competition in Atlantic Basin markets.
- Oil-importing emerging markets gain from reduced import costs, improving current account positions that deteriorated sharply during the conflict premium period.
- Oil-exporting sovereigns face fiscal pressure at sub-$75 Brent, particularly those with high breakeven requirements, amplifying the internal OPEC tensions already evident in the Iraq quota dispute.
Key Data Summary
| Metric | Value | Context |
|---|---|---|
| Brent peak (conflict high) | ~$126/bbl | War premium at maximum |
| Brent pre-conflict baseline | ~$72/bbl | February 28, 2026 level |
| Weekly Brent decline | ~10% | Largest weekly loss of post-conflict period |
| Pre-conflict daily transits | 130-140 crossings | Benchmark for full normalisation |
| Post-agreement ship transits | 284 vessels | Kpler tracking data |
| Volume in single 48-hour window | >16 million barrels | Highest since conflict onset |
| VLCC spot earnings (peak) | ~$470,000/day | Historic freight market conditions |
| Qatar LNG trains operational | 12 of 14 | 2 trains remain offline |
| Djeno crude discount to Dated Brent | -$10/bbl | Historic low |
| Angolan crude discount to Dated Brent | -$7/bbl | Demand destruction from Asian buyers |
| Karachaganak output reduction | -25% (~200,000 b/d) | Drone strike on Orenburg plant |
| Gold spot price | ~$4,025/oz | Fifth consecutive weekly loss |
| Chinese zinc futures | ~¥22,000/mt ($3,235/mt) | $400/tonne discount to international prices |
| Iraq OPEC production quota | 4.378 million b/d | Source of OPEC internal friction |
| ADNOC Murban official selling price | $101.48 | Reduced in response to Hormuz easing |
| India GDP growth potential at $70 oil | ~7% annually | Analyst estimates |
The Road Ahead: Three Variables That Will Determine the $72 Floor
Whether Brent holds its post-conflict baseline or drifts lower depends on three interlocking variables. First, the pace and completeness of Hormuz mine clearance operations, which determine when commercial shipping confidence transitions from cautious optimism to operational certainty. Second, OPEC production discipline, particularly whether Baghdad's quota frustration remains contained within diplomatic channels or escalates into unilateral production increases. Third, Chinese demand recovery, which must absorb the incremental Gulf supply returning to Asian markets without triggering a structural oversupply condition.
The market's forward-looking mechanism has already priced resolution probability into the $72 baseline. What remains uncertain is the execution risk surrounding each of these three variables across the second half of 2026. As Brent erases Iran war premium conditions consolidate, the durability of this pricing floor will ultimately be tested by whether operational and diplomatic progress continues to match market expectations.
Disclaimer: This article contains forward-looking analysis, scenario modelling, and market projections that involve significant uncertainty. Price forecasts and probability estimates are analytical constructs based on publicly available data and should not be construed as financial advice. Energy markets are subject to rapid and unpredictable change. Readers should conduct independent research before making any investment decisions.
Want to Spot the Next Major Resource Opportunity Before the Market Does?
While crude oil war premiums unwind and commodity markets reprice, significant mineral discoveries on the ASX continue to create their own dramatic price movements — and Discovery Alert's proprietary Discovery IQ model ensures subscribers receive real-time alerts the moment these opportunities emerge. Explore Discovery Alert's discoveries page to see how historic ASX mineral finds have generated substantial returns, and begin a 14-day free trial to position yourself ahead of the broader market.