July 13, 2026
When Geography Becomes a Weapon: The Hormuz Closure Reshaping Global Energy
Few concepts in energy economics carry as much weight as the idea of a chokepoint. In textbook terms, a chokepoint is simply a narrow geographic passage through which a disproportionate share of global trade flows. In practice, when a state with military capability decides to enforce a closure of the world's most consequential such passage, the entire architecture of global energy pricing is forced to recalibrate from the ground up.
That is the situation confronting oil markets in late April 2026. With Brent eyes $100 as ceasefire deadline looms, the question occupying traders, governments, and refinery operators across three continents is not merely whether the $100 per barrel level will be breached, but what the broader structural consequences of this moment will look like long after the immediate crisis resolves. Understanding the interplay of trade and geopolitics is essential to contextualising how rapidly this situation has escalated.
When big ASX news breaks, our subscribers know first
The Strait of Hormuz: A Chokepoint Turns Weapon
Why No Other Maritime Passage Comes Close
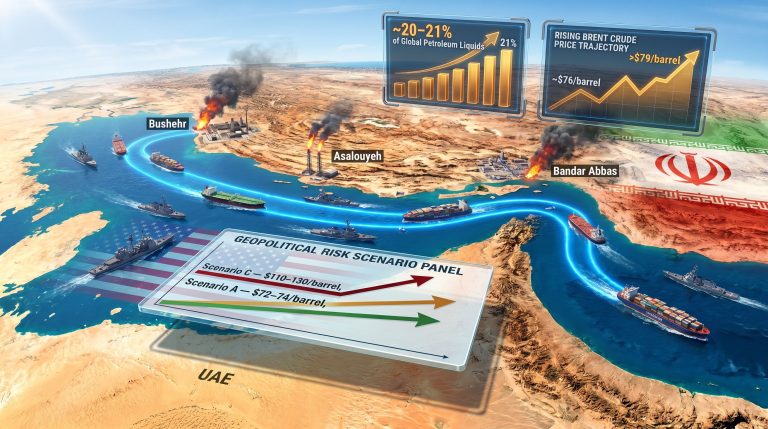
The Strait of Hormuz sits at the mouth of the Persian Gulf, connecting the oil-rich interior of the Middle East to the open waters of the Arabian Sea. Roughly one-fifth of all internationally traded crude oil transits this passage, along with substantial volumes of LNG and refined petroleum products. No alternative routing exists for Gulf producers that comes anywhere close in cost or logistics efficiency.
What makes the current situation distinct from prior Hormuz-related incidents is the nature of enforcement. Iran's Islamic Revolutionary Guard Corps has deployed naval assets to physically intercept and redirect vessel traffic. This is not a threat or a posture — it is active maritime interdiction. Five LNG carriers that attempted transit over a single weekend in mid-April 2026, after receiving assurances of free passage, were ordered by IRGC forces to reverse course.
That sequence of events — a false diplomatic signal followed by physical enforcement — marked a turning point in how market participants are pricing Iranian intent. Furthermore, geopolitical trade tensions of this nature have historically proven far more disruptive than brief diplomatic standoffs.
The Hierarchy of Historical Disruptions
To appreciate the scale of the current disruption, it helps to place it alongside prior supply shocks.
| Disruption Event | Duration | Estimated Supply Impact | Peak Price Response |
|---|---|---|---|
| 1973 Arab Oil Embargo | ~5 months | ~4 mb/d | +300% price surge |
| 1980 Iran-Iraq War | ~8 years | ~4 mb/d | Sustained elevation |
| 2019 Strait Tanker Attacks | Days | Minimal | +3 to 5% short-term |
| 2026 Iran Hormuz Closure | Ongoing | ~20% of global trade | Brent approaching $100+ |
The 1973 and 1980 events, despite their severity, disrupted single-origin supply flows. The 2026 closure operates differently: it simultaneously blocks crude exports, LNG cargoes, and refined product shipments through a single geographic node. The multiplier effect on global supply chains is categorically larger than any prior Hormuz-related incident.
The International Energy Agency has made what amounts to a landmark institutional declaration, characterising the strait as having lost its status as a dependable artery for global energy trade. That assessment, coming from a body historically cautious in its language, signals a structural rethinking of energy infrastructure investment that will outlast the immediate conflict by years.
What Is Driving Brent Toward $100 Per Barrel?
The Ceasefire Clock and Its Market Mechanics
When the two-week ceasefire framework was first announced on approximately April 8, 2026, contingent on Iran reopening the Strait of Hormuz, Brent crude fell sharply, losing roughly 16.72% to settle around $91 per barrel. This price drop reflected markets pricing in a de-escalation scenario with high conviction. It was, as events unfolded, premature.
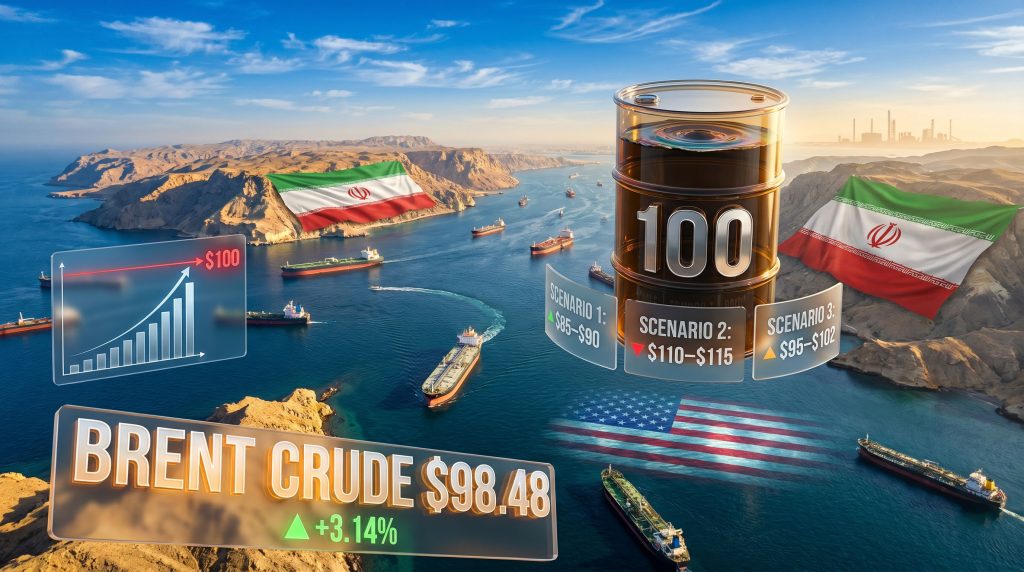
As diplomatic talks were repeatedly postponed and the deadline pushed to Wednesday evening, April 22, 2026, Brent recovered to approximately $98.48 per barrel, gaining 3.14% in a single session, while WTI crude climbed toward $90.70. The price recovery tracked the deterioration in diplomatic momentum almost tick for tick.
A particularly unusual feature of this market environment is the role of presidential social media communications as a real-time price signal. Trump's public statements indicating he had no intention of extending the truce further generated an immediately measurable wave of anxiety across market participants, illustrating how geopolitical decision-making communicated via informal channels has become embedded in oil price discovery.
Three Scenarios Traders Are Pricing Right Now
Market participants are not trading a single outcome. They are probability-weighting three discrete pathways simultaneously.
Scenario 1: Ceasefire Holds and Strait Reopens
- Brent likely retreats toward the $85 to $90 per barrel range as Iranian crude supply re-enters global trade flows
- Goldman Sachs has modelled a rapid production recovery scenario under this pathway
- Asian LNG import volumes would begin recovering from multi-year lows, and JKM pricing would stabilise
Scenario 2: Talks Collapse and Conflict Resumes
- Brent breaks above $100 per barrel with further escalation potential toward $110 to $115
- JPMorgan has communicated through public channels that oil prices retain meaningful upside from current levels
- Kuwait force majeure volumes, Iraq's overland rerouting efforts, and accelerated U.S. Strategic Petroleum Reserve drawdowns would all intensify in parallel
Scenario 3: Prolonged Diplomatic Limbo (Most Likely Near-Term)
- Brent oscillates in the $95 to $102 range as markets price sustained uncertainty rather than binary resolution
- Volatility remains structurally elevated with each social media statement or diplomatic non-event treated as a tradeable signal
- The UK government has formally warned that the price shock environment could persist for up to eight months, establishing a medium-term elevated price floor
The $100 per barrel threshold matters beyond psychology. Above this level, governments face intensified pressure to deploy emergency reserves, enforce price controls, and make diplomatic concessions. It also activates demand destruction in price-sensitive emerging markets, creating a self-limiting mechanism that shapes the ceiling as much as the floor.
For a broader understanding of the current environment, a comprehensive crude oil market overview helps contextualise how these scenarios fit within longer-term pricing trends.
The LNG Paradox: Falling Gas Prices in a Supply Shock
When a Blockade Creates Demand Destruction Instead of Scarcity Pricing
One of the most counterintuitive features of the current energy crisis is the divergence between crude and LNG pricing. While Brent eyes $100 as ceasefire deadline looms as an imminent milestone, Northeast Asia's Japan-Korea-Marker benchmark for LNG has fallen to approximately $15 per MMBtu — the lowest level recorded since the conflict began.
Total Asian LNG import volumes are forecast to decline to approximately 19.2 million tonnes in April 2026, the weakest monthly reading since April 2020 and roughly 11% below year-ago levels. This is not a supply scarcity dynamic. It is demand destruction: buyers who cannot physically receive cargoes through a closed strait are substituting away from LNG entirely rather than paying elevated spot prices for alternative routing.
The mechanism is distinct from what drives crude markets higher. Crude tankers can, at significant cost premium, reroute around the Cape of Good Hope. However, LNG tankers face the same physical blockade but with less economic flexibility to absorb extended voyage durations given their charter structures and regasification terminal scheduling requirements. The LNG supply outlook for the remainder of 2026 has consequently deteriorated sharply.
Qatar's Ras Laffan: The Structural Wound
Compounding the Hormuz closure is the damage sustained by Qatar's Ras Laffan industrial complex following Iranian drone strikes. The attacks have taken approximately 13 million tonnes per annum (mtpa) of LNG liquefaction capacity offline, with the expected outage duration estimated at one to two years. Qatar's total infrastructure damage from these strikes has been valued at approximately $20 billion.
The downstream consequences are already materialising in stark terms:
- Pakistan, heavily dependent on Qatari LNG supply, has effectively exited the spot LNG market entirely following the attacks
- Term buyers globally are scrambling for alternative supply, but U.S. LNG export infrastructure faces structural constraints in replacing lost Qatari volumes at the required scale and speed
- The dual nature of this supply shock — physical blockade of the transit route combined with destruction of production capacity — cannot be resolved through spot market reallocation alone
This is a dual-pathway supply shock. One pathway can potentially be resolved by diplomacy. The other — the physical destruction of 13 mtpa of Qatari liquefaction infrastructure — requires multi-year reconstruction regardless of any ceasefire outcome.
How Governments and Corporations Are Adapting
The U.S. Strategic Petroleum Reserve: A Historic Drawdown
The U.S. Department of Energy has completed three separate Strategic Petroleum Reserve releases since the conflict began. The most recent loan totalled 26.03 million barrels delivered to domestic refiners including ExxonMobil, Marathon, and BP. Across all three releases, the total SPR volume deployed has reached 80 million barrels — a historically significant intervention.
For context, the U.S. SPR holds a maximum capacity of approximately 714 million barrels. The current drawdown represents roughly 11% of total capacity deployed within weeks. Trump has publicly contradicted his Energy Secretary's assessment that gasoline prices may not fall below $3 per gallon until early 2027, insisting that prices will decline as soon as the Iran conflict concludes.
The Corporate Response Matrix
| Actor | Response Measure | Scale and Detail |
|---|---|---|
| Kuwait (KPC) | Force majeure declared on crude exports | Only 3 tankers loaded in April 2026 |
| Iraq (SOMO) | Overland exports via Syria's Rabia crossing | ~650,000 metric tonnes of fuel oil targeted |
| South Korea | Naphtha import subsidies | $458 million allocated for April to June 2026 |
| China (NDRC) | Domestic fuel price cap reductions | First cut since conflict began; product export ban partially enforced |
| Norway | Maximised North Sea output | Production up ~4% YoY to 4.35 million boe/d in March 2026 |
| Russia | Production curtailed by drone strikes | ~300,000 to 400,000 b/d reduction in April 2026 |
| Serbia (NIS/Pancevo) | U.S. sanctions waiver extended | 100,000 b/d refinery operations approved through June 16 |
The Russia-Kazakhstan Pipeline Complication
A secondary supply pressure point has emerged with Russia's announcement that it will halt all pipeline oil flows from Kazakhstan to Germany via the Druzhba pipeline effective May 1, 2026, cutting approximately 50,000 barrels per day of supply to European markets. This move layers additional tightness onto an already constrained European crude balance and illustrates how the Hormuz crisis is being exploited to apply leverage across separate but related energy infrastructure systems.
Iraq's reopening of the Rabia border crossing with Syria — the first time in over a decade — reflects the degree to which regional exporters are improvising alternatives to Gulf export routes. The SOMO overland routing through Syria represents a workaround of last resort, logistically complex and geopolitically sensitive, but it demonstrates that producers are not passively absorbing the closure.
China's response has been internally contradictory in revealing ways. The NDRC cut domestic retail gasoline and diesel price caps for the first time since the conflict began, while simultaneously attempting to restrict refined product exports. In practice, shipping data through April 20, 2026 showed that Chinese refined product exports to Southeast Asia and Australia continued despite the alleged export ban, suggesting enforcement gaps in Beijing's stated policy position.
Geopolitical Fractures and Long-Term Structural Shifts
Allied Divergence and the IEA's Structural Warning
Germany has signalled a significant rupture with Washington over U.S. military operations against Iran, reflecting growing European concern about the economic consequences of a prolonged conflict. This fracture matters beyond diplomatic optics: European energy security planning assumptions were built on Hormuz reliability, and the IEA's institutional assessment that this reliability has been permanently compromised forces a fundamental revision of infrastructure investment strategy across the continent.
The IEA's executive director has, furthermore, taken the step of arguing that the Iran conflict will permanently reduce future global oil demand by accelerating the energy transition. This is a structurally bearish long-term signal embedded within a short-term bullish price environment — a combination that creates significant complexity for capital allocation decisions in the upstream sector. The broader oil price impacts stemming from this disruption are already being felt well beyond the immediate conflict zone.
China's Electrification Hedge
Chinese refiners with documented connections to Iranian crude procurement have faced escalating U.S. sanctions pressure, complicating Beijing's ability to access discounted Iranian barrels at the volumes it has historically absorbed. Simultaneously, China's accelerated investment in electrification and clean technology is being framed domestically as an energy security hedge rather than purely an environmental strategy.
This reframing is significant: it suggests that the Hormuz crisis may structurally reduce Chinese oil import dependency over the medium term, with consequences for global demand forecasting that extend well beyond the current conflict.
ENI's Indonesian Discovery: A Long-Cycle Signal
Italy's ENI has announced a significant offshore gas discovery in Indonesia through its Geliga-1 exploration well, with reported estimates of approximately 5 trillion cubic feet of gas and 300 million barrels of condensate. While this has no near-term supply implications, it represents a meaningful addition to non-Middle Eastern gas supply capacity entering the development pipeline at precisely the moment when the strategic case for Hormuz-independent supply has never been stronger.
The timing of the discovery, and its Indonesian location, underscores the accelerating investor interest in supply sources that are structurally disconnected from Persian Gulf transit risk.
The next major ASX story will hit our subscribers first
The Oil Market Risk Matrix: Late April 2026
| Risk Factor | Current Status | Price Impact Direction |
|---|---|---|
| U.S.-Iran ceasefire deadline | Expired with uncertainty; extended talks | Bullish (upward pressure) |
| Strait of Hormuz closure | Ongoing; IRGC enforcing | Strongly bullish |
| Qatar LNG capacity loss (13 mtpa) | 1 to 2 year outage expected | Bullish crude; bearish LNG |
| U.S. SPR releases (80 mb total) | Active; third release completed | Bearish offset |
| Russia-Kazakhstan pipeline halt | Effective May 1, 2026 | Modestly bullish for Europe |
| Norway production beat | +4% YoY in March 2026 | Modestly bearish offset |
| China demand and export restrictions | Fuel price caps cut; exports curtailed partially | Neutral to bearish |
| Goldman Sachs forecast revision | Raised; further upside noted | Sentiment bullish |
| JPMorgan outlook | Prices have further to rise | Sentiment bullish |
Frequently Asked Questions
Why Does $100 Per Barrel Function as Such a Critical Threshold?
The level acts simultaneously as a psychological resistance point and a policy activation trigger. Above $100, governments face intensified pressure to deploy emergency reserves, implement price controls, and pursue diplomatic concessions. It also activates demand destruction in price-sensitive emerging markets, creating a self-correcting ceiling mechanism that shapes the upper bound of sustained pricing.
Why Are LNG Prices Falling While Crude Surges?
The Hormuz closure has paradoxically suppressed LNG demand by making physical delivery impossible for many buyers. Rather than bidding up spot prices for alternative cargoes, buyers are substituting away from LNG entirely or drawing down storage, producing a demand destruction dynamic rather than the scarcity pricing one would expect from a supply shock.
How Significant Is an 80-Million-Barrel SPR Drawdown?
Against a total U.S. SPR capacity of approximately 714 million barrels, the current 80-million-barrel drawdown represents roughly 11% of maximum capacity deployed within weeks. This is a historically substantial intervention that underscores the severity of the physical supply disruption and leaves a meaningfully thinner buffer for any subsequent escalation.
What Is the Fastest Realistic Path to Lower Oil Prices?
A verified diplomatic agreement that includes observable Hormuz reopening, combined with confirmed Iranian compliance, would likely trigger a rapid selloff toward the $85 to $90 per barrel range as the geopolitical risk premium unwinds. Goldman Sachs has modelled this rapid recovery scenario under a ceasefire-holds pathway. Analysts tracking the ceasefire developments note that with Brent eyes $100 as ceasefire deadline looms, every diplomatic signal carries outsized market weight.
Could the Conflict Spread Beyond Iran and the United States?
The systemic risk profile has already broadened significantly. Russia has deployed pipeline leverage, Kuwait has declared force majeure, China faces sanctions exposure on Iranian crude imports, and Germany has publicly diverged from U.S. policy. The conflict has drawn in secondary actors across multiple dimensions, making clean de-escalation structurally more complex than the bilateral framing of U.S.-Iran talks suggests.
This article is intended for informational purposes only and does not constitute financial or investment advice. Oil price forecasts cited from Goldman Sachs, JPMorgan, and the IEA represent institutional views subject to change and should not be interpreted as guarantees of future market outcomes. Readers should conduct independent due diligence before making any investment decisions related to energy commodities or related securities.
Want to Stay Ahead of the Next Major Resource Discovery Driving Markets?
While geopolitical shocks reshape global energy pricing, Discovery Alert's proprietary Discovery IQ model delivers real-time alerts on significant ASX mineral discoveries — transforming complex resource data into actionable investment insights for traders and long-term investors alike. Explore why major discoveries have historically generated extraordinary returns by visiting Discovery Alert's dedicated discoveries page, and begin your 14-day free trial today to position yourself ahead of the market.