June 25, 2026
The Market That Priced In Peace Before the Barrels Arrived
Oil markets have always been prone to running ahead of physical reality. Geopolitical risk premiums inflate faster than supply chains can rupture, and they deflate faster than infrastructure can heal. This asymmetry between sentiment and supply is not a new phenomenon, but the current Strait of Hormuz recovery has produced one of the starkest examples of that gap in recent memory. Understanding why Brent falls as Strait of Hormuz oil flows recover requires looking past the headline price move and into the barrel-by-barrel mechanics of what a genuine supply recovery actually demands.
When big ASX news breaks, our subscribers know first
The Numbers Behind the Narrative: Where Prices Stand Today
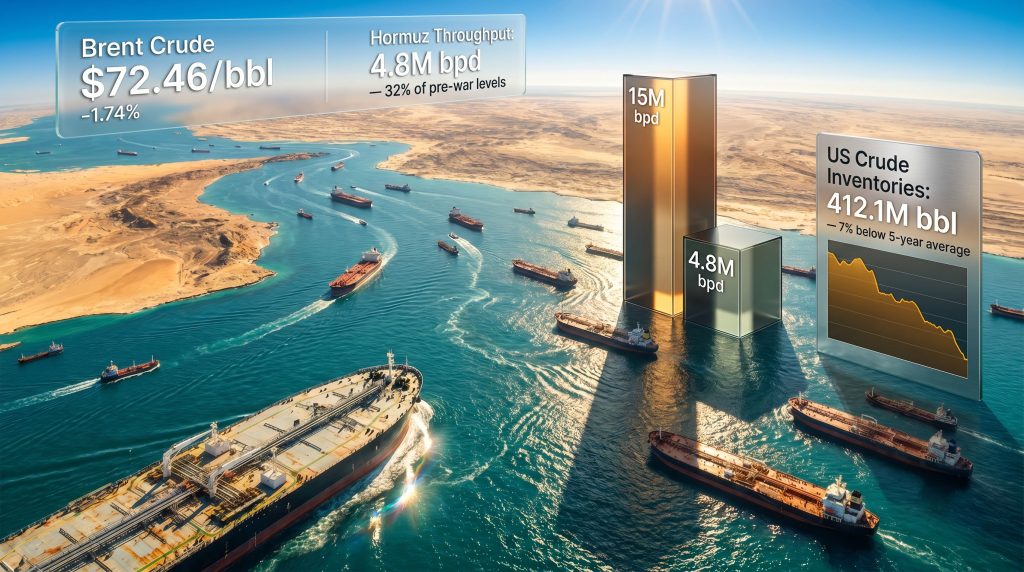
As of June 25, 2026, Brent crude settled at $72.46 per barrel, a decline of 1.74% on the session, while WTI fell 1.63% to $69.19 per barrel. Both benchmarks touched their lowest levels since February 27, effectively retracing the entirety of the geopolitical risk premium that built up during the conflict period.
The price retreat is striking on its surface. A major supply disruption at the world's most critical oil chokepoint has partially resolved, and the market's response has been to sell. However, context transforms that observation into something more nuanced.
Market Snapshot – June 25, 2026
| Benchmark | Price | Daily Change | Context |
|---|---|---|---|
| Brent Crude | $72.46/bbl | -1.74% | Lowest since February 27, 2026 |
| WTI Crude | $69.19/bbl | -1.63% | Lowest since February 27, 2026 |
| Hormuz Throughput | 4.8M bpd | Recovery phase | 32% of pre-war baseline |
| Pre-War Hormuz Flow | 15M bpd | Baseline reference | ~20% of global seaborne oil |
| US Crude Inventories | 412.1M bbl | Below average | 7% under 5-year average |
February 27 was the final trading session before the US-Israeli military campaign against Iran commenced. In a single trading day following the ceasefire, Brent effectively erased months of conflict-driven premium, returning to pre-war price levels even though physical oil flows through the strait remain severely constrained. For broader context on crude oil price trends, the speed of this reversal is historically unusual.
Why the Strait of Hormuz Defines Global Oil Pricing
Geography as Leverage: 33 Kilometres That Move 20% of Global Seaborne Oil
The Strait of Hormuz connects the Persian Gulf to the Gulf of Oman, and its strategic importance is disproportionate to its physical dimensions. At its narrowest navigable point, the strait spans roughly 33 kilometres, yet before the conflict it channelled approximately 15 million barrels of crude oil per day, representing close to 20% of all seaborne oil trade globally. No alternative routing exists that can absorb that volume without substantially higher costs and transit times.
When Tehran closed the strait on February 28, the consequences were immediate and severe. Tankers that had already entered the Persian Gulf found themselves effectively imprisoned. Cargo scheduled for loading at Iraqi, Kuwaiti, Saudi, and Iranian terminals could not depart. At peak disruption, an estimated 94 million barrels of crude were stranded inside the strait — an extraordinary concentration of energy supply locked behind a geographic pinch point.
What the February 28 Closure Actually Disrupted
The strait closure did not simply interrupt oil flows. It created a cascading series of market dislocations, and oil geopolitics analysis underscores just how interconnected these pressures became:
- Tanker operators faced prolonged vessel immobilisation, generating significant demurrage costs
- Refiners in Asia and Europe scrambled to secure alternative crude grades from West Africa, the North Sea, and the Americas
- Insurance premiums for Persian Gulf voyages spiked to levels that rendered some commercial routes economically unviable
- Approximately 11,000 seafarers were stranded aboard vessels unable to transit, triggering an International Maritime Organization evacuation planning process
The 32% Problem: Why Throughput Recovery Is Slower Than Price Recovery
Outbound Versus Inbound: The Distinction That Changes Everything
Confirmed Hormuz throughput has reached approximately 4.8 million barrels per day, the highest reading since the February 28 closure. On the surface, this appears to represent meaningful progress. In practice, the composition of that recovery matters enormously.
UBS analyst Giovanni Staunovo has identified a critical structural distinction: the vast majority of current throughput reflects stranded vessels departing the strait rather than new inbound cargo movements arriving to load fresh crude. Since the ceasefire, at least 20 tankers carrying 35 million barrels have exited the Hormuz, but this outbound release represents inventory that was already inside the Gulf, not new supply entering the global market.
The difference between a tanker leaving and a tanker arriving is the difference between releasing a buffer and restoring a pipeline. Markets appear to have treated these as equivalent events, which explains the gap between current pricing and physical supply reality.
Furthermore, reporting from Business Times confirms that while supply is technically moving through the strait, the normalisation of inbound commercial flows remains well behind what headline throughput figures suggest.
Why Mine Clearance Is the True Bottleneck
The reason inbound traffic remains suppressed is not the ceasefire status but the mine clearance status. US Energy Secretary Chris Wright acknowledged publicly that full strait normalisation will require several additional weeks due to ongoing demining requirements. Until mine clearance is independently verified, commercial marine insurers will not return their Persian Gulf war risk premiums to pre-conflict levels.
This creates a two-stage recovery framework that oil prices have effectively collapsed into a single event:
- Stage 1 – Outbound release: Stranded tankers exit the strait after months of immobilisation. This is actively underway and accounts for the current 4.8 million bpd throughput reading.
- Stage 2 – Inbound normalisation: New cargo flows resume only after verified mine clearance enables insurance premium normalisation. This stage has not yet meaningfully begun and could take weeks to months to materialise.
The Joint Maritime Information Center has downgraded its threat assessment from "critical" to characterising an attack as possible but not probable — a meaningful directional signal, but not the verified clearance that commercial shipping insurers require to restore normal premium structures. Banks forecast a months-long recovery for Hormuz oil flows, reinforcing the view that physical normalisation will lag well behind financial market assumptions.
US Supply Data: The Physical Market Tells a Different Story
Inventories, Utilisation, and the EIA Signal
While financial markets have priced in resolution, the physical supply data presents a more cautious picture. US commercial crude inventories stood at 412.1 million barrels for the week ended June 19, approximately 7% below the five-year seasonal average. The prior week saw a drawdown of 6.1 million barrels, a significant reduction that underscores continued tightness in physical supply despite the geopolitical de-escalation.
| US Supply Indicator | Reading | Market Significance |
|---|---|---|
| Crude Inventories | 412.1M barrels | 7% below 5-year average |
| Weekly Draw (w/e June 19) | -6.1M barrels | Continued tightening signal |
| Refinery Utilisation | 96.1% of capacity | Near operational ceiling |
| Hormuz Confirmed Flow | 4.8M bpd | 32% of pre-war baseline |
US refineries operated at 96.1% of capacity during the same reference week. This figure carries dual significance. Near-maximum utilisation indicates healthy demand for crude inputs, but it also eliminates the industry's ability to meaningfully increase throughput should a renewed supply disruption emerge. Refineries running at 96% have virtually no surge capacity to buffer a secondary shock.
The next EIA Weekly Petroleum Status Report represents a critical data point. A consecutive large inventory draw would confirm that the physical market remains tighter than current crude prices imply, potentially providing the catalyst for a price correction upward.
Three Scenarios for Brent: What Comes Next
Mapping the Pathways Forward
Base Case – Gradual Normalisation:
The demining process concludes within US Energy Secretary Chris Wright's projected timeframe. Inbound cargo movements progressively resume, driving Hormuz throughput back toward the 15 million bpd pre-war baseline over several weeks. Brent stabilises near the $72 range as supply risk continues to fade and the IMO seafarer evacuation plan covering more than 11,000 stranded crew members concludes without incident.
Bear Case – OPEC Fragmentation Amplifies Uncertainty:
Iraq follows the UAE's precedent and exits OPEC after failing to negotiate a higher production quota. Internal OPEC discipline deteriorates at precisely the moment Iran's US sanctions waiver expires on August 21. The combination of structural supply management failure and renewed Iranian export uncertainty rebuilds a risk premium that drives Brent higher. Consequently, OPEC market influence becomes a decisive variable in how this scenario unfolds.
Bull Case for Lower Prices – Supply Outpaces Sentiment:
Iranian crude output does not increase materially following the August 21 sanctions waiver expiry, and Hormuz traffic returns progressively to near-normal levels. Incremental supply from restored throughput, combined with already-weak demand signals, pushes Brent below the current $72.46 floor as the physical market converges with the pricing market's optimistic assumptions.
Analyst forecasts published in mid-2026 suggest Brent could average approximately $86 per barrel across the full year before declining toward $70 per barrel in 2027 as global supply progressively stabilises. These are forward-looking estimates and carry material uncertainty.
The next major ASX story will hit our subscribers first
August 21: The Sanctions Deadline That Could Redefine the Market
Iran's Export Recovery and the Waiver That Enables It
Iranian tankers moved approximately 21 million barrels through the Strait of Hormuz during June alone, representing a meaningful portion of the current throughput recovery. This volume is permitted under a 60-day US sanctions waiver on Iranian crude oil sales — a temporary carve-out that expires on August 21, 2026.
Goldman Sachs has indicated that even if the waiver is extended, a significant increase in underlying Iranian crude production capacity is not the base-case expectation. Iranian production infrastructure has not expanded materially during the conflict period, and the export volumes currently transiting Hormuz reflect accumulated inventory releases rather than new well output.
If the waiver expires without renewal, the 21 million barrels of June throughput that Iranian tankers contributed would face export restrictions, directly reducing the supply recovery that Brent pricing currently assumes. This single policy decision on a specific date represents arguably the most consequential near-term variable in global oil markets. Furthermore, the broader trade war oil markets dynamic adds another layer of complexity to how Washington may approach that renewal decision.
OPEC's Structural Stress Test
Why Member Defections Change the Supply Management Calculus
The UAE's exit from OPEC earlier in 2026 has created a precedent that is now actively shaping internal OPEC dynamics. Iraq has publicly stated it will consider all options, including membership withdrawal, if its production quota is not raised to reflect its operational capacity and fiscal requirements.
| OPEC Stress Factor | Current Status | Implication for Supply |
|---|---|---|
| UAE Membership | Exited OPEC | Reduced collective coordination |
| Iraq Quota Dispute | Threatening exit | Potential discipline breakdown |
| Iran Sanctions Waiver | Expires August 21 | Post-August supply uncertainty |
| Iranian June Exports | ~21M barrels via Hormuz | Partial recovery, waiver-dependent |
The interaction between OPEC fragmentation and Iranian export recovery creates a particularly complex scenario. If Iraq exits and Iranian exports face renewed restrictions simultaneously, the organisation loses two significant production contributors at the same time it attempts to manage a post-conflict market normalisation.
How to Monitor This Market: A Practical Framework
The Data Sources That Matter More Than Headlines
Ceasefire announcements and diplomatic communiques move oil prices in real time, but they are poor predictors of where physical supply will land in four to eight weeks. Investors seeking to understand the genuine trajectory of Brent crude should prioritise the following monitoring framework:
Weekly priorities:
- EIA Petroleum Status Report inventory direction (next report due Wednesday): watch for whether the 6.1 million barrel draw continues or reverses
- Kpler real-time Hormuz throughput data: the critical metric is not total vessel movements but confirmed inbound cargo flows, which signal genuine pipeline restoration rather than buffer release
- JMIC threat rating: any return toward "critical" classification would signal that mine clearance has encountered complications
Calendar-driven triggers:
- August 21 sanctions waiver renewal decision: the single highest-impact known date on the forward calendar
- Iraq OPEC membership resolution: a departure would structurally alter production discipline
- Goldman Sachs and UBS Iranian production trajectory updates: institutional desk assessments of post-waiver Iranian output capacity
FAQ: Brent Crude and the Hormuz Recovery Explained
Why Did Brent Fall If the Strait of Hormuz Has Not Fully Recovered?
Markets priced in geopolitical resolution faster than physical barrels returned to supply chains. The ceasefire removed the fear premium even though throughput sits at just 32% of pre-war levels.
What Is the Difference Between Outbound and Inbound Hormuz Flows?
Outbound flows are stranded tankers leaving after months of immobilisation. Inbound flows are new cargo vessels arriving to load fresh crude. Only inbound normalisation genuinely restores supply pipeline capacity.
What Is the Significance of August 21, 2026?
This is the expiry date of the US sanctions waiver on Iranian crude oil exports. Non-renewal would restrict Iranian export volumes that contributed approximately 21 million barrels of Hormuz throughput in June alone.
Why Does Refinery Utilisation at 96.1% Matter for Supply Shock Risk?
Refineries operating near maximum capacity cannot increase crude processing if a secondary supply disruption emerges, removing a key demand-side buffer from the market.
What Would Cause Brent to Rise From Current Levels?
The three primary reversal triggers are: a JMIC threat rating return to "critical," a non-renewal of the Iran sanctions waiver on August 21, or a consecutive large EIA inventory draw confirming physical tightness.
Price Has Outrun the Pipeline: What Investors Should Understand
The core analytical tension in today's oil market is straightforward to state but difficult to trade around. Brent falls as Strait of Hormuz oil flows recover, yet Brent at $72.46 reflects a market that has fully priced in ceasefire resolution even though physical infrastructure remains at just 32% of pre-war throughput capacity. US crude inventories are 7% below their five-year average, refineries are running near their operational ceiling, and the most consequential policy decision of the near-term cycle sits on a fixed calendar date six weeks away.
The gap between market sentiment and physical supply reality is the defining risk variable for Brent crude in the weeks ahead. Flow data, not diplomatic headlines, will determine whether current prices are the floor or the ceiling.
Investors monitoring this situation should treat Kpler throughput data and EIA weekly reports as primary signals rather than secondary confirmation. The moment inbound Hormuz cargo flows begin recovering alongside the outbound release already underway, the physical and financial markets will begin to converge in a more durable way. Until that moment, the current Brent price is best understood as sentiment-led rather than supply-confirmed.
This article contains forward-looking statements, scenario projections, and analyst estimates that carry material uncertainty. Nothing in this article constitutes investment advice. Readers should conduct independent research and consult qualified financial professionals before making investment decisions.
Want to Stay Ahead of Major Commodity Discoveries Before the Market Moves?
While oil markets grapple with the gap between sentiment and physical supply reality, Discovery Alert's proprietary Discovery IQ model delivers real-time alerts on significant ASX mineral discoveries — instantly translating complex commodity data into actionable opportunities for both traders and long-term investors. Explore historic examples of exceptional discovery returns and begin your 14-day free trial today to position yourself ahead of the broader market.