June 21, 2026
The Geopolitics of Energy Chokepoints: When Geography Becomes Destiny
Energy markets do not respond to politics in a linear fashion. They respond to geography. And when geography is weaponised, the consequences ripple outward with a speed and force that no monetary policy tool, strategic reserve, or diplomatic communique can fully contain. The Strait of Hormuz has never been merely a waterway. It is a structural vulnerability embedded at the heart of the global energy system. When that corridor comes under credible threat, Brent jumps above $114 on Gulf tensions, and the market does not wait for confirmation. It prices the fear first.
That dynamic played out with full force on May 5, 2026, when crude oil geopolitics drove benchmarks to register one of the sharpest single-session surges in recent memory, as Iranian military actions in the Gulf moved from maritime harassment into direct kinetic escalation against commercial shipping and land-based energy infrastructure.
When big ASX news breaks, our subscribers know first
Brent Jumps Above $114 on Gulf Tensions: The Price Action in Detail
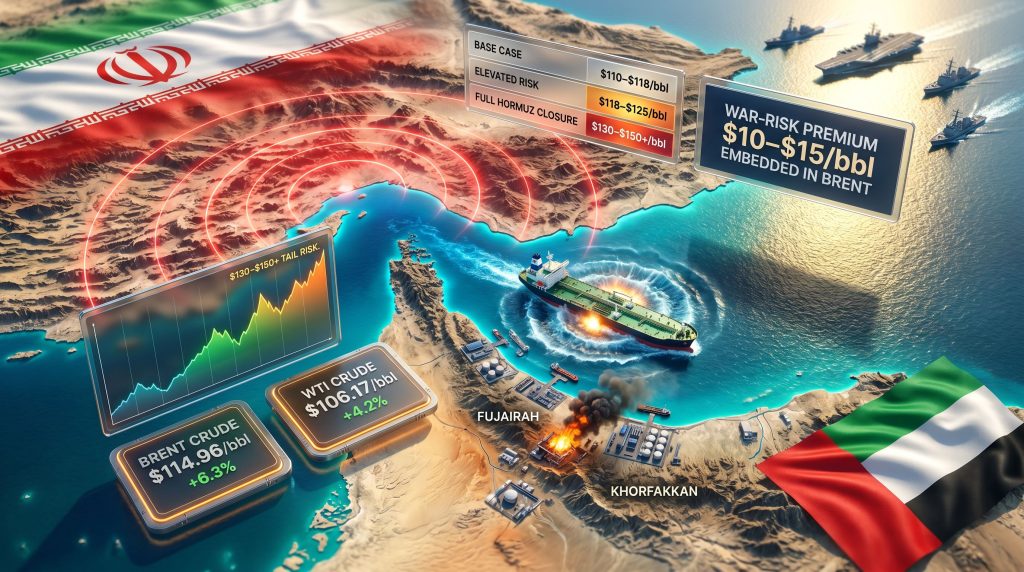
The headline numbers from Monday's session tell a stark story. Brent crude surged $6.79 to reach $114.96 per barrel, a gain of 6.3% within a single trading session. US West Texas Intermediate followed, climbing $4.23 to $106.17, representing a 4.2% move. Both benchmarks reflected not a marginal repricing of risk but a wholesale reassessment of physical supply security across the Gulf energy corridor.
The price table below captures the scope of Monday's benchmark movements:
| Benchmark | Price Level | Single-Session Change | Percentage Move |
|---|---|---|---|
| Brent Crude | $114.96/bbl | +$6.79 | +6.3% |
| WTI Crude | $106.17/bbl | +$4.23 | +4.2% |
| UAE Murban | $114.80/bbl | Elevated | Material |
| Russian Urals | $121.17/bbl | Elevated | +14.6% |
What distinguishes Monday's move from routine geopolitical noise is the simultaneous elevation of multiple regional benchmarks. When a single benchmark spikes while others remain stable, markets are typically pricing a localised or transitory event. When the entire regional benchmark complex moves in concert, however, it signals something more systemic: a structural repricing of Gulf energy risk that cuts across crude grades, quality differentials, and logistical pathways.
"The simultaneous elevation of Brent, WTI, Murban, and Urals benchmarks is not a pricing anomaly. It represents a collective market judgement that the geographic architecture of global oil supply has been fundamentally destabilised."
Understanding the Escalation: What Actually Happened on May 5?
Monday's price move was not triggered by rhetoric or sanctions announcements. It was triggered by physical incidents. Two events in particular crystallised market fear into observable price action, consequently driving the oil market disruption to its most acute level in recent years.
First, a South Korean-flagged commercial vessel was struck by an explosion as it transited the Strait of Hormuz. The nationality of the vessel carries significance beyond the incident itself. South Korea ranks among the world's largest importers of liquefied natural gas and crude oil, drawing heavily from Middle Eastern suppliers. An attack on a vessel flagged by a major Asian energy importer signals to every importing nation in the Asia-Pacific region that their supply chains carry physical risk that no long-term supply contract can fully insulate against.
Second, Iranian drone assets ignited a fire at a UAE oil port facility. This incident represents a qualitative shift in the character of the conflict. Previous escalations centred on maritime interdiction — the harassment or seizure of vessels within the strait itself. Striking land-based port infrastructure in the UAE introduces a new geographic dimension, extending the risk perimeter from the strait's navigable channel to the broader network of terminals and transfer hubs that enable Gulf crude to reach global markets.
Fujairah and Khorfakkan, the UAE port facilities referenced in Iran's expanded control zone declaration, serve as critical offshore transfer points for crude that has historically moved via pipeline to bypass Hormuz entirely. Targeting these facilities does not just threaten Hormuz transit. It threatens the alternative.
The Hormuz Chokepoint: Why No Alternative Can Fully Replace It
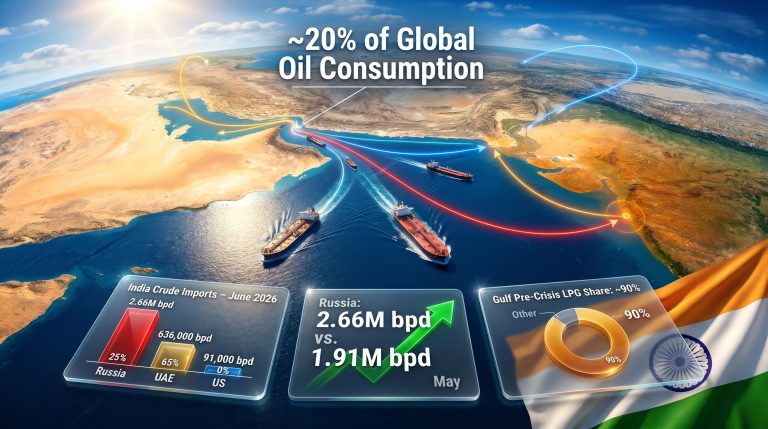
Before the conflict began on February 28, approximately 20% of global oil and liquefied natural gas volumes transited the Strait of Hormuz daily. No other single geographic point in the world's energy infrastructure carries comparable systemic weight. Understanding why requires understanding the strait's basic architecture.
The Strait of Hormuz connects the Persian Gulf to the Gulf of Oman and the broader Arabian Sea. Its navigable channel is narrow, flanked by Iranian territorial waters to the north and Omani territory to the south. The geographic asymmetry is critical: Iran's territorial proximity to the navigable lane gives it both the capability and the legal pretext to complicate, harass, or deny passage.
Several factors, furthermore, compound the strait's irreplaceability:
- Existing pipeline infrastructure (including the East-West Pipeline through Saudi Arabia and the Abu Dhabi Crude Oil Pipeline to Fujairah) carries meaningful but limited capacity relative to total Hormuz-dependent volumes
- Alternative maritime routes, most notably the Cape of Good Hope passage around southern Africa, add 10 to 14 days to shipping timelines, compressing effective supply availability and straining tanker fleet scheduling globally
- LNG carriers face particular constraints, as their size, cargo volatility, and specialist terminal requirements limit routing flexibility compared to conventional crude tankers
- War-risk insurance surcharges applied to vessels transiting conflict zones create immediate freight cost escalation that flows through to delivered crude prices regardless of benchmark movements
The 1980s Tanker War and the 2019 Gulf of Oman tanker attacks provide instructive historical precedents. In both cases, even partial disruption to transit confidence caused outsized market reactions relative to actual supply volumes affected. The threat of closure, not closure itself, drives the pricing premium.
Decomposing the Price: Fundamentals Versus the Fear Premium
Energy market analysts typically decompose crude price levels into two distinct components during geopolitical escalation cycles. The first is the supply-side fundamental: what has actually changed about physical production, export volumes, or verified delivery schedules. The second is the geopolitical risk premium: what the market is pricing in anticipation of future disruption, regardless of whether that disruption materialises.
In the current environment, upstream production volumes have not yet been confirmed as disrupted. The 6.3% surge in Brent reflects the market's forward assessment of what could happen to supply, not what has already happened to it. Analyst estimates suggest the war-risk premium currently embedded in Brent pricing may account for approximately $10 to $15 per barrel of the current benchmark level, though this figure represents analytical inference rather than a precisely measurable quantity.
This distinction matters enormously for interpreting price trajectories. A fundamentals-driven price spike is supported by reduced physical supply and tends to persist until production recovers. A fear-premium spike is supported only by sustained uncertainty and can reverse sharply if de-escalation signals emerge.
Disclaimer: Price projections and scenario analyses referenced in this article represent market commentary and analytical inference. They do not constitute financial advice. Commodity markets are subject to rapid change, and past price patterns during geopolitical events do not reliably predict future outcomes.
Scenario Analysis: Where Could Brent Go From Here?
| Scenario | Trigger Condition | Brent Price Projection |
|---|---|---|
| Base Case (Partial Disruption) | Tanker avoidance, no full closure | $110 to $118/bbl |
| Elevated Risk Case (Infrastructure Attacks Continue) | UAE port facilities repeatedly targeted | $118 to $125/bbl |
| Tail Risk (Full Hormuz Closure) | Iranian naval blockade of the strait | $130 to $150+/bbl |
| De-escalation Case (Ceasefire Restored) | Diplomatic breakthrough, verified compliance | $90 to $100/bbl |
The distribution of these scenarios reflects a market that is asymmetrically exposed to the upside. The de-escalation pathway has been substantially narrowed by the intensity of Monday's kinetic escalation and by political signals from Tehran suggesting a hardened posture.
The WTI-Brent Dynamic: Reading the Inversion Signal
Under normal market conditions, Brent crude trades at a premium to WTI. When this premium compresses or inverts, it sends a specific message to physical traders: US-sourced barrels are being repriced to reflect their logistical advantage during periods of Gulf supply insecurity. Historically, pronounced WTI-Brent spread compression during Gulf conflict periods has preceded further Brent appreciation as physical traders scramble to secure non-Gulf supply.
The next major ASX story will hit our subscribers first
Regional Exposure: Who Bears the Greatest Risk?
The distribution of vulnerability to a sustained Hormuz disruption is highly uneven across consuming regions. Asian economies sit at the acute end of the exposure spectrum for several interconnected reasons:
- China, India, Japan, and South Korea collectively account for the largest share of Hormuz-transiting crude volumes
- Japan and South Korea maintain near-total import dependency on Middle Eastern crude, with limited geographic diversification in their supply portfolios
- India sources an estimated 60% of its crude imports from Gulf region suppliers including the UAE, Saudi Arabia, and Iraq
- Asian LNG buyers face compounded exposure, as both pipeline gas alternatives and LNG spot pricing respond directly to Hormuz transit risk
European nations face a secondary but meaningful exposure channel. In addition, European gas price pressures are compounded by the continent's post-2022 transition away from Russian pipeline gas, which made LNG a structural component of its energy supply mix. The United States, however, occupies a distinctive position as a net crude exporter, creating an internal distributional tension between the production sector and the broader consumer economy.
Macro Consequences: Inflation, Central Banks, and the Stagflation Risk
Every sustained $10 per barrel increase in crude prices is estimated by international monetary institutions to add approximately 0.3 to 0.5 percentage points to headline inflation in major oil-importing economies. Consequently, with Brent having moved nearly $7 in a single session, the macroeconomic implications for monetary policy frameworks are significant.
Central banks in the US, eurozone, and across Asia face a genuinely difficult configuration. Supply-shock inflation driven by geopolitical disruption does not respond to interest rate policy in the way demand-driven inflation does. Raising rates to contain oil-driven price increases risks suppressing economic activity without addressing the underlying supply constraint. The result is a stagflationary dynamic that historical precedent — particularly the 1973 Arab Oil Embargo and the 1979 Iranian Revolution supply shock — suggests can be both persistent and policy-resistant.
OPEC+ Calculus and the Limits of Spare Capacity
OPEC's global market influence becomes particularly complex during Gulf conflict periods. Saudi Arabia is estimated to hold approximately 2 to 3 million barrels per day of spare production capacity that could theoretically offset supply disruption. However, this calculation contains a critical flaw: a substantial portion of that output would still need to transit the Gulf to reach export terminals, making it partially subject to the same Hormuz vulnerability it is meant to offset.
Gulf producers also face an internal revenue calculus. Higher crude prices substantially increase the per-barrel earnings that underpin sovereign budgets across the Gulf Cooperation Council. The financial incentive to allow prices to remain elevated, even while publicly signalling willingness to increase output, creates a nuanced gap between stated OPEC+ policy and observed behaviour that physical market participants have long understood.
The Renewable Energy Paradox
Sustained oil price shocks historically function as an accelerant for energy transition investment. The 1973 and 1979 oil crises catalysed the first generation of serious renewable energy research and policy frameworks. Furthermore, the 2022 energy crisis following Russia's invasion of Ukraine accelerated LNG infrastructure investment and renewable deployment across Europe on a timeline that pre-crisis policy frameworks would not have achieved.
The structural irony of the current Gulf escalation is that its most durable consequence may be to hasten the very energy transition that progressively erodes the geopolitical leverage Gulf oil exporters currently exercise. Every sustained price shock strengthens the economic case for electrification, battery storage investment, and domestic renewable capacity. This dynamic does not resolve the immediate supply crisis, but it provides a structural context within which Monday's surge in Brent crude is not merely a market event — it is a signal about the long-term trajectory of global energy architecture.
Frequently Asked Questions: Brent Crude, Gulf Tensions, and Oil Market Dynamics
Why did Brent jumps above $114 on Gulf tensions occur so rapidly?
Brent crude surged above $114 per barrel following a significant escalation of Iranian military activity in the Gulf region on May 5, 2026. The specific triggers included an explosion striking a South Korean-flagged vessel in the Strait of Hormuz and Iranian drone strikes igniting a fire at a UAE oil port facility. These events raised credible fears of sustained supply disruption through a chokepoint carrying approximately 20% of global oil and LNG flows.
What is the Strait of Hormuz and why does it matter for global oil prices?
The Strait of Hormuz is a narrow maritime passage connecting the Persian Gulf to the Gulf of Oman and the broader Arabian Sea. Its combination of geographic narrowness, proximity to Iranian territorial waters, and lack of scalable alternative routing options makes any credible threat to its navigability an immediate and substantial upward force on global crude benchmarks.
How high could oil prices go if the Strait of Hormuz is closed?
Market scenario analysis projects Brent crude could reach $130 to $150 or more per barrel in a full Hormuz closure scenario. Even partial disruption through tanker avoidance, war-risk insurance surcharges, and infrastructure targeting has already pushed prices to multi-year highs. These projections are analytical estimates, not guaranteed outcomes.
Which economies face the greatest exposure to Hormuz disruption?
Japan, South Korea, China, and India face the most direct exposure given their heavy dependence on Middle Eastern crude transiting the strait. India sources an estimated 60% of its crude imports from Gulf region suppliers. European nations face secondary exposure through LNG pricing linkages and refined product markets.
Can OPEC+ spare capacity offset a Hormuz supply disruption?
Saudi Arabia holds an estimated 2 to 3 million barrels per day of spare production capacity. However, a meaningful portion of this output would still require Gulf transit to reach export terminals, limiting its effectiveness as a full buffer in a sustained Hormuz closure scenario. Alternative pipeline routing exists but faces capacity constraints that prevent complete substitution for Hormuz-dependent volumes.
Want To Know Which ASX Discoveries Could Benefit From Surging Commodity Prices?
When energy and commodity markets reprice sharply on geopolitical disruption, the window for identifying high-potential mineral discoveries can be equally fleeting — Discovery Alert's proprietary Discovery IQ model scans ASX announcements in real time, delivering actionable alerts the moment significant discoveries are announced, so subscribers are never left behind by a fast-moving market. Explore historic examples of what major discoveries have returned and begin a 14-day free trial to gain a genuine market-leading edge.