August 6, 2026
When Price and Inventory Fall Together: Decoding a Rare LME Aluminium Signal
Commodity markets operate on deeply ingrained assumptions. Chief among them is the idea that shrinking inventory should tighten supply conditions and push prices higher. When that logic breaks down, it is rarely random. The LME aluminium cash price and stocks decline observed on August 5, 2026 is one of the more instructive signals a trader, buyer, or analyst can encounter, because it forces a re-examination of what is actually driving price discovery at any given moment.
On August 5, 2026, the London Metal Exchange recorded exactly this kind of session for aluminium. Cash prices fell sharply while stocks continued their gradual decline, and the divergence between near-term and longer-dated contracts added another layer of complexity. To read this data correctly requires moving beyond the headline numbers and interrogating the mechanics beneath them.
When big ASX news breaks, our subscribers know first
The Session Data in Full: What Actually Happened
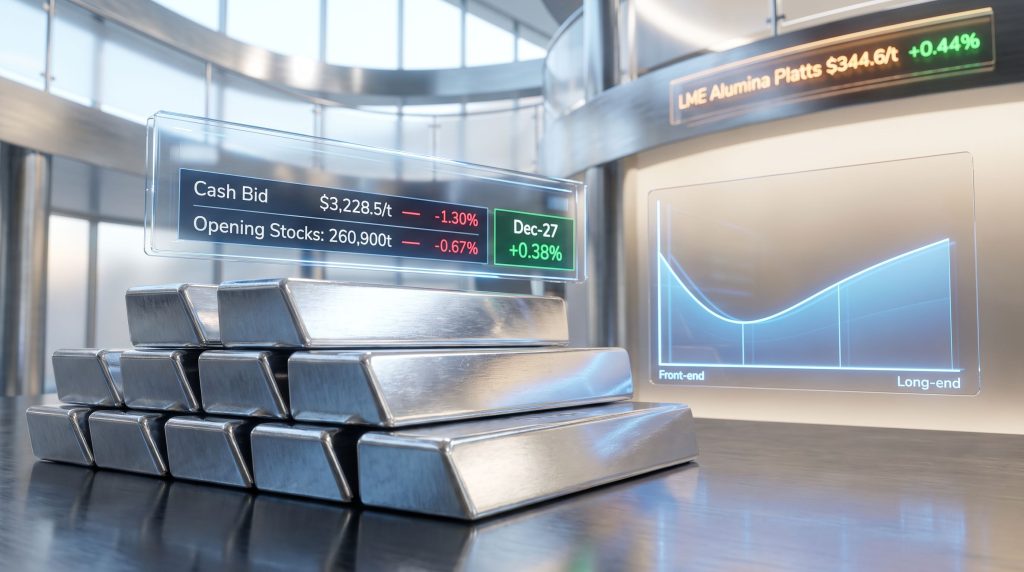
The LME aluminium cash bid price dropped from USD 3,270/t to USD 3,228.5/t, a decline of 1.30% in a single session. The cash offer moved in near-identical fashion, settling at USD 3,229/t. Three-month contracts followed the front end lower, shedding 0.22% across both bid and offer.
The more revealing contrast emerged in the longer-dated contracts and regional benchmarks. December 2027 bid and offer prices both gained 0.38%, closing at USD 3,160/t and USD 3,165/t respectively. Meanwhile, the LME aluminium three-month Asian Reference Price closed at USD 3,241/t, representing a 0.56% gain from the prior session, moving in the direct opposite direction to London cash prices on the same day.
| Metric | Previous Session | August 5, 2026 | Change |
|---|---|---|---|
| Cash Bid Price (USD/t) | $3,270 | $3,228.5 | -1.30% |
| Cash Offer Price (USD/t) | $3,271 | $3,229 | -1.28% |
| 3-Month Bid Price (USD/t) | $3,236 | $3,229 | -0.22% |
| 3-Month Offer Price (USD/t) | $3,236.5 | $3,229.5 | -0.22% |
| Dec-27 Bid Price (USD/t) | $3,148 | $3,160 | +0.38% |
| Dec-27 Offer Price (USD/t) | $3,153 | $3,165 | +0.38% |
| Asian Reference Price (USD/t) | $3,223 | $3,241 | +0.56% |
| Opening Stocks (tonnes) | 262,650 | 260,900 | -0.67% |
| Live Warrants (tonnes) | 244,650 | 244,650 | Unchanged |
| Cancelled Warrants (tonnes) | 16,250 | 14,750 | -9.23% |
| LME Alumina Platts (USD/t) | $343.1 | $344.6 | +0.44% |
Why the Forward Curve Is the Most Useful Tool Here
Short-End Weakness vs. Long-End Resilience
The shape of a forward curve communicates market consensus more reliably than any single price point. On August 5, the front end of the aluminium curve clearly softened, with cash and three-month contracts declining by up to 1.30%. Yet the December 2027 contracts strengthened. This is not a contradiction; it is a diagnosis.
When near-term prices fall while longer-dated contracts hold or advance, the market is effectively saying that current weakness is not expected to persist. Participants with longer time horizons are pricing in a fundamentally tighter market environment over the next 12 to 18 months, even as short-term flows generate downward pressure on prompt prices.
This structure leans toward contango at the front end, which typically favours physical holders and discourages urgent spot procurement. It also signals that the current price decline is being treated as cyclical or sentiment-driven rather than reflective of a genuine demand collapse. Furthermore, understanding how commodity price impacts translate across different contract tenors is essential for correctly positioning during these divergent sessions.
The Asian Reference Price as a Regional Divergence Signal
The 0.56% gain in the Asian Reference Price on a session where London cash fell 1.30% is a meaningful divergence that deserves attention beyond the headline. This benchmark is specifically calibrated for Asia-Pacific market participants, and its movement suggests that regional demand conditions, particularly across China, Japan, South Korea, and Southeast Asian manufacturing hubs, are currently more supportive than European or US-facing sentiment indicators would imply.
For Asian downstream buyers, this divergence introduces a nuanced procurement challenge. London-referenced spot prices offered a theoretical window of relative cheapness on August 5, however regionally settled contracts did not reflect the same softness. This gap highlights the increasingly fragmented nature of global aluminium price discovery, where regional fundamentals are asserting greater influence over settlement outcomes. In addition, China industrial demand trends continue to play a pivotal role in shaping how Asian benchmarks diverge from London-settled prices.
Cancelled Warrants: The Leading Indicator Most Traders Undervalue
How the Warrant System Mechanically Works
Understanding LME warrant mechanics is essential for interpreting aluminium inventory signals correctly. When metal is deposited into an LME-approved warehouse, it is assigned a live warrant, effectively a tradeable title document for that physical lot. When a buyer decides to withdraw that metal for physical delivery or industrial use, the live warrant is converted to a cancelled warrant, signalling imminent removal from exchange inventory.
Cancelled warrants therefore function as a leading indicator of physical demand pull. A rising cancelled warrant figure suggests buyers are actively drawing down exchange inventory to satisfy real consumption needs. Conversely, a declining figure indicates reduced urgency among physical buyers, which removes a natural upward price catalyst even when total stocks are shrinking.
The 9.23% Single-Session Decline and What It Actually Means
The 9.23% drop in cancelled warrants from 16,250 tonnes to 14,750 tonnes is the single most bearish data point from this session, arguably more significant than the cash price decline itself. It tells us that the stock drawdown occurring across LME warehouses is not being driven by active physical consumption pull from downstream buyers.
Market Mechanics Note: When both cancelled warrants and cash prices fall in the same session, the inventory decline is likely attributable to logistical activity such as warehouse transfers, location shifts between approved LME facilities, or the expiry of short-term hedging structures rather than genuine end-user demand. This is a fundamentally different signal from inventory drawdowns accompanied by rising cancelled warrants.
Live warrants held steady at 244,650 tonnes, confirming that no net new metal entered the LME system. This neutral reading from live warrants, combined with declining cancelled warrants, paints a picture of a market where physical holders are comfortable sitting on exchange inventory with no urgency to move it in either direction.
Three Structural Explanations for Simultaneous Price and Stock Declines
Hypothesis One: Geopolitical Risk Premium Deflation
Prior LME sessions had incorporated measurable risk premiums into aluminium prices, partly in response to geopolitical uncertainties including US-Iran diplomatic tensions. The previous session saw aluminium rise above USD 3,200/t partly on the easing of those concerns, according to concurrent market reporting. As diplomatic conditions stabilised further, speculative positions built on geopolitical anxiety were systematically reduced.
In this framework, the 1.30% cash price decline on August 5 is not a demand signal at all. It is the mechanical unwinding of a risk premium that had temporarily overstated fundamental value. Price declines of this nature are self-correcting once positioning normalises.
Hypothesis Two: Coordinated Long Liquidation by Managed Money
Institutional and algorithmic participants in LME base metals frequently amplify short-term price movements through simultaneous position adjustments. A 1.30% single-session move in cash aluminium is well within the range of managed money-driven liquidation events, particularly in periods of macro uncertainty or risk-off sentiment across broader financial markets.
This dynamic is a well-documented feature of modern commodity markets. The LME aluminium complex, with its deep liquidity and extensive participation from financial intermediaries, is particularly susceptible to short-term price amplification that diverges from physical market fundamentals. Traders who conflate financial flow-driven price moves with genuine demand signals frequently position incorrectly during these episodes.
Hypothesis Three: Demand-Side Re-Evaluation in Key End-Use Sectors
A third and more structurally significant interpretation holds that downstream aluminium consumers across automotive, packaging, and construction sectors are quietly revising procurement volumes downward in response to macroeconomic softening. The reduced urgency reflected in declining cancelled warrants would partially support this view.
However, the modest scale of the stock decline, just 1,750 tonnes in a single session, does not constitute a demand collapse signal by any reasonable historical benchmark. It is better characterised as a gentle deceleration rather than a contraction.
LME Stock Levels in Historical Context
Perspective is everything when interpreting inventory data. At 260,900 tonnes, LME aluminium stocks are operating in historically compressed territory that would, under normal market conditions, support meaningfully higher prices.
| LME Stock Level | Historical Context |
|---|---|
| 1,000,000 to 1,500,000+ tonnes | Peak inventory accumulation (2021-2022) |
| 400,000 to 600,000 tonnes | Mid-cycle normalisation (2023-2024) |
| 260,900 tonnes | Current level, August 5, 2026 |
| 200,000 to 250,000 tonnes | Historical acute tightness threshold |
The fact that prices are declining while stocks hover near historical lows confirms a well-established but frequently misunderstood market dynamic: price discovery in modern commodity markets is primarily driven by financial flows and macro sentiment in the short term, not by physical scarcity alone. Scarcity becomes a price catalyst only when physical buyers actively mobilise to draw down available supply, which cancelled warrant behaviour currently does not confirm.
The trajectory through July and August 2026 has been one of consistent, gradual drawdown. The pace of that drawdown has moderated in recent sessions, which may explain the reduced urgency in the physical market and the softness in cancelled warrant activity.
The next major ASX story will hit our subscribers first
Alumina Pricing: The Cost Squeeze That Could Reshape the Supply Equation
Why the Alumina-to-Aluminium Spread Deserves More Attention
LME Alumina Platts closing at USD 344.6/t on August 5, up 0.44% from the prior session, introduces a dimension of analysis that many spot market participants overlook. Alumina is the primary feedstock for primary aluminium smelting, and its cost typically accounts for 25% to 30% of total smelting expenses depending on energy costs and operational efficiency at a given facility.
When alumina prices firm while aluminium cash prices soften, the arithmetic impact on smelter economics is direct and compounding. Higher input costs meeting lower output prices compress operating margins, a dynamic that disproportionately affects higher-cost smelters operating at the upper end of the global cost curve. Consequently, shifts in aluminum and alumina markets have broader implications for smelter viability that extend well beyond a single session's price movement.
Structural Supply Implication: Sustained alumina price appreciation against softening aluminium cash prices has historically acted as a precursor to production curtailments at marginal smelters. This rationalisation dynamic typically takes three to six months to manifest in physical supply metrics, but when it does, the resulting reduction in primary aluminium output can become a meaningful price support mechanism. Market participants focused solely on near-term price action frequently miss this lagged supply-side response.
This is particularly relevant in the current context because LME stocks are already at compressed levels. Any production curtailment-driven supply reduction, even marginal in scale, would arrive into an inventory environment that has limited buffer capacity to absorb it.
A Decision Framework for Different Market Participants
Physical Buyers and Downstream Manufacturers
The cash price decline to USD 3,228.5/t theoretically presents a tactical procurement opportunity for buyers who require near-term physical delivery. However, several counterbalancing factors warrant caution:
- The December 2027 forward curve's resilience suggests the market does not expect sustained softness.
- Asian Reference Price strength limits the cost advantage for regionally settled procurement.
- Any geopolitical catalyst re-emergence could rapidly reverse the cash price decline.
- Locking in modest volumes at current spot levels while monitoring cancelled warrant recovery for demand confirmation is a prudent tactical approach.
Traders and Speculative Market Participants
- The simultaneous decline in cash prices and cancelled warrants argues against initiating new aggressive long positions in prompt contracts at this juncture.
- The Asian Reference Price divergence (+0.56% versus -1.30% for London cash) creates a potential relative value trade opportunity for participants able to access both settlement mechanisms.
- Cancelled warrant recovery is the metric to watch as a leading signal of renewed physical demand momentum and a potential trigger for front-end price recovery.
- December 2027 contract strength suggests longer-dated positions may carry better risk-adjusted reward than prompt exposure in the current environment.
Smelters and Primary Producers
- Rising alumina costs combined with softening cash prices require an active review of forward hedging strategies, particularly for facilities without long-term alumina supply contracts.
- The December 2027 contract appreciation (+0.38%) supports the economics of longer-dated forward sales programmes for producers seeking to lock in margins above current spot levels.
- Monitoring the alumina-to-aluminium spread closely over the coming weeks is particularly important for smelters operating in the upper quartile of the global cost curve.
For instance, the broader policy environment also matters here. US aluminium tariffs continue to create downstream cost pressures that influence how producers and buyers alike approach hedging decisions in the current environment.
FAQ: LME Aluminium Cash Price and Stocks Decline
Why did LME aluminium cash prices fall when stocks also declined?
Falling stocks do not automatically support prices when the drawdown is not driven by active physical consumption. The sharp decline in cancelled warrants signals that buyers were not urgently pulling metal from warehouses, removing the upward pressure that physically motivated inventory drawdown would typically generate.
What does the December 2027 contract gaining while cash prices fell actually tell us?
It signals that near-term sentiment is being driven by position unwinding or reduced risk premiums rather than a reassessment of aluminium's longer-term fundamentals. Participants with multi-year horizons remain constructive on the supply-demand outlook, particularly given structural inventory compression well below historical mid-cycle norms.
How does the Asian Reference Price differ from the LME cash settlement?
The Asian Reference Price is a regionally calibrated benchmark reflecting aluminium market conditions across Asia-Pacific. Its positive movement on a session where London cash fell sharply illustrates that regional demand dynamics, particularly in China and broader Asia, can diverge meaningfully from global financial flow-driven sentiment at the LME.
At what stock level does the LME aluminium market face acute tightness risk?
Historically, LME aluminium stocks below approximately 200,000 to 250,000 tonnes have been associated with acute tightness signals and the potential emergence of cash-to-futures backwardation. At 260,900 tonnes, the market is approaching but has not yet entered that critical zone.
What does a sharp decline in cancelled warrants signal for near-term prices?
Cancelled warrants represent metal specifically earmarked for physical withdrawal. A 9.23% single-session decline indicates reduced near-term physical demand urgency, which removes a natural price support mechanism and typically reinforces bearish near-term sentiment regardless of overall stock trajectory.
Key Takeaways for LME Aluminium Market Participants
- The LME aluminium cash price and stocks decline on August 5 is best understood as a sentiment-driven correction, not a signal of fundamental demand destruction.
- The forward curve structure, with near-term weakness and longer-dated resilience, reflects a market distinguishing between cyclical softness and structural tightness.
- Cancelled warrant behaviour remains the most operationally reliable near-term physical demand indicator available in the LME data set, and its 9.23% single-session decline carries more interpretive weight than the cash price move itself.
- Rising alumina costs introduce a lagged supply-side response mechanism that could convert current margin pressure into production rationalisation and eventual price support over a three to six month horizon.
- The divergence between LME cash prices and the Asian Reference Price underscores the growing regionalisation of global aluminium price discovery, which creates both risk and opportunity for market participants, including aluminium industry leaders, operating across multiple geographies.
Readers seeking ongoing primary aluminium market data, price tracking, and industry analysis can access reporting resources through AL Circle, which provides comprehensive coverage of global aluminium supply-demand dynamics and LME pricing developments. Furthermore, current LME aluminium price data including historical cash price tables is available directly via Westmetall for those requiring detailed benchmark tracking.
Ready to Profit From the Next Major ASX Mineral Discovery?
Discovery Alert's proprietary Discovery IQ model delivers real-time alerts the moment significant mineral discoveries hit the ASX, transforming complex commodity data into clear, actionable insights for traders and investors at every level — explore historic discovery returns on Discovery Alert's dedicated discoveries page to see what early positioning can deliver, and begin your 14-day free trial today to secure a genuine market-leading edge.