
August 6, 2026
When Headline Numbers Mislead: Decoding the Real Signal Inside US Crude Inventory Data
Petroleum markets have a well-documented tendency to overreact to weekly inventory headlines. A crude build flashes across trading terminals, prices slip, and the narrative pivots toward oversupply — even when the granular data tells a more complicated story. Understanding why US crude inventories rise as refinery runs ease and imports climb requires looking beyond the top-line figure and examining the mechanical forces operating underneath it. For broader context, the current crude market overview provides useful perspective on where prices have been heading.
The week ending July 31 delivered exactly this kind of interpretive challenge. On the surface, a larger-than-expected crude build appeared bearish. Beneath it, however, product markets were flashing signals of genuine consumption strength that the headline figure completely obscured.
When big ASX news breaks, our subscribers know first
What the EIA Report Actually Recorded
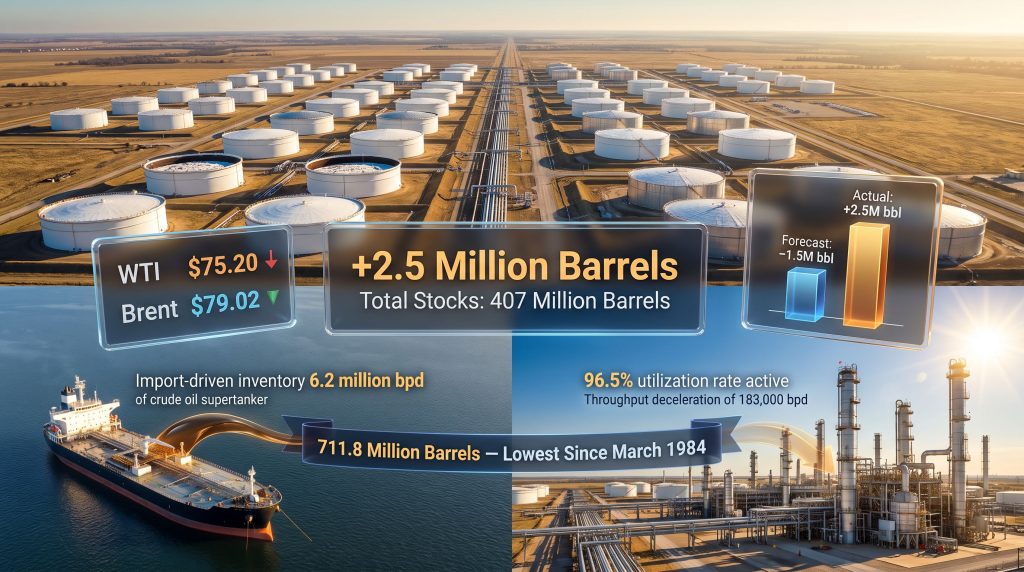
The Energy Information Administration's weekly petroleum status report showed US commercial crude inventories expanding by 2.5 million barrels, bringing total stocks to 407 million barrels. That outcome landed far outside analyst expectations, which had been centred on a 1.5 million barrel drawdown — a directional miss of four million barrels between forecast and reality.
| Metric | Reported Figure | Analyst Expectation |
|---|---|---|
| Crude Inventory Change | +2.5 million barrels | −1.5 million barrels |
| Total Commercial Crude Stocks | 407 million barrels | — |
| Cushing, OK Inventory Change | +2.4 million barrels | — |
| Cushing Total Level | 20.96 million barrels | — |
| Refinery Crude Run Change | −183,000 bpd | — |
| Refinery Utilization Rate | 96.5% (−0.7 pp) | — |
| Crude Import Volume | 6.2 million bpd | — |
| Import Change Week-on-Week | +515,000 bpd | — |
| Net Import Change | +297,000 bpd | — |
One figure in this table deserves particular attention from a long-term structural perspective. When commercial stocks are combined with barrels held inside the US government's Strategic Petroleum Reserve, total US crude holdings fell to 711.8 million barrels — the lowest aggregate level recorded since March 1984. That multi-decade low sits quietly in the background of an otherwise bearish-looking weekly report, acting as a structural counterweight to the near-term supply noise.
Three Simultaneous Forces Behind the Build
The inventory accumulation during this reporting period was not the product of a single variable behaving unexpectedly. Three distinct operational dynamics converged within the same seven-day window, each contributing to the final outcome. Furthermore, understanding these forces individually is essential before drawing any broad market conclusions.
Refinery Throughput Deceleration
Refinery crude runs declined by 183,000 barrels per day, pushing utilization down 0.7 percentage points to 96.5%. At first glance, this sounds dramatic. In context, however, 96.5% utilization remains historically elevated — the US refining complex was still operating near maximum capacity. The decline reflects the sensitivity of crude consumption to even marginal throughput adjustments at large-scale processing facilities.
A useful way to conceptualise this: US refining capacity currently sits at approximately 17.8 million barrels per day according to EIA infrastructure data. A 0.7 percentage point utilization decline applied across that base translates into roughly 125,000 barrels per day of crude that moved into storage rather than into processing units. Multiplied across seven days, that arithmetic alone accounts for nearly one million barrels of the weekly build.
Seasonal maintenance scheduling, turnaround planning, and margin optimisation all influence weekly run rates. The industry distinction between unplanned run rate reductions (equipment failures, operational disruptions) and planned reductions (scheduled maintenance) matters considerably for how market participants should interpret throughput data. A planned reduction carries no negative demand signal; it is a calendar event with a defined end date.
Import Acceleration
Crude imports climbed by approximately 515,000 barrels per day to reach 6.2 million bpd, while net imports rose by 297,000 barrels per day. The gap between those two figures reflects the simultaneous movement of exports — outbound crude flows softened during the same period, amplifying the net inflow effect. According to EIA weekly petroleum data, these import swings are not uncommon during periods of scheduled refinery maintenance.
The mechanics here are straightforward: when import pipelines remain open at elevated volumes while refinery intake simultaneously contracts, crude has nowhere to go except storage. The inventory build becomes an arithmetic outcome rather than a demand signal.
What is less commonly appreciated is the routing complexity behind US import figures. Crude arriving at Gulf Coast terminals from multiple international origins is not uniformly fungible — different grades carry different API gravity and sulphur content profiles that determine which specific refinery configurations can process them efficiently. An import surge in heavy sour crude, for instance, does not automatically translate into processing throughput increases at refineries configured primarily for light sweet grades.
Export Flow Softness
The net import figure of +297,000 bpd incorporates both sides of the trade equation. A slowdown in outbound crude shipments — influenced by freight economics, buyer scheduling, and competitive pricing from alternative suppliers — reduced the offset that exports normally provide against rising import volumes. Consequently, the combined effect of elevated imports and softer exports amplified the weekly build considerably.
The Cushing Hub: Understanding the Operational Threshold
Cushing, Oklahoma is the designated physical delivery point for West Texas Intermediate futures contracts traded on the CME Group's NYMEX exchange. Its inventory levels function as a real-time barometer for near-term WTI pricing dynamics, and the market watches Cushing stocks with particular intensity.
Cushing inventories rose by 2.4 million barrels during the reporting week, reaching 20.96 million barrels — a recovery above the critically watched minimum operational threshold of approximately 20 million barrels. The significance of that threshold is often underappreciated by investors outside the physical crude market.
When Cushing stocks fall below roughly 20 million barrels, the physical pipeline and storage infrastructure at the hub begins to encounter operational constraints. Tank bottoms — the minimum heel of crude required to keep storage and pipeline systems functional — cannot be drawn down without disrupting the mechanical operation of the delivery system. Futures traders aware of these physical constraints recognise that sub-threshold Cushing levels can introduce artificial price distortions into the WTI forward curve, independent of broader supply and demand fundamentals.
The rebound from what had been a 12-year low back above this operational floor removes an immediate technical stress point from the market. However, the speed of the recovery — driven primarily by the same import surge that inflated commercial stocks — illustrates how quickly midcontinent crude balances can shift when routing decisions change at origin.
Product Inventories: Where the Bullish Signal Resided
While crude headlines generated bearish momentum, the refined product data presented an entirely different picture — one that analysts focused on end-user demand had reason to view constructively. In addition, these product-level signals carry implications that frequently get overlooked in the rush to interpret headline crude figures.
Gasoline: Demand Holding Above the Psychological Threshold
| Metric | Reported Figure | Analyst Expectation |
|---|---|---|
| Gasoline Inventory Change | −1.6 million barrels | −1.3 million barrels |
| Total Gasoline Stocks | 209.7 million barrels | — |
| Gasoline Product Supplied | Over 9 million bpd | — |
| Week-on-Week Demand Change | −10,000 bpd | — |
Gasoline product supplied — the EIA's primary proxy for consumption, measuring volumes delivered into the domestic distribution system — held above 9 million barrels per day. This threshold carries genuine analytical weight. Energy market practitioners broadly treat 9 million bpd as the lower boundary of robust summer demand, reflecting the seasonal peak of the US driving season. The marginal 10,000 bpd week-on-week decline did nothing to erode that underlying strength.
The gasoline drawdown of 1.6 million barrels also exceeded analyst expectations of a 1.3 million barrel decline, providing further confirmation that consumption was absorbing product supply at a healthy rate.
Distillates: The Week's Most Significant Data Point
| Metric | Reported Figure | Analyst Expectation |
|---|---|---|
| Distillate Inventory Change | −3.5 million barrels | +206,000 barrels |
| Total Distillate Stocks | 107.2 million barrels | — |
| Distillate Demand Change | +417,000 bpd | — |
| Total Distillate Demand | 3.9 million bpd | — |
Distillate stockpiles — covering diesel fuel, heating oil, and related middle-distillate products — recorded the single largest surprise in the entire report. Analysts had anticipated a modest 206,000 barrel build. Instead, inventories fell by 3.5 million barrels, a miss of approximately 3.7 million barrels against consensus.
The mechanism behind this was a 417,000 barrel per day surge in implied distillate demand, lifting total consumption to 3.9 million bpd. Distillate demand is closely correlated with industrial activity, freight transportation volumes, and agricultural operations — it functions as a real-economy consumption indicator in ways that gasoline demand does not. A near-half-million barrel per day single-week demand acceleration in distillates warrants close attention as a potential leading signal of broader economic activity.
When distillate demand rises sharply while refinery output is simultaneously reduced, the product supply gap that emerges can deplete inventory cushions rapidly. The 3.5 million barrel drawdown reflects exactly this dynamic playing out within a single reporting week.
How Oil Prices Responded
| Benchmark | Price | Change |
|---|---|---|
| West Texas Intermediate (WTI) | $75.20/barrel | −0.7% (−$0.56) |
| Brent Crude | $79.02/barrel | −0.4% (−$0.32) |
Both WTI and Brent extended pre-existing losses following the EIA report's release. The crude build dominated the immediate algorithmic and sentiment-driven trading response, while the bullish product data received less immediate weight in price discovery. This asymmetry reflects a well-documented feature of commodity market psychology — bearish headline numbers tend to generate faster price reactions than constructive sub-components that require more analytical interpretation to appreciate.
The WTI-Brent spread narrowed marginally during the session, consistent with US-specific supply pressures applying relatively greater downward force to the domestic benchmark. For a broader view of where these movements fit into longer-term patterns, the oil price volatility guide offers valuable context on how such swings have played out historically.
The next major ASX story will hit our subscribers first
Reading the Competing Signals: A Scenario Framework
The data from this reporting week creates a genuinely split picture. Traders and analysts must weigh bearish crude supply conditions against constructive product demand signals simultaneously. Furthermore, geopolitical developments — including the trade war impact on oil supply chains — add another layer of complexity to an already nuanced picture.
Bearish crude indicators:
- Commercial stocks rose by more than four times the expected drawdown
- Import volumes remain elevated at 6.2 million bpd
- Net imports added 297,000 bpd to domestic supply
- Refinery utilization, while high, is trending slightly lower
Bullish product demand indicators:
- Gasoline demand holding above 9 million bpd through peak driving season
- Distillate demand surged 417,000 bpd in a single week
- Both product categories drew down inventories beyond analyst expectations
- The distillate demand signal carries industrial activity implications
| Scenario | Trigger Conditions | Likely Price Impact |
|---|---|---|
| Bullish Reversal | Refinery runs recover, imports moderate, product demand holds | WTI recovers toward $77–$78 range |
| Range-Bound Consolidation | Imports stabilise, refinery activity flat, demand steady | WTI trades sideways in $74–$76 band |
| Extended Bearish Pressure | Imports remain elevated, refinery runs stay subdued, demand softens | WTI tests support below $74 |
The Strategic Petroleum Reserve: A Structural Context Often Overlooked
The combined SPR and commercial stock total of 711.8 million barrels reaching its lowest point since March 1984 provides critical long-term context that weekly builds tend to obscure. In addition, OPEC market influence continues to shape the broader supply picture within which these domestic inventory movements occur.
The SPR was established following the 1973–74 oil embargo specifically to provide a buffer against supply disruptions. Its current depleted state relative to four-decade lows limits the government's capacity to intervene in physical markets during any future supply shock. From an investment perspective, this structural depletion creates a potential future source of crude demand — any SPR replenishment programme, whether motivated by national security policy or opportunistic price-level purchasing, would add meaningful incremental demand to the crude market.
This dynamic is rarely incorporated into near-term price models but represents a legitimate medium-term demand catalyst that operates independently of the weekly inventory cycle.
Key Takeaways for Market Participants
The week ending July 31 demonstrated why single-metric inventory analysis consistently leads market participants toward incomplete conclusions. Several layers of the data deserve equal weight, and consequently, a more holistic reading is essential for sound decision-making. For instance, tracking crude oil price trends alongside inventory data can help traders build a more complete picture of where markets are heading.
US crude inventories rise as refinery runs ease and imports climb in a pattern that has been seen before, and the downstream signals often tell the more important story. Several points merit particular emphasis:
- The 2.5 million barrel crude build was mechanically driven by reduced refinery throughput and elevated import volumes — it reflected a supply-side logistics outcome, not weakening end consumption
- Product demand remained robust, with both gasoline and distillate drawdowns exceeding analyst forecasts by meaningful margins
- Cushing's recovery above 20 million barrels removes an operational stress point but does not alter the broader structural picture of the tightest combined US crude holdings since the Reagan administration
- The distillate demand surge of 417,000 bpd is the report's most underappreciated data point, carrying potential implications for industrial and freight sector activity
- WTI at $75.20 and Brent at $79.02 reflected a market that processed the bearish headline faster than the constructive underlying product signals
According to Reuters energy market analysis, these divergent signals between crude builds and product drawdowns have increasingly characterised weekly EIA reports, making nuanced interpretation all the more important for market participants.
Disclaimer: This article is intended for informational and educational purposes only. It does not constitute financial advice or a recommendation to buy or sell any commodity, security, or financial instrument. Oil price forecasts and scenario projections involve inherent uncertainty and should not be relied upon as predictive statements. Readers should conduct independent research and consult qualified financial advisers before making investment decisions.
For comprehensive historical inventory data and full methodology documentation covering all petroleum categories referenced in this analysis, the US Energy Information Administration publishes weekly petroleum status reports at eia.gov.
Want to Stay Ahead of the Next Major Resource Discovery?
While crude inventory data rewards those who look beyond the headline numbers, the same principle applies to mineral exploration — the most significant opportunities often lie beneath the surface. Discovery Alert's proprietary Discovery IQ model instantly translates complex ASX mineral announcements into actionable insights, delivering real-time alerts on significant discoveries the moment they hit the exchange; explore historic discoveries that have generated extraordinary returns and begin your 14-day free trial at Discovery Alert to position yourself ahead of the broader market.