August 6, 2026
The Architecture of a Global Gas Crisis: Why One Waterway Holds the World's Energy System Hostage
The global energy system was built on a foundational assumption that rarely gets examined until it fails: that maritime chokepoints would remain open. For decades, the concentration of liquefied natural gas export infrastructure in the Persian Gulf was treated as a commercial convenience rather than a systemic vulnerability. The Middle East war and LNG supply crisis now unfolding in 2026 has exposed just how dangerously that assumption was embedded into global energy planning.
Understanding what has gone wrong requires stepping back from the immediate headlines and examining the structural architecture that made this crisis not just possible, but arguably inevitable.
When big ASX news breaks, our subscribers know first
The Strait of Hormuz: One Channel, One-Fifth of the World's LNG
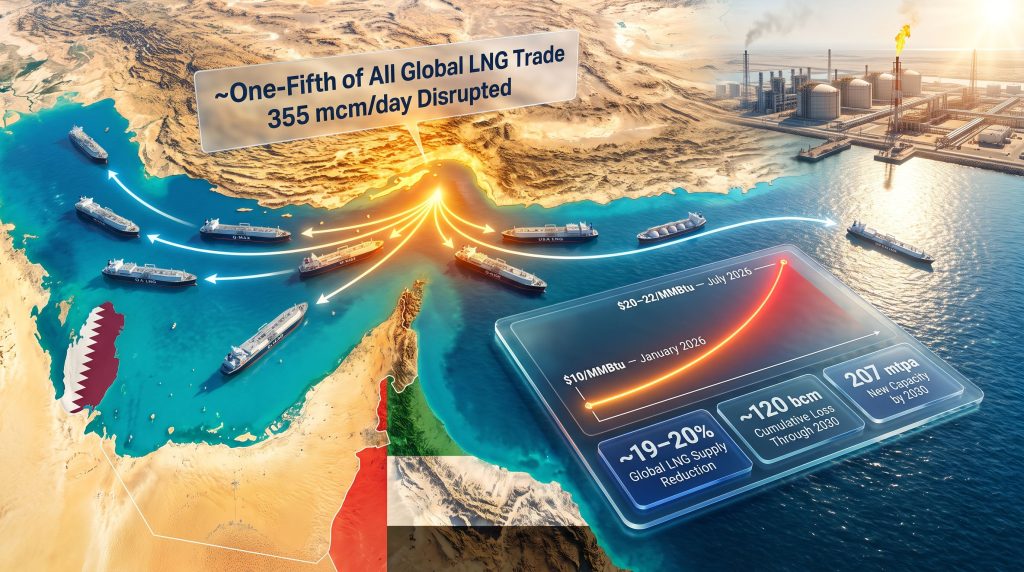
The Strait of Hormuz is, at its narrowest point, only about 33 kilometres wide. Yet this sliver of water between Iran and Oman serves as the exit valve for a disproportionate share of the world's energy supply. Approximately one-fifth of all globally traded LNG moves through this single corridor, along with roughly 20% of global crude oil trade.
What makes Hormuz uniquely dangerous as a chokepoint is not merely its narrowness, but the near-total absence of viable alternatives for the infrastructure concentrated behind it. Qatar's North Field, the world's largest single natural gas reservoir, sits directly in the Persian Gulf. The UAE's LNG operations are similarly positioned.
Unlike crude oil, which can in some cases be rerouted through pipeline networks or alternative terminals, LNG requires purpose-built liquefaction plants, specialised tankers, and regasification terminals at the destination. There is no quick workaround, and the LNG supply outlook for the coming years reflects how deeply this structural weakness has been underestimated.
A comparison of the world's major energy chokepoints illustrates just how exposed the LNG trade is:
| Chokepoint | Daily Volume (Oil Equivalent) | LNG Exposure | Alternative Routes Available |
|---|---|---|---|
| Strait of Hormuz | ~20 million bpd equivalent | ~20% of global LNG trade | Very limited |
| Suez Canal | ~10 million bpd equivalent | Moderate | Longer Cape of Good Hope route |
| Bab el-Mandeb | ~6–7 million bpd equivalent | Low-moderate | Suez bypass or Cape route |
| Strait of Malacca | ~16 million bpd equivalent | Transit only | Lombok/Sunda Strait alternatives |
The key insight from this comparison is that Hormuz has the lowest bypass optionality relative to its throughput significance. When Houthi activity disrupted the Bab el-Mandeb, tankers could reroute around the Cape of Good Hope at additional cost. When Hormuz is disrupted, there is functionally no equivalent detour for Persian Gulf LNG exporters.
The Scale of the Disruption: Numbers That Reframe the Crisis
The combined output disruption from Qatar and the UAE resulting from conflict-related infrastructure damage and transit constraints is estimated at up to 355 million cubic metres per day. This figure alone would represent a significant supply event in any normal year. In the context of already-tight global LNG balances, it has triggered a near-term supply contraction of approximately 19 to 20%.
QatarEnergy's Ras Laffan complex, the single largest LNG export hub in the world, declared force majeure as conflict-related disruptions constrained operations. Export capacity reductions at the facility are estimated at approximately 17%. If the disruption persists through the end of this decade, cumulative supply losses could reach roughly 120 billion cubic metres by 2030.
Key Data Snapshot: The Scale of the Middle East War and LNG Supply Crisis
Metric Estimated Impact Global LNG supply reduction (near-term) ~19–20% Qatar/UAE combined output disruption Up to 355 mcm/day Ras Laffan export capacity reduction ~17% Cumulative supply loss through 2030 ~120 bcm LNG price increase since January 2026 ~100% (from ~$10 to $20–22/MMBtu)
What makes these numbers particularly significant is their compounding nature. The supply loss is not absorbed by a market with surplus capacity. It collides with seasonal demand peaks, elevated freight costs from rerouted vessels, and financing constraints among price-sensitive importers.
How LNG Prices Doubled in Seven Months
To understand the repricing that has occurred, it helps to understand how LNG spot markets function. Unlike oil, which trades on deep, liquid exchanges with tight bid-ask spreads, LNG spot pricing is more opaque, influenced heavily by cargo-by-cargo negotiations, destination clauses in long-term contracts, and shipping availability. This structural illiquidity means that when supply tightens sharply, price discovery can overshoot.
Between January and July 2026, LNG spot prices approximately doubled. Buyers who had secured cargoes at around $10 per MMBtu at the start of the year faced spot costs of $20 to $22 per MMBtu for much of July, according to reporting by The National citing Gas Strategies. This price trajectory reflects more than simple scarcity. It incorporates a war risk premium, vessel diversion costs, and the option value of securing supply at all during periods of intense competition.
Furthermore, the critical distinction for market observers is whether this represents a temporary spike or a structural repricing. Several factors suggest it is closer to the latter, at least through 2027:
- Hormuz transit disruptions show no signs of near-term resolution
- Seasonal northern hemisphere demand peaks are compounding the supply shortfall
- The war risk premium is likely to persist regardless of spot supply improvements
- European buyers are competing more aggressively for Atlantic Basin cargoes, reducing the volumes available to Asian importers
Gas Strategies, as reported by The National, has projected that global LNG demand could contract by as much as 8% in 2026 relative to 2025 levels if Persian Gulf flows remain suppressed for the full year. This projection reflects a market already experiencing measurable demand destruction. In addition, trade-driven oil volatility has compounded the broader energy price environment, adding further uncertainty for import-dependent economies.
Regional Exposure: Who Bears the Greatest Risk
Asia-Pacific: Structural Dependency Without Adequate Alternatives
The Asia-Pacific region absorbs the largest share of globally traded LNG and has the least access to pipeline gas alternatives. Japan, the world's second-largest LNG importer, has responded to the price environment by reactivating coal-fired generation capacity that had been placed in reserve. This is not a theoretical outcome. It is an observable, operational response to economics.
Pakistan's situation illustrates a different dimension of the same problem. Financially constrained and without the sovereign balance sheet depth of wealthier importers, Pakistan nonetheless continued paying elevated spot premiums during peak demand season. The alternative, rolling blackouts during summer heat peaks, carries its own economic and political cost.
China's experience has been notably different. After reducing LNG purchases sharply in the second quarter of 2026, Chinese imports began rebounding in the third quarter as power demand surged alongside record temperatures and domestic gas output softened. What insulates China from the worst of the supply shock is its dual-architecture import system: it combines LNG imports with Russian pipeline gas deliveries via the Power of Siberia system, giving it a supply diversification buffer that Japan, South Korea, and Pakistan simply do not have.
Europe: The Russian Gas Paradox and the 2027 Storage Cliff
Europe's situation contains a striking irony. At the very moment that LNG spot prices are suppressing European storage refill rates, the continent is importing Russian LNG at record volumes. This arrangement is set to end at the start of 2027, when the EU's ban on Russian gas imports takes effect.
The timing creates a compounding risk scenario. European storage programmes are already running behind seasonal targets. When Russian LNG access is removed, the Atlantic Basin cargoes that might offset this loss are increasingly being diverted toward Asia, where buyers are willing to pay premium prices. The winter 2026 to 2027 supply balance for Europe carries material downside risk under a scenario where Hormuz transit disruptions persist.
The United States: Exporter Advantage, Limited Relief
The United States is currently the world's largest LNG exporter and is actively expanding its liquefaction capacity. Facilities under construction across the Gulf Coast represent a meaningful increment to global supply. However, additional U.S. volumes cannot neutralise the war premium while Hormuz transit risk remains elevated.
The war premium is not simply a supply shortfall that can be filled with alternative molecules. It is a risk-adjusted pricing adjustment that reflects uncertainty about the durability of any supply improvement. According to the IEA's analysis of Middle East energy markets, geopolitical disruption in this region carries consequences that reverberate across every major import market.
This dynamic has a geopolitical dimension worth noting. U.S. LNG has increasingly been positioned as a strategic tool in allied energy security frameworks, particularly for European NATO members seeking to reduce dependency on Russian gas. The Hormuz crisis, paradoxically, may accelerate the long-term structural shift toward U.S. and Australian energy exports for both European and Asian buyers.
Coal's Unwanted Return and the Infrastructure Workaround Problem
Fuel Substitution: The Economics of Switching
The mechanism driving coal's re-entry into power generation mixes is straightforward. When LNG prices exceed the cost of coal-based generation by a sufficient margin, utilities with dual-fuel capacity will switch. At $20 to $22 per MMBtu for LNG, the economics favour coal in most markets without stringent carbon pricing.
Japan and Pakistan represent the two most documented cases of this substitution in 2026. The environmental implications are significant. Coal emits approximately twice the carbon dioxide per unit of electricity generated compared to natural gas. A sustained period of LNG demand destruction through coal substitution would measurably set back decarbonisation trajectories in both countries.
Alternative Routes: The Long Road Around
Several infrastructure bypass options have attracted renewed attention since the Hormuz disruptions intensified:
- The Iraq-Syria pipeline corridor has been discussed as a potential Hormuz-alternative route for gas transit to Mediterranean markets. Feasibility assessments suggest a development horizon of approximately three years under optimistic conditions.
- Rerouted LNG cargoes face longer voyage distances, higher freight costs, and vessel scheduling constraints. The global LNG tanker fleet is not infinitely elastic in its ability to absorb longer voyages without creating availability bottlenecks.
- Indian refiner diversification toward West African crude grades, as seen with HPCL securing Nigerian crude to avoid Hormuz exposure, reflects a broader pattern of hydrocarbon supply diversification that extends beyond LNG.
- Australian LNG export capacity represents the most viable Pacific Basin alternative to Middle Eastern supply for many Asian buyers, though Australian volumes are not sufficient to fully offset Qatari losses.
The next major ASX story will hit our subscribers first
The 2030 Supply Wave and the Long-Term Demand Question
Shell's 700 mtpa Forecast: Still Standing?
Shell's June 2026 long-term LNG outlook projected global demand approaching 700 million tonnes per annum by 2050, representing a 65% increase from 2025 consumption levels. The forecast rests on assumptions about energy security prioritisation, industrial decarbonisation pathways, and the continued build-out of flexible LNG trade infrastructure.
Shell described this trajectory as driven by countries prioritising the flexible and reliable energy security that gas and LNG provide.
The Middle East war and LNG supply crisis does not obviously invalidate these assumptions over a 25-year horizon. However, it does introduce significant near-term uncertainty around the 2026 to 2027 demand trajectory, and it raises a structural question about whether the geographic concentration of LNG supply infrastructure is compatible with the energy security expectations that underpin the long-term demand case. Consequently, the impact on global steel demand and other energy-intensive industries adds a further layer of economic complexity.
The 207 mtpa Capacity Build-Out: Will Demand Be There?
Approximately 207 million tonnes per annum of new LNG liquefaction capacity is projected to enter operation globally by 2030, with the United States and Australia accounting for a substantial share of that increment. The question now being asked across the industry is whether demand will recover sufficiently to absorb this volume, or whether war-induced fuel switching will leave structural gaps in buyer appetite.
Historical commodity cycle behaviour offers a clear precedent. Demand elasticity has characterised every previous LNG price shock, including the post-2022 European energy crisis. When prices moderated after that period, LNG demand recovered across Asia and Europe. The same dynamic is widely expected to reassert itself once Hormuz transit conditions normalise.
Gas maintains a structural advantage over wind and solar that supports the long-run demand case: it generates dispatchable electricity on demand and can be stored for extended periods. This characteristic is irreplaceable in power systems that cannot yet rely on battery storage at grid scale.
Scenario Modelling: Three Pathways for the LNG Market
Scenario Comparison: Middle East War and LNG Supply Crisis Trajectories
Scenario Hormuz Status LNG Price Trajectory Demand Impact Early Resolution (H2 2026) Reopened Gradual decline toward $12–14/MMBtu Partial demand recovery Prolonged Stalemate (through 2027) Partially restricted Sustained $18–22/MMBtu range Structural fuel-switching accelerates Escalation Further disrupted Potential spike beyond $25/MMBtu Severe demand destruction; recession risk in import-dependent economies
The IEA has assessed that market tightness could persist through 2026 and 2027 even under a conflict de-escalation scenario, reflecting the time required for supply chains, vessel scheduling, and storage levels to normalise. Furthermore, as Norton Rose Fulbright's analysis of Asia-Pacific power markets highlights, geopolitical transit risk has now permanently entered the LNG risk premium framework.
An oil price rally driven by concurrent geopolitical pressures has added further weight to the overall energy cost burden for importing nations, with long-lasting implications for contract structures, infrastructure investment decisions, and buyer diversification strategies.
Frequently Asked Questions: Middle East War and the LNG Supply Crisis
How much of global LNG trade passes through the Strait of Hormuz?
Approximately one-fifth of all globally traded LNG moves through the Strait of Hormuz, making it the single most consequential maritime chokepoint for liquefied natural gas flows.
Why have LNG prices doubled since January 2026?
The combination of physical supply disruption from damaged Persian Gulf export infrastructure, force majeure declarations at Qatar's Ras Laffan complex, and sustained conflict-related transit risk has compressed available supply while seasonal demand remained elevated, driving spot prices from approximately $10/MMBtu to $20 to $22/MMBtu.
Which countries are most affected by the LNG supply crisis?
Japan, South Korea, Pakistan, and European Union member states face the greatest exposure. Japan and Pakistan have responded by increasing coal-fired generation, while European storage programmes have fallen behind seasonal targets. China is comparatively insulated due to its access to Russian pipeline gas.
Could the crisis permanently alter LNG's long-term demand outlook?
Most energy analysts maintain that demand elasticity will restore consumption once prices moderate. Shell's 2026 long-term forecast of approximately 700 mtpa by 2050 remains the industry reference point, though the war has introduced material uncertainty around the 2026 to 2027 demand trajectory.
What new LNG supply is coming to market by 2030?
Approximately 207 million tonnes per annum of new liquefaction capacity is expected to become operational globally by 2030, with the United States and Australia accounting for a significant share of incremental volumes.
Key Structural Lessons From the Crisis
- The geographic concentration of LNG export infrastructure in the Persian Gulf represents a systemic vulnerability that global energy markets have chronically underpriced
- Price-induced demand destruction is already measurable, with an 8% contraction in global LNG demand plausible for 2026 if Hormuz flows remain suppressed
- Coal re-entry as a fuel substitute is an observable, operational outcome of the current price environment, not a theoretical risk
- The long-term LNG growth thesis retains its structural foundations but faces a critical near-term stress test through 2027
- Geopolitical transit risk has permanently entered the LNG risk premium framework, reshaping how buyers, sellers, and infrastructure investors will approach long-term planning
This article is intended for informational purposes only and does not constitute financial or investment advice. Forward-looking projections, demand forecasts, and price scenarios involve inherent uncertainty and should not be relied upon as predictions of future outcomes. Readers are encouraged to consult independent sources and professional advisors before making any investment decisions.
Want to Track the ASX Opportunities Emerging From the Global Energy Crisis?
As geopolitical disruption reshapes LNG supply chains and accelerates interest in Australian energy exports, Discovery Alert's proprietary Discovery IQ model delivers real-time alerts on significant ASX mineral and energy discoveries — transforming complex market data into actionable insights for investors at every level. Explore historic discoveries and their returns or start your 14-day free trial today to position yourself ahead of the market.