
August 5, 2026
The Storage Complex That Markets Keep Misreading
Every week, energy traders, portfolio managers, and commodity analysts fix their attention on a single government data release that arrives each Wednesday morning. The US Energy Information Administration's Weekly Petroleum Status Report carries more market-moving weight than almost any other economic data point in the short-term energy trading calendar. Yet the nuances buried within that report, particularly the divergence between crude oil and refined product inventory movements, are routinely misinterpreted by those who scan only the headline crude figure.
Understanding why US oil product inventories continue to fall even as crude stocks occasionally build requires a structural framework that goes well beyond the surface-level numbers. The relationship between upstream crude storage, refinery throughput, and downstream product demand creates a layered picture that, when decoded properly, reveals the true health of American energy consumption. For broader context on crude oil price trends, the weekly EIA report remains one of the most important inputs analysts track.
When big ASX news breaks, our subscribers know first
Crude Builds and Product Draws Are Not Contradictions
At first glance, a week in which crude oil inventories rise while gasoline and distillate stocks decline can seem paradoxical. In reality, it reflects a completely normal feature of how the petroleum supply chain operates.
When refineries run at elevated utilisation rates, they draw crude feedstock into processing at speed. The finished products they generate, primarily gasoline, diesel, heating oil, and jet fuel, flow into downstream storage. If consumer and industrial demand is pulling those finished products out of storage faster than refineries can replenish them, product inventories fall even while crude is accumulating at the wellhead or pipeline terminal level.
A crude inventory build does not automatically signal weak demand. When refineries are running at high utilisation rates, crude stocks can rise while finished product stocks fall, reflecting strong downstream consumption pulling product out of storage faster than it can be replenished.
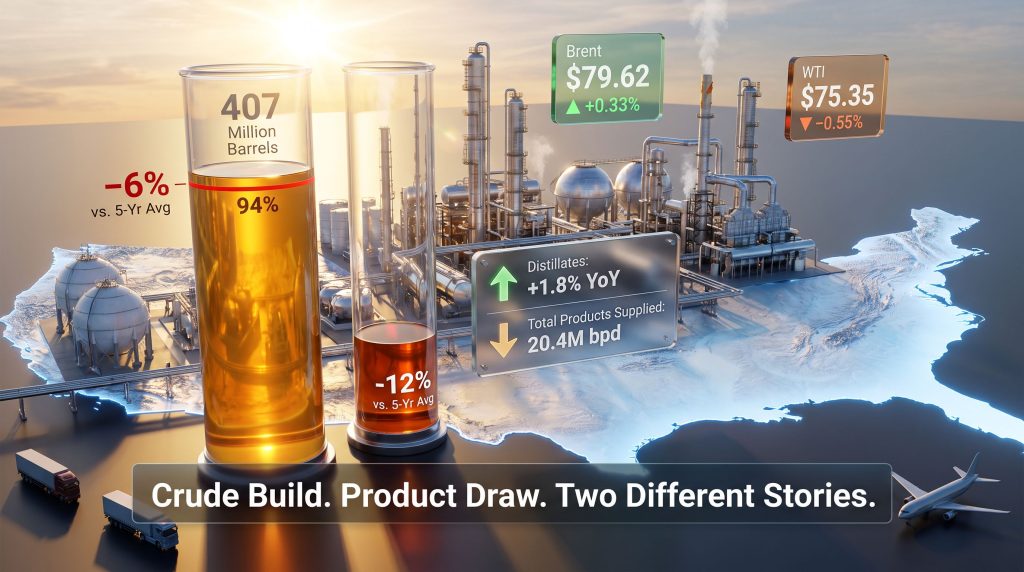
This dynamic is precisely what the most recent EIA data illustrates. Commercial crude stockpiles rose by 2.5 million barrels in the week ending July 31, bringing the total to 407 million barrels. That figure sits approximately 6% below the five-year seasonal average, signalling that even with the weekly build, the broader crude market remains in a state of moderate tightness relative to historical norms.
Decoding the Week Ending July 31: Key Inventory Movements at a Glance
| Product Category | Weekly Change | Current Stock Level | vs. 5-Year Average |
|---|---|---|---|
| Crude Oil (Commercial) | +2.5 million barrels | 407 million barrels | −6% |
| Total Motor Gasoline | −1.6 million barrels | — | — |
| Middle Distillates | −3.5 million barrels | — | −12% |
| Total Products Supplied (4-wk avg) | — | 20.4 million bpd | −0.9% YoY |
The distillate figure is the most significant data point in the entire release. Middle distillate inventories dropped 3.5 million barrels in a single week and now sit 12% below the five-year seasonal average, representing a deficit that is double the relative shortfall seen in crude oil alone. Furthermore, according to the EIA, inventories are on a trajectory toward multi-decade lows, adding urgency to what the weekly numbers already suggest.
API vs. EIA: Why Two Weekly Reports Exist
A detail that many casual market observers overlook is that two separate inventory reports circulate in the market each week, and they do not always agree.
The American Petroleum Institute, a private industry body, releases its own survey-based inventory estimates on Tuesday evenings. For the same reporting period, the API indicated a crude oil build of approximately 2.69 million barrels, compared to the EIA's official figure of 2.5 million barrels. The gap between these two figures, while relatively modest in this instance, can be considerably wider during periods of greater data uncertainty.
The methodological distinction matters for traders. The API draws on voluntary industry submissions, making its data faster but less comprehensive. The EIA, by contrast, operates under a government mandate and collects verified data from a broader set of mandatory reporters, giving it greater statistical reliability. As a result:
- API data released Tuesday functions as a directional signal for futures positioning overnight
- EIA data released Wednesday is the definitive benchmark for institutional market analysis
- Discrepancies between the two reports can generate intraday volatility in WTI and Brent futures as the market reconciles expectations against confirmed figures
Are US Gasoline and Distillate Inventories in a Structural Deficit?
The Gasoline Inventory Picture: Demand Signals Beneath the Surface
Gasoline inventories declined 1.6 million barrels during the most recent reporting week, reversing a modest build that had briefly interrupted a broader drawdown trend. Average daily gasoline production fell to 9.6 million barrels per day, while the four-week average gasoline demand held at 9.0 million barrels per day.
Gasoline demand averaging 9.0 million barrels per day over the trailing four weeks represents a meaningful consumption signal, but remains slightly softer than peak-season historical benchmarks, suggesting demand is present but not accelerating.
The summer driving season, which typically runs from late May through August, is the primary structural catalyst for gasoline drawdowns. Elevated road travel, recreational vehicle use, and domestic air conditioning power demands indirectly affect refinery production decisions during this period. The modest pace of gasoline demand growth suggests consumer fuel consumption is holding firm without displaying the acceleration that would ordinarily characterise a strong mid-summer demand surge.
Distillate Inventories: The More Acute Deficit in the Storage Complex
While gasoline draws attract media attention due to their direct connection to consumer fuel costs, the distillate picture carries considerably more macroeconomic weight. Middle distillate stocks, encompassing diesel, heating oil, and jet fuel, fell 3.5 million barrels for the week ending July 31. Production declined to an average of 5.2 million barrels per day, and the resulting inventory shortfall now stands at 12% below the five-year seasonal average.
The distillate deficit carries more economic weight than gasoline draws. Diesel and heating oil shortfalls feed directly into freight costs, agricultural supply chains, and industrial operating margins, making distillate inventory levels a leading macro indicator well beyond the energy sector itself.
Distillates are often described informally as the fuel of the industrial economy. Nearly every sector that moves physical goods depends on diesel: road freight and long-haul trucking, agricultural machinery, construction equipment, and commercial aviation (via jet fuel). When distillate inventories are significantly below seasonal norms, the knock-on effects move rapidly through supply chains, compressing margins for logistics operators and adding inflationary pressure to transported goods.
Four-week average distillate demand came in at 3.6 million barrels per day, representing 1.8% growth year-over-year. This is a crucial divergence from the broader demand picture and deserves investor attention. The broader oil volatility guide provides useful context for understanding how these inventory deficits feed into price swings.
What Total Products Supplied Reveals About US Oil Demand
The Most Reliable Demand Proxy in US Energy Data
Total products supplied is the EIA's preferred metric for estimating actual US oil consumption. Rather than measuring purchases at retail level, it calculates the volume of petroleum products withdrawn from primary supply systems, making it a more reliable real-time demand gauge.
For the four-week period ending July 31, total products supplied averaged 20.4 million barrels per day, which is 0.9% lower than the equivalent period in the prior year. The breakdown reveals important divergences:
| Demand Category | 4-Week Average | YoY Change |
|---|---|---|
| Total Products Supplied | 20.4 million bpd | −0.9% |
| Gasoline | 9.0 million bpd | — |
| Distillates | 3.6 million bpd | +1.8% |
What a 0.9% Year-Over-Year Demand Decline Actually Signals
The slight decline in aggregate demand must be interpreted carefully. The divergence between softening gasoline consumption and rising distillate demand tells two different economic stories operating simultaneously.
Falling gasoline demand year-over-year can reflect a combination of factors:
- Gradual efficiency gains from improved vehicle fuel economy standards
- A modest shift toward hybrid and electric vehicles at the consumer margin
- Price sensitivity at the pump suppressing discretionary driving
- Remote work patterns reducing commuter miles in some metropolitan regions
Rising distillate demand, by contrast, reflects the underlying resilience of industrial and logistics activity. Freight volumes, construction activity, and agricultural operations all drive diesel consumption independent of consumer behaviour patterns. The fact that distillate demand is growing 1.8% year-over-year while gasoline demand softens suggests that the productive economy remains in motion even as retail fuel consumption moderates.
How Mixed Inventory Signals Create Futures Market Volatility
Brent and WTI Price Reactions to the Latest EIA Release
In the session following the EIA data release, crude futures reflected the competing forces at play. Brent crude was trading at approximately $79.62 per barrel, up $0.26 (+0.33%) on the day, while WTI sat at approximately $75.35 per barrel, down $0.42 (-0.55%). Both benchmarks had shed roughly $9 to $10 per barrel compared to the same period the prior week, reflecting the weight of macro-level sentiment overriding the otherwise supportive product inventory signals.
The muted price response to a distillate deficit running at 12% below seasonal norms illustrates a pattern that sophisticated energy market participants understand well: geopolitical narratives can temporarily dominate fundamental inventory signals. However, the underlying tightness in US oil product inventories continues to fall back into focus once short-term sentiment normalises.
The Iran Peace Deal Variable: When Expectations Override Data
A significant crude oil selloff was triggered in the session preceding the EIA release by renewed diplomatic signals around a potential US-Iran agreement. Markets moved rapidly to price in the possibility of higher Iranian export volumes before any formal deal had materialised. This behaviour highlights a recurring feature of energy market psychology: traders price geopolitical scenarios ahead of confirmed facts, creating short-term price dislocations relative to what supply-demand fundamentals alone would justify.
The analytical risk here is real. If a formalised Iran nuclear agreement were reached and oil sanctions lifted, Iranian crude export capacity could theoretically add 1 to 1.5 million barrels per day to global supply over a 12 to 18 month adjustment horizon. That volume would be sufficient to structurally alter the current inventory deficit trajectory, particularly at the crude level. However, no such agreement had been formalised at the time of the EIA data release, meaning the price reaction was driven entirely by expectation rather than supply reality. For deeper analysis of these dynamics, the oil geopolitics analysis provides a comprehensive breakdown of how diplomatic developments shape market outcomes.
This distinction between sentiment-driven price discovery and data-driven price discovery is one of the most important conceptual tools for interpreting short-term crude futures movements.
The next major ASX story will hit our subscribers first
The Refinery Throughput Variable That Most Analysts Underweight
Why Production Rates Shape Storage Outcomes More Than Demand Alone
Product inventory movements cannot be understood without incorporating refinery throughput data. The EIA weekly report includes refinery gross input and utilisation rate figures that provide the upstream production context necessary to correctly interpret whether a product draw is demand-driven or supply-constrained.
A draw caused by insufficient refinery output carries different price implications than a draw driven by surging consumption. In the former case, the inventory decline reflects a production bottleneck that refiners can potentially resolve through higher run rates or reduced maintenance downtime. In the latter case, the draw signals genuine demand strength that may persist regardless of refinery decisions.
Factors driving week-to-week refinery throughput volatility include:
- Planned seasonal maintenance cycles, particularly during shoulder seasons
- Unplanned outages from equipment failures or weather events
- Margin-driven run rate decisions, where refiners throttle throughput when crack spreads compress
- Export demand for refined products to Latin America and Europe, which competes with domestic supply replenishment
The decline in gasoline production to 9.6 million bpd and distillate production to 5.2 million bpd suggests throughput constraints were at least partially responsible for the product inventory draws, alongside demand absorption.
Geopolitical Wildcards That Could Accelerate or Reverse the Trend
Several geopolitical developments are running in parallel with the fundamental inventory picture and have the capacity to accelerate or reverse the current trajectory. In addition, the trade war oil impact on global demand expectations adds another layer of complexity to how these scenarios may ultimately resolve.
| Scenario | Trigger Conditions | Likely Inventory Outcome |
|---|---|---|
| Tightening Continues | Strong industrial demand, refinery constraints persist, no Iran deal | Distillate deficit widens toward 15-18% below 5-year average |
| Gradual Normalisation | Seasonal refinery shift to distillate mode, moderate demand | Inventories recover toward 5-year average by Q4 |
| Rapid Loosening | Iran deal materialises, OPEC+ accelerates output, demand softens | Crude builds accelerate; product deficit narrows quickly |
One underappreciated global factor is the impact of Ukrainian drone strike campaigns on Russian refinery operations. Ukraine's sustained drone campaign has driven Russian oil refining to a 24-year low. This matters for global refined product markets because Russian refinery capacity, when operational, serves regional markets that might otherwise draw on Atlantic Basin supply chains.
Additionally, Strait of Hormuz transit disruptions, which have contributed to subdued tanker traffic volumes in recent weeks, represent an ongoing supply-side risk that the crude futures market has not fully priced on a sustained basis. Any escalation that meaningfully impairs Middle Eastern crude flows would amplify the existing structural tightness in both crude and refined product inventories. The OPEC market influence on production decisions during such disruptions would be a critical variable to monitor closely.
Five-Year Average Comparisons as a Seasonal Calibration Tool
Market participants use the five-year seasonal average as the industry's standard baseline for assessing whether current inventory conditions are tight, balanced, or oversupplied. The current positioning across the storage complex breaks down as follows:
- Crude oil at 6% below the five-year average: Reflects moderate tightness, supportive of prices but not critically stressed
- Distillates at 12% below the five-year average: Represents significant structural tightness with limited seasonal buffer
Historical precedent shows that periods when distillate inventories have fallen more than 10% below seasonal averages have typically been followed by upward price pressure in heating oil and diesel futures, particularly as the market transitions from the summer driving season toward the winter heating demand cycle in the northern hemisphere.
If distillate inventories enter the October-to-November pre-winter build period already running 12% below the five-year norm, the cushion against a cold-weather demand spike is materially reduced. Furthermore, analysts at Investing.com note that US crude inventories have fallen to precariously low levels, reinforcing concerns that any prolonged cold snap in the northeastern United States or northern Europe during that period would have an amplified price impact compared to years when distillate stocks enter winter at or above seasonal averages.
Frequently Asked Questions: US Oil Product Inventories
What is the EIA Weekly Petroleum Status Report?
Published every Wednesday by the US Energy Information Administration, this report covers crude oil, gasoline, distillate, and other refined product inventory levels across the country. It includes refinery utilisation rates, import and export volumes, and total products supplied data. It is widely regarded as the most authoritative weekly snapshot of US petroleum supply and demand conditions.
Why do crude oil inventories sometimes build while product inventories fall?
Crude builds reflect incoming supply exceeding refinery intake at a given moment. Product draws reflect downstream consumption outpacing refinery output. These two dynamics coexist when refineries are processing crude but cannot replenish finished product stocks quickly enough to keep pace with demand.
What does being below the five-year average mean for oil prices?
When inventories fall below the five-year seasonal average, the market is considered structurally tighter than historical norms. Tighter inventories reduce the buffer against supply disruptions, typically supporting higher prices. The degree of the deficit determines the relative strength of the price support signal.
How do distillate inventory levels affect businesses and consumers?
Distillates include diesel fuel, heating oil, and jet fuel. Low distillate stocks can translate into higher diesel prices, elevated freight transport costs, and higher residential and commercial heating costs as the winter season approaches.
This article is intended for informational and educational purposes only and does not constitute financial, investment, or trading advice. Oil market conditions, inventory data, and geopolitical developments are subject to rapid change. Readers should conduct their own research and consult qualified financial professionals before making any investment decisions. Forecasts and scenario analyses presented in this article are speculative in nature and should not be relied upon as predictions of future market outcomes.
Want to Stay Ahead of the Next Major Resource Discovery Hiding in ASX Announcements?
While energy markets grapple with inventory signals and geopolitical wildcards, savvy investors know that the real edge comes from acting on significant mineral discoveries the moment they are announced — Discovery Alert's proprietary Discovery IQ model scans ASX announcements in real time, delivering actionable alerts across 30+ commodities so you never miss a market-moving discovery. Start your 14-day free trial at Discovery Alert today, or explore how historic discoveries have generated extraordinary returns for those who moved early.