July 24, 2026
When Geopolitics Overrides Fundamentals: Decoding the $100 Brent Moment
Brent near $100 on West Asia tensions is not a story about surging Chinese factory output or recovering aviation demand. There are periods in commodity markets when price signals stop reflecting the physical balance of supply and demand and instead become a mirror of collective fear. The oil market is in precisely one of those periods right now. It is a story about choke points, military posturing, depleted inventory buffers, and the oldest force in commodity pricing: the risk of losing access to something the world cannot do without.
Understanding what is actually driving this move, what could extend it, and what could reverse it requires looking well beyond the headline number.
When big ASX news breaks, our subscribers know first
The $100 Threshold: Psychological Trigger and Structural Signal
Why the Triple-Digit Level Still Matters to Markets
In futures markets, round numbers carry weight that extends beyond arithmetic. The $100-per-barrel level for Brent functions simultaneously as a technical resistance zone, a portfolio management trigger, and a policy alarm bell. When crude reclaims triple digits, airlines activate hedging programmes that were left dormant at lower price levels, shipping companies begin surcharging freight contracts, and energy-intensive manufacturers start revising capital allocation assumptions.
Historically, sustained periods of $100-plus Brent have produced predictable downstream consequences. Demand destruction tends to emerge first in price-sensitive import-dependent economies across South and Southeast Asia, where fuel costs represent a larger share of household expenditure and government subsidies face the greatest fiscal strain. This demand destruction dynamic is itself a self-correcting mechanism, but it operates with a lag, typically several months after prices have already inflicted economic damage.
The more immediate effect is institutional repositioning. Commodity trading advisors, macro hedge funds, and sovereign wealth funds all recalibrate risk parameters when Brent holds above $100. This repositioning adds momentum to the move while also seeding the eventual reversal, as profit-booking pressure builds with every dollar above the psychological threshold.
Tracing the Brent Rally: A Compressed Timeline
The speed of Brent's ascent in mid-to-late July 2026 was striking. From a pre-escalation baseline estimated around $85 to $90 per barrel, crude futures surged sharply once geopolitical events began stacking simultaneously rather than sequentially. These crude oil price trends underscore just how rapidly market sentiment can shift when multiple risk factors converge.
| Date | Brent Price | Key Driver |
|---|---|---|
| Mid-May 2026 | ~$85-$90 | Pre-escalation baseline |
| ~July 23, 2026 | $100.23 | First breach of $100 in two months |
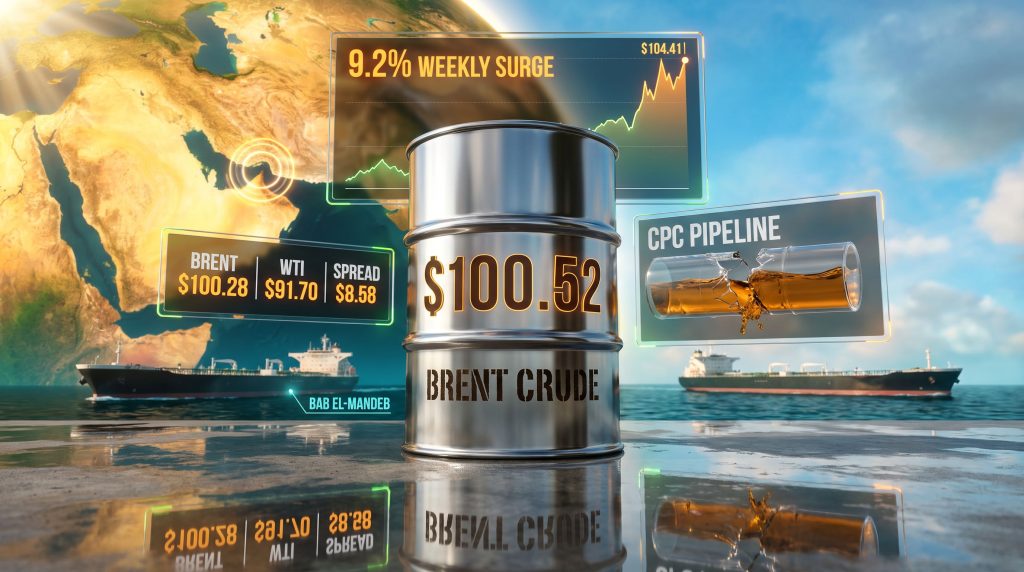
| July 24, 2026 | $100.28-$100.52 | Sustained geopolitical risk premium |
| Early week peak | $104.41 | Hormuz disruption fears at maximum |
| July 24 (close) | ~$100.28 | Profit-taking correction underway |
The intraweek swing from below $100 to an intraday high above $104, followed by a partial pullback, is consistent with the mechanics of a geopolitically driven spike: sharp initial repricing, brief stabilisation as buyers and sellers contest the new level, then a consolidation phase as traders assess whether the physical supply disruption is real or merely threatened.
Key Market Insight: Brent's approximately 9.2% weekly surge represents one of the sharpest short-term rallies in recent months. Critically, it was driven entirely by geopolitical risk premium rather than any measurable shift in underlying supply-demand fundamentals. When risk premium, rather than physical tightness, drives a rally of this magnitude, reversals can be equally abrupt.
What Is Driving the West Asia Oil Risk Premium in 2026?
The Strait of Hormuz: A Chokepoint With No Substitute
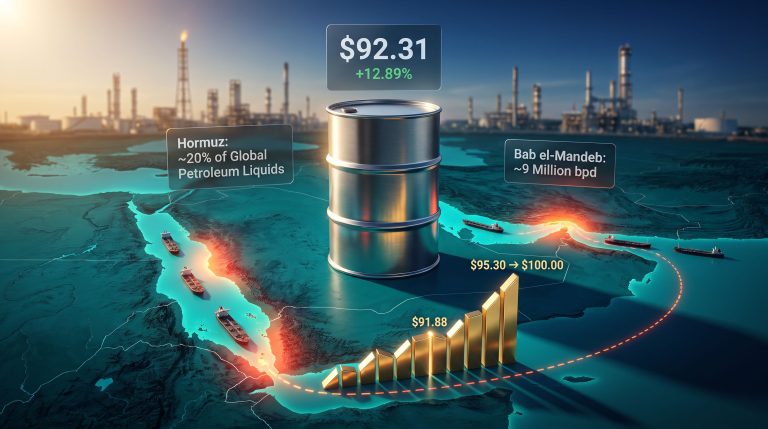
Approximately one-fifth of all globally traded oil transits the Strait of Hormuz daily. This narrow waterway between Iran and Oman represents the single most consequential bottleneck in the global energy system, and it has no viable alternative routing for Persian Gulf producers. Unlike Suez Canal disruptions, which re-route vessels via the Cape of Good Hope at cost, a Hormuz closure scenario would strand supply at the source.
This would affect Saudi Arabia, the UAE, Kuwait, Iraq, and Qatar simultaneously. What makes Hormuz particularly dangerous as a risk variable is that disruption does not need to be physical to move prices. The credible threat of closure is sufficient to trigger repricing, and geopolitical market risks of this nature have a well-documented history of generating outsized price responses across commodity markets.
Iran has repeatedly signalled its willingness to use Hormuz access as leverage in diplomatic and military confrontations, and markets have consistently responded to those signals with immediate upward pressure on crude benchmarks. The U.S. military conducting thirteen consecutive nights of strikes on Iran as of late July 2026 represented the kind of sustained military posture that markets interpret as materially elevating the probability of Iranian retaliatory action targeting shipping or production infrastructure.
The Red Sea and Bab el-Mandeb: A Second Chokepoint Under Stress
While the Hormuz scenario captures the most extreme tail risk, the more immediately active disruption in mid-2026 centred on the Red Sea corridor. Houthi attacks on Saudi oil tankers introduced renewed uncertainty around the Bab el-Mandeb Strait, the southern entry point to the Red Sea connecting the Gulf of Aden to European-bound shipping lanes.
The Bab el-Mandeb is particularly relevant for Gulf producers routing crude westward toward Mediterranean and European markets. When this corridor is compromised, tankers must divert around Africa's Cape of Good Hope, adding roughly 10 to 14 days to transit times and substantially inflating freight costs. That rerouting pressure compounds inflationary effects on energy-importing economies before a single barrel of physical supply is actually lost.
Market analysis has flagged that a significant disruption to Red Sea shipping, layered on top of already-depleted global oil inventories, could propel Brent crude tops $100 toward the $120-per-barrel level. This is not a fringe scenario; it is the base case under conditions of further escalation without diplomatic intervention. (ET EnergyWorld, July 2026)
Kazakhstan's CPC Suspension: The Supply Shock Nobody Was Watching
Less prominently covered but critically important to understanding the full picture was Kazakhstan's decision to suspend crude exports through the Caspian Pipeline Consortium following drone strikes on pipeline infrastructure. The CPC pipeline is the primary export route for Kazakh crude reaching global markets, transiting roughly 1.5 million barrels per day toward the Black Sea terminal at Novorossiysk under normal operating conditions.
Kazakhstan is one of the larger non-OPEC producers, and CPC disruptions have a documented history of creating short-term supply tightness in European crude markets. The suspension in July 2026 added a third simultaneous supply-side risk event to a market already pricing in Hormuz tail risk and Red Sea disruption. This reinforced the narrative of multi-front supply vulnerability that accelerated institutional buying in crude futures, distinguishing this episode from typical single-theatre geopolitical spikes.
The Iran Dimension: Military Escalation and Tail-Risk Pricing
Presidential threats of a massive strike on Iran, combined with confirmed sustained military operations, introduced tail-risk scenario analysis into crude options markets. When sovereign-level actors issue explicit escalatory language, implied volatility in oil options rises sharply, increasing the cost of hedging and incentivising directional positioning among momentum traders.
UN Secretary-General António Guterres publicly characterised the regional situation as approaching the edge of something catastrophic — language that carries outsized signal value precisely because multilateral diplomatic channels typically employ measured understatement. When that register breaks, markets pay attention. Furthermore, the combination of presidential rhetoric and sustained military action created a particularly volatile pricing environment that analysts noted was reminiscent of earlier regional crisis episodes.
How Are Oil Markets Responding? Price Action and Positioning
MCX Crude Futures: India's Domestic Market Reaction
India's domestic crude derivatives market reflected the global volatility with elevated activity during the disruption window. On the Multi Commodity Exchange, crude futures for August delivery declined by Rs 148, or 1.64%, to Rs 8,876 per barrel, with trading volume reaching 17,232 lots, indicating above-average participation levels during the profit-taking session. The September contract fell Rs 154, or 1.79%, to Rs 8,426 per barrel across 2,125 lots. (ET EnergyWorld, PTI, July 24, 2026)
These declines reflected systematic profit-booking after the strongest weekly crude rally in months, a behavioural pattern that is structurally predictable following parabolic moves in commodity futures.
WTI vs. Brent: The Diverging Benchmark Spread
| Benchmark | Contract Month | Price (July 24, 2026) | Change |
|---|---|---|---|
| Brent Crude | September | $100.28/bbl | Marginal decline |
| WTI Crude | September | $91.70/bbl | -0.53% |
| MCX Crude | August | Rs 8,876/bbl | -1.64% |
The approximately $8.58 Brent-WTI spread is a telling indicator of how geographically concentrated the risk premium has become. WTI reflects U.S. domestic supply dynamics, which benefit from growing Permian Basin output, shale production flexibility, and relative insulation from Middle Eastern supply route disruptions. Brent, as the international benchmark, absorbs the full weight of Hormuz, Red Sea, and geopolitical premium.
When this spread widens significantly, it signals that the market is pricing a geographically specific risk rather than a global demand surge. Traders who understand this distinction can position accordingly, recognising that a diplomatic resolution in West Asia would compress the spread rapidly.
Why Profit-Taking at $100 Is Structurally Rational
Institutional risk management frameworks treat round-number psychological thresholds as natural points for partial position liquidation. This is not because traders believe $100 is a fundamental ceiling; it is because the risk-reward calculus shifts at well-publicised levels where counter-positioning tends to cluster. Algorithms, option strikes, and portfolio hedges all concentrate around $100, creating natural selling pressure regardless of the directional narrative.
The pullback from intraday highs above $104 to settlement near $100.28 on July 24 reflects this mechanical reality rather than any genuine reassessment of geopolitical risk. Until underlying military or diplomatic conditions change, the risk premium is unlikely to dissipate simply from profit-taking activity.
What Could Push Brent to $120, and What Brings It Back Down?
Upside Pathways: The Conditions for a Further Leg Higher
Conditions that could accelerate Brent toward $120 or beyond:
- A full or partial Hormuz closure affecting Persian Gulf export volumes collectively
- Iranian retaliatory strikes targeting oil production or export terminal infrastructure
- Military escalation reaching Saudi Arabian production facilities, mirroring the severity of the 2019 Abqaiq drone attack, which temporarily knocked out approximately 5% of global daily oil supply
- An extended CPC pipeline suspension beyond initial operational timelines
- Accelerating inventory drawdowns confirming that the current depletion trend has no near-term reversal mechanism
- Demand resilience in Asian economies proving stronger than historical precedent at similar price levels, preventing the demand-destruction self-correction from activating
Downside Scenarios: What Deflates the Risk Premium
Factors that could return Brent below $90:
- Diplomatic de-escalation brokered through multilateral channels, with Qatar, Oman, or Turkey serving as potential intermediaries given their historical roles in regional mediation
- Coordinated Strategic Petroleum Reserve releases by the United States and IEA member nations, which have been flagged in some market reports as being actively prepared
- The OPEC influence on oil markets materialising through accelerated production increases to compensate for disruption-related supply fears, a lever the group has used in previous crisis episodes
- A stronger U.S. dollar reducing crude's purchasing power for importing nations, dampening demand at the margin
- Demand destruction emerging in price-sensitive South and Southeast Asian economies at sustained $100-plus levels, introducing the self-correcting mechanism described earlier
Global Inventory Depletion: The Hidden Amplifier
Why Thin Inventory Buffers Magnify Every Geopolitical Event
One of the least discussed but most structurally important dynamics behind the July 2026 crude spike is the state of global oil inventories. Months of continuous drawdown have eroded the buffer that historically absorbs short-term supply disruptions without generating material price dislocations.
When inventories are well-stocked, a two-week pipeline suspension or a temporary tanker rerouting event is absorbed by releasing stored barrels into the market. Prices may tick higher but the move is contained. When inventories are depleted, as they were heading into the West Asia escalation in mid-2026, the same physical disruption creates an outsized price response because there is no inventory release mechanism available at scale.
This is why market analysts specifically flagged the combination of Red Sea disruptions and depleted inventories as a pathway to $120 per barrel. It is not the disruption alone; it is the disruption in the context of a market with no shock absorbers.
OPEC+ Production Constraints and Their Role in the Price Environment
OPEC+ output decisions made earlier in 2026 constrained the available surge capacity that could otherwise be deployed to offset disruption scenarios. Consequently, the OPEC demand outlook for the remainder of the year has become increasingly difficult to calibrate against a backdrop of military escalation and supply route uncertainty. Saudi Arabia's production posture involves balancing fiscal breakeven requirements, which analysts have estimated at approximately $80 to $85 per barrel for the kingdom's budget, against longer-term market share considerations.
The combination of policy-constrained production flexibility and logistically threatened export corridors creates a compounding vulnerability that markets are now actively pricing.
The next major ASX story will hit our subscribers first
What Does $100 Oil Mean for Key Global Stakeholders?
Impact on India: Asia's Most Exposed Major Importer
India imports approximately 85% of its crude oil requirements, making it among the most structurally exposed major economies to Brent price movements. Every $10-per-barrel increase in Brent adds an estimated $12 to $15 billion annually to India's import expenditure, widening the current account deficit and placing pressure on the rupee.
Domestic fuel subsidy management becomes acutely difficult when Brent sustains above $90 to $100. The government faces a constrained choice between absorbing the cost through fiscal expenditure, passing it through to consumers via retail fuel price increases, or accepting currency depreciation that distributes the burden more broadly across the economy.
The MCX crude futures market activity during the July 2026 episode, with 17,232 lots traded on the August contract alone during a single volatile session, illustrates how intensively India's commodity market participants monitor and respond to international crude benchmarks.
Impact on Global Shipping and Trade Logistics
Elevated oil prices directly inflate bunker fuel costs for global shipping, flowing through to freight rates across all commodity categories from grain to consumer electronics. The trade war oil impact compounds these pressures further, as protectionist trade measures reduce shipping volumes while simultaneously making remaining freight more expensive to transport. The Red Sea route avoidance already underway due to Houthi attacks forces vessels onto longer Cape of Good Hope routings, adding 10 to 14 days to transit times and further compressing shipper margins.
Energy Transition Economics at $100 Brent
There is a structural paradox embedded in sustained high oil prices. Historically, Brent above $100 has accelerated investment in renewable energy infrastructure and electric vehicle adoption by narrowing the cost competitiveness gap between fossil fuels and alternatives. Capital flows toward clean energy tend to strengthen when the opportunity cost of oil dependence becomes visible and measurable.
Simultaneously, high oil revenues strengthen the fiscal positions of petrostate economies, reducing the urgency of their own energy transition commitments. For investors, this creates a bifurcated opportunity: near-term upside in integrated oil majors and energy services equities, while longer-term clean energy capital expenditure cycle accelerates in parallel.
Strategic Outlook: Three Scenarios for the Next 90 Days
| Scenario | Trigger Conditions | Brent Price Range |
|---|---|---|
| Escalation | Hormuz disruption, Iranian retaliation strikes | $110-$130/bbl |
| Status Quo | Tensions persist without major physical supply loss | $95-$105/bbl |
| De-escalation | Ceasefire, SPR releases, OPEC+ production surge | $80-$92/bbl |
Key Indicators to Monitor Closely
- Shipping insurance rates through Hormuz and Red Sea corridors, which function as a real-time leading indicator of perceived disruption probability among commercial operators
- U.S. and IEA strategic reserve release announcements, which would signal coordinated governmental intervention intent
- OPEC+ emergency meeting signals originating from Riyadh or Abu Dhabi, which would indicate the group is preparing to deploy spare capacity
- Weekly EIA inventory data confirming whether drawdowns are accelerating, stabilising, or reversing
- Diplomatic channel activity involving Qatar, Oman, or Turkey, nations with established mediation relationships in regional conflict environments
Bottom Line for Investors: The current Brent near $100 on West Asia tensions environment is not a demand story. Global economic growth has not accelerated sufficiently to justify $100 oil on consumption fundamentals alone. The entire premium above approximately $80 to $85 per barrel represents a geopolitical risk surcharge. That surcharge can unwind as abruptly as it accumulated if diplomatic conditions improve, or it can compound rapidly if military escalation continues toward infrastructure targets. Position sizing and risk management should reflect this binary character rather than treating the current level as a new fundamental equilibrium.
This article contains forward-looking scenarios and market analysis that involve assumptions about geopolitical developments and commodity price trajectories. Such projections are inherently uncertain and should not be construed as financial advice. Readers should conduct their own independent research before making investment decisions.
Want to Stay Ahead of Commodity Market Shifts Driven by Geopolitical Events?
Discovery Alert's proprietary Discovery IQ model scans ASX announcements in real time, instantly identifying high-potential mineral discoveries across 30-plus commodities — cutting through market noise to deliver actionable insights the moment they matter most. Explore how historic discoveries have generated exceptional returns and begin your 14-day free trial today to secure a genuine market-leading edge.